Benchmarking is a powerful tool for family businesses. Done well, benchmarking provides managers and directors with valuable insight and context for evaluating the operating performance of the family business and the strategic investing and financing decisions made by their leaders. Comparison may be the thief of joy, but unfortunately for family businesses, ignorance is not in fact bliss.
This blog post summarizes some of our findings related to financing, operating, investing, and distribution activities. For a comprehensive and detailed report on all the above questions, be sure to check out our 2022 Benchmarking Guide for Family Business Directors.
For our benchmarking report, we have used the Russell 3000 Index Companies, excluding Financial Institutions, Real Estate companies, and Utilities. We also excluded companies with less than $10 million of revenue in 2021. We have also sorted the data into five quintiles based on company sizes as well as industries.
How Much Money Do Companies Like Ours Make?
While Wall Street often looks at earnings, EBITDA is the key earnings measure for family businesses. EBITDA serves as a proxy for discretionary cash flow available to service debt, pay taxes, fund reinvestment, and provide for shareholder distributions. EBITDA promotes comparability among firms with different capital structures, tax attributes, and fixed asset intensity.
The following chart summarizes the influence of industry on EBITDA Margin for CY21.
2021 EBITDA Margin by Industry
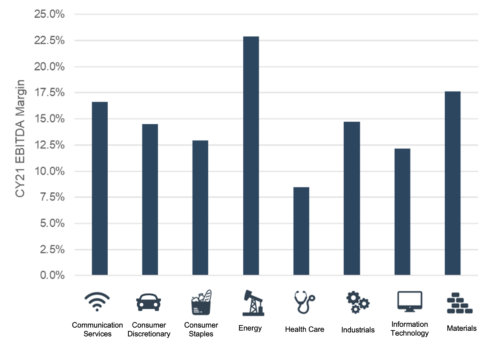
The overall average EBITDA Margin for the entire group was 14.3%. However, as depicted in the preceding chart, there is significant variation among different industry sectors analyzed. Asset-Intensive industries, including Energy and Materials, earned higher EBITDA margins in 2021, buoyed by energy and commodity pricing. In Table 2, we summarize the effect of company size on EBITDA margin.
2021 EBITDA Margin by Company Size
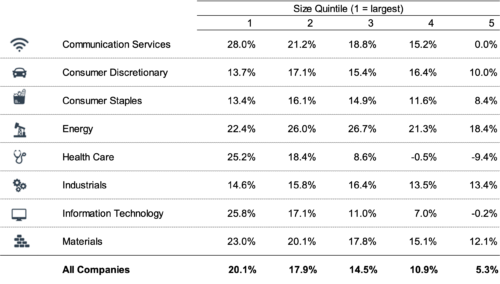
Generally, comparing average EBITDA margins across different sized companies confirms the importance of economies of scale. Larger companies tend to earn higher margins and outpace the smaller companies.
How Much Money Do Companies Like Ours Invest?
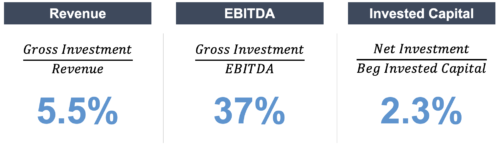
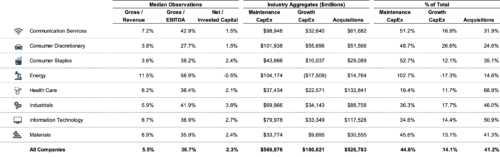
One prominent question for family business directors is, “How much should we invest?” Our tip: it depends. We analyzed corporate investment in the form of capital expenditures and M&A activity relative to EBITDA (gauging investment relative to cash flow), revenue (removing the effect of profitability on investment), and invested capital (assessing investment relative to previous investments).
Excluding maintenance capital expenditures, spending on acquisitions exceeded growth capital expenditures by 160%.
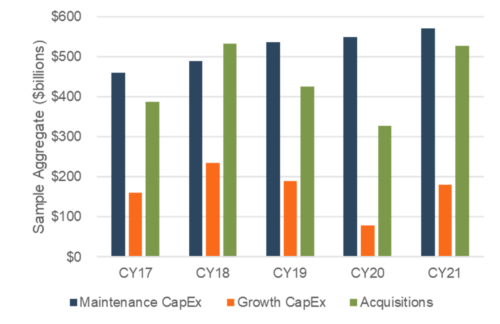
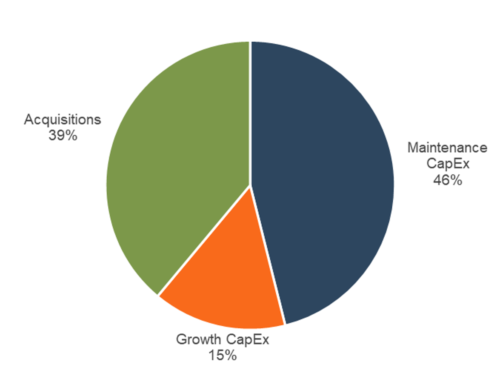
The median level of capital expenditure relative to EBITDA ranged from 28% (consumer discretionary) to 57% (energy). Consumer discretionary firms allocated more net investment dollars to growth CAPEX, while M&A was the primary form of investment for health care, information technology, and industrial companies.
Click here to enlarge this image
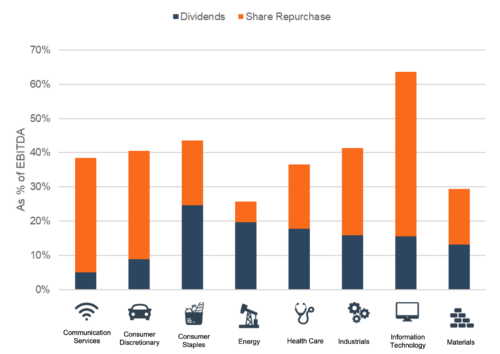
How Much Money Do Companies Like Ours Distribute?
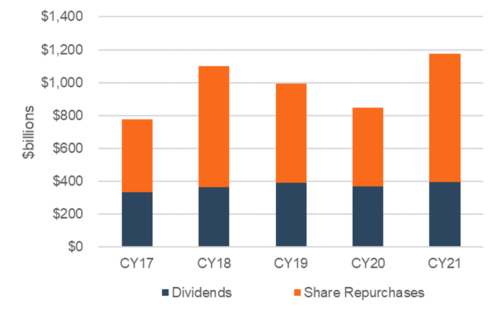
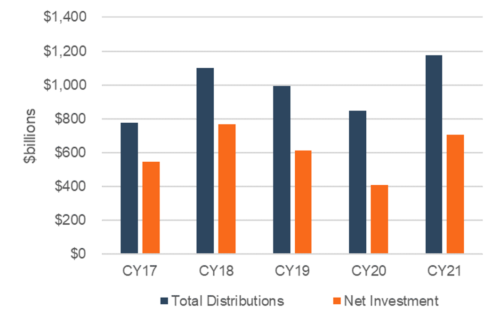
Dividend policy is one of the most important decisions for a family business (see our Family Business Dividend Survey for more) Looking at benchmarking data can help you analyze the best strategy for you. Public companies generally prefer a sustainable level of dividends that can withstand temporary downturns in performance. As a result, aggregate share purchases exceeded dividends paid during the preceding five years. For the universe of companies we analyzed, total distributions (dividends + share repurchases) exceeded net investment by over 60% for the period.
The following table summarizes aggregate distribution trends and compares them against available investment opportunities.
In our sample of companies, 15% did not repurchase any shares nor did they pay any dividends, while 37% did both. Only 6% of companies only paid dividends, while 42% of companies only repurchased shares. Approximately one-fourth of the companies in our sample reported a net loss during CY21, however, 66% of these companies still made a distribution to shareholders. Of the profitable companies in our sample, approximately 22% made total distributions in excess of total net income in CY21, while about 9% chose not to make any distributions at all. Distributions also varied greatly by industry. Capital intensive industries such as communication services devote a smaller portion of cash flow to shareholder distributions. Relative to consumer staples companies, consumer discretionary companies hedge their higher volatility by relying more on share repurchases than dividends. Information technology companies were the most aggressive share repurchasers.
How Much Money Do Companies Like Ours Borrow?
“Debt” is often a four-letter word with family business directors, who often skew toward conservatism in their capital structure. But how do smaller public companies compare?
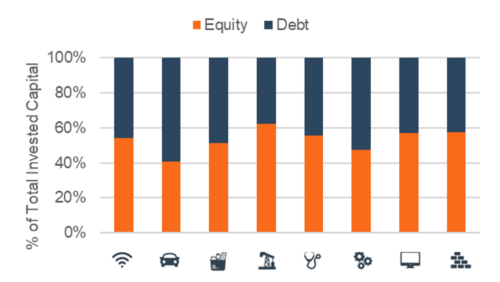
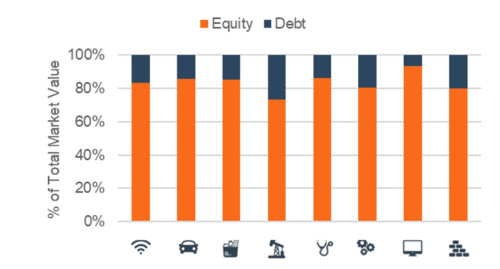
Financial leverage can be measured by comparing total debt to invested capital (book values of debt and equity), market values, or relative to cash flow. On a market value basis, leverage at the end of 2021 ranged from 6% (IT) to 27% (Energy).
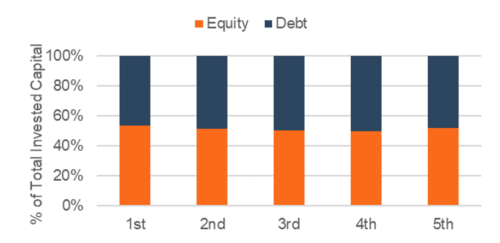
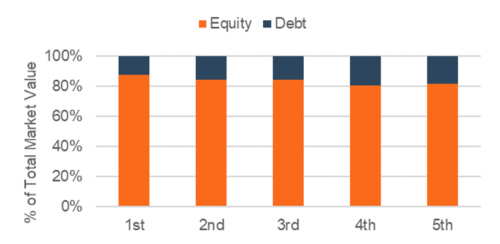
There is little discernable size effect with respect to book or market values. However, lower EBITDA margins on the part of the smaller firms increase the aggregate ratio of debt to EBITDA for such firms. 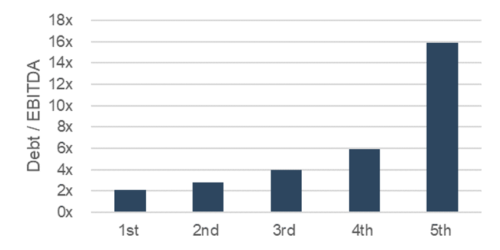
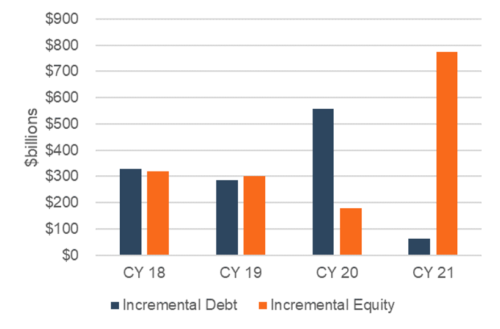
With respect to the companies in our sample, the use of debt is evenly distributed, with approximately 28% of companies having less than 20% debt in their capital structure, 46% between 20% and 60%, and 25% above 60%. Health care and IT firms are most likely to avoid debt, while companies in the communication services, energy, and consumer discretionary sectors are more likely to fund capital needs with larger debt. Assessing the annual change in debt and equity balances reveals how companies view the marginal costs of incremental financing needs. On a relative basis, the companies in our sample borrowed most aggressively during CY20 in the face of the economic slowdown resulting from the response to COVID-19. Companies relied on incremental equity financing at the margin in 2021.
Download your complimentary copy of the 2022 Benchmarking Guide for Family Business Directors, which gives you an in-depth analysis of the topics discussed here as well as discusses additional questions, including:
What are investment hurdle rates for companies like us?
How fast should companies like us grow?
What kind of return do companies like us generate for their shareholders?
For more targeted insights and observations, give one of our professionals a call to talk about a more customized benchmarking analysis for your family business.