Just Released: 2023 Benchmarking Guide for Family Business Directors


Growing up playing football, the team would gather after every game to run back the tape and review film. Rewatching games where you made a big play and the team won was always a good feeling. A loss? As my college coach from East Tennessee used to say, “Katy, bar the door.”
If 2021 was a comeback win for a lot of companies after the COVID-19 downturn, 2022 was like running into a stonewall defense. Rising interest rates, breakneck inflation, and the Russia-Ukraine conflict stifled offenses like the ’85 Bears. But despite some bumps and bruises, the tape was more favorable than one might have expected. While shareholder returns were down with a broad decline in equity markets, EBITDA margins held up, albeit unevenly across industries, and total distributions (distributions and share repurchases) rose considerably over 2021. Or for a coaching cliché: “The game was really a lot closer than the scoreboard would indicate.”
We are happy to share the release of our 2023 Benchmarking Guide for Family Business Directors. Benchmarking helps provide valuable context to directors when making their most critical decisions: what should our dividend policy be, what investments should we make, and how should we finance our business? For our benchmarking report, we have used the Russell 3000 Index Companies, excluding financial institutions, real estate companies, and utilities. We also excluded companies with less than $10 million in revenue in 2022. We have also sorted the data into five quintiles based on company sizes and the following industries.

This blog post summarizes some of our financing, operating, investing, and distribution findings. For a comprehensive and detailed report on all the above questions, download the full guide.
How Much Money Do Companies Like Ours Make?
Inflation may have originally been billed as transitory and only here for a short visit, but 2022 showed us CPI is not taking the hint. The 12-month percentage change in Consumer Price Index, or CPI, has run north of 2% every month since March of 2021, with 2022 exceeding 6% the entire year. Red-hot inflation does appear to have been finally shown the door, with growth peaking in June 2022, but CPI is still well above recent historical norms and Federal Reserve targets.
The chart below shows the number of industry constituents who saw gross margin increases and decreases in 2022 relative to 2021. Strong results in the energy sector masked gross margin challenges across other industries as companies struggled to adapt to an inflationary environment not seen since the early 1980s. The majority of energy companies saw gross margin expansion, while the majority of companies in all other industry sectors saw gross margin decline.
Gross Margin Year-Over-Year

How did costs affect the bottom line? While Wall Street often looks at earnings, EBITDA is the key earnings measure for family businesses. EBITDA serves as a proxy for discretionary cash flow available to service debt, pay taxes, fund reinvestment, and provide for shareholder distributions. The table below highlights EBITDA margins by industry in 2022 and 2021.
EBITDA Margin Year-Over-Year
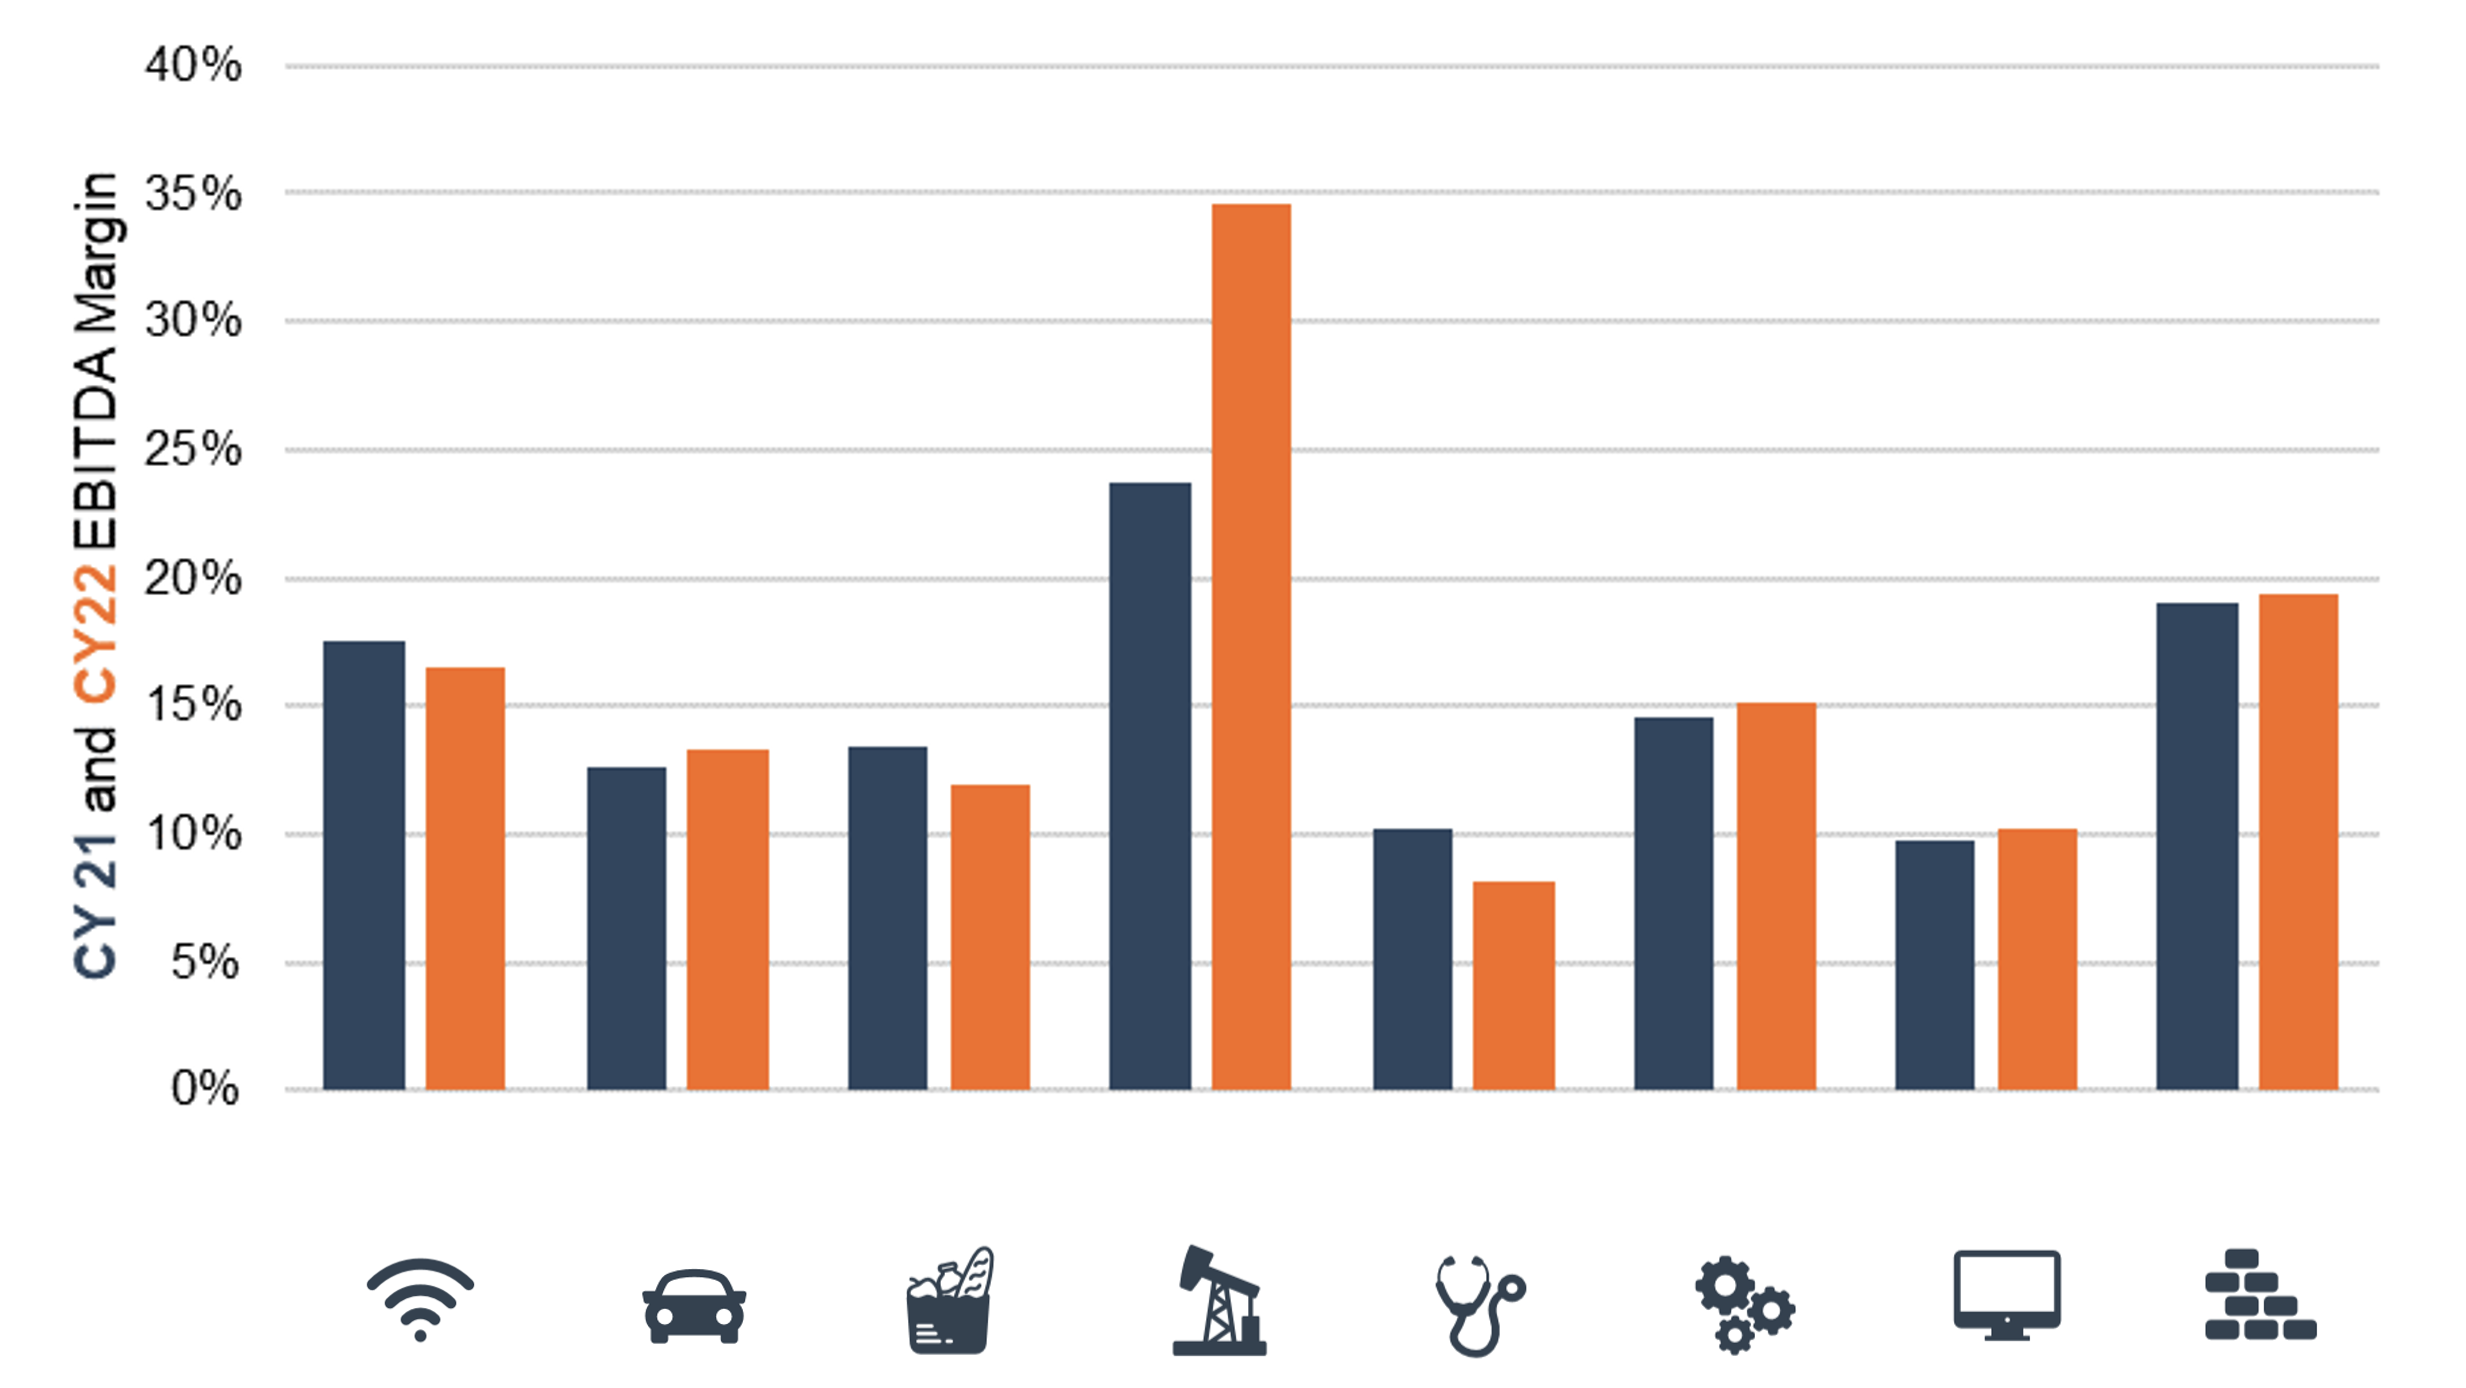
Following gross margins, EBITDA margins compressed in certain industries as pricing pressure affected industries less able to pass along price increases or reduce operating expenses. Communication services, consumer staples, and healthcare all saw year-over-year EBITDA margin declines. The energy sector saw the largest change in margin, with improving oil prices serving as a tailwind to the sector.
What is The Hurdle Rate for Companies Like Ours?
The Fed aggressively took on the challenge of inflation. It increased rates precipitously in the middle and back half of 2022, with four 75 basis point increases between June and November of 2022. The Fed Funds Target range went from 0% to 0.25% in early 2022 to 4.25% to 4.50% by year-end.
The weighted average cost of capital is the blended return expectation of lenders and shareholders. We calculate the cost of each capital source and the weighted average regarding the market value of total capital. WACCs are generally higher for smaller and perceived riskier companies.
Companies use hurdle rates to help screen out potential investments. All family businesses face capital constraints, meaning they could invest in more investments than they should invest in. Along with a robust strategic review, using a hurdle rate (often the WACC) can help directors limit review of potential projects to those that are financially feasible.
Weighted Average Cost of Capital
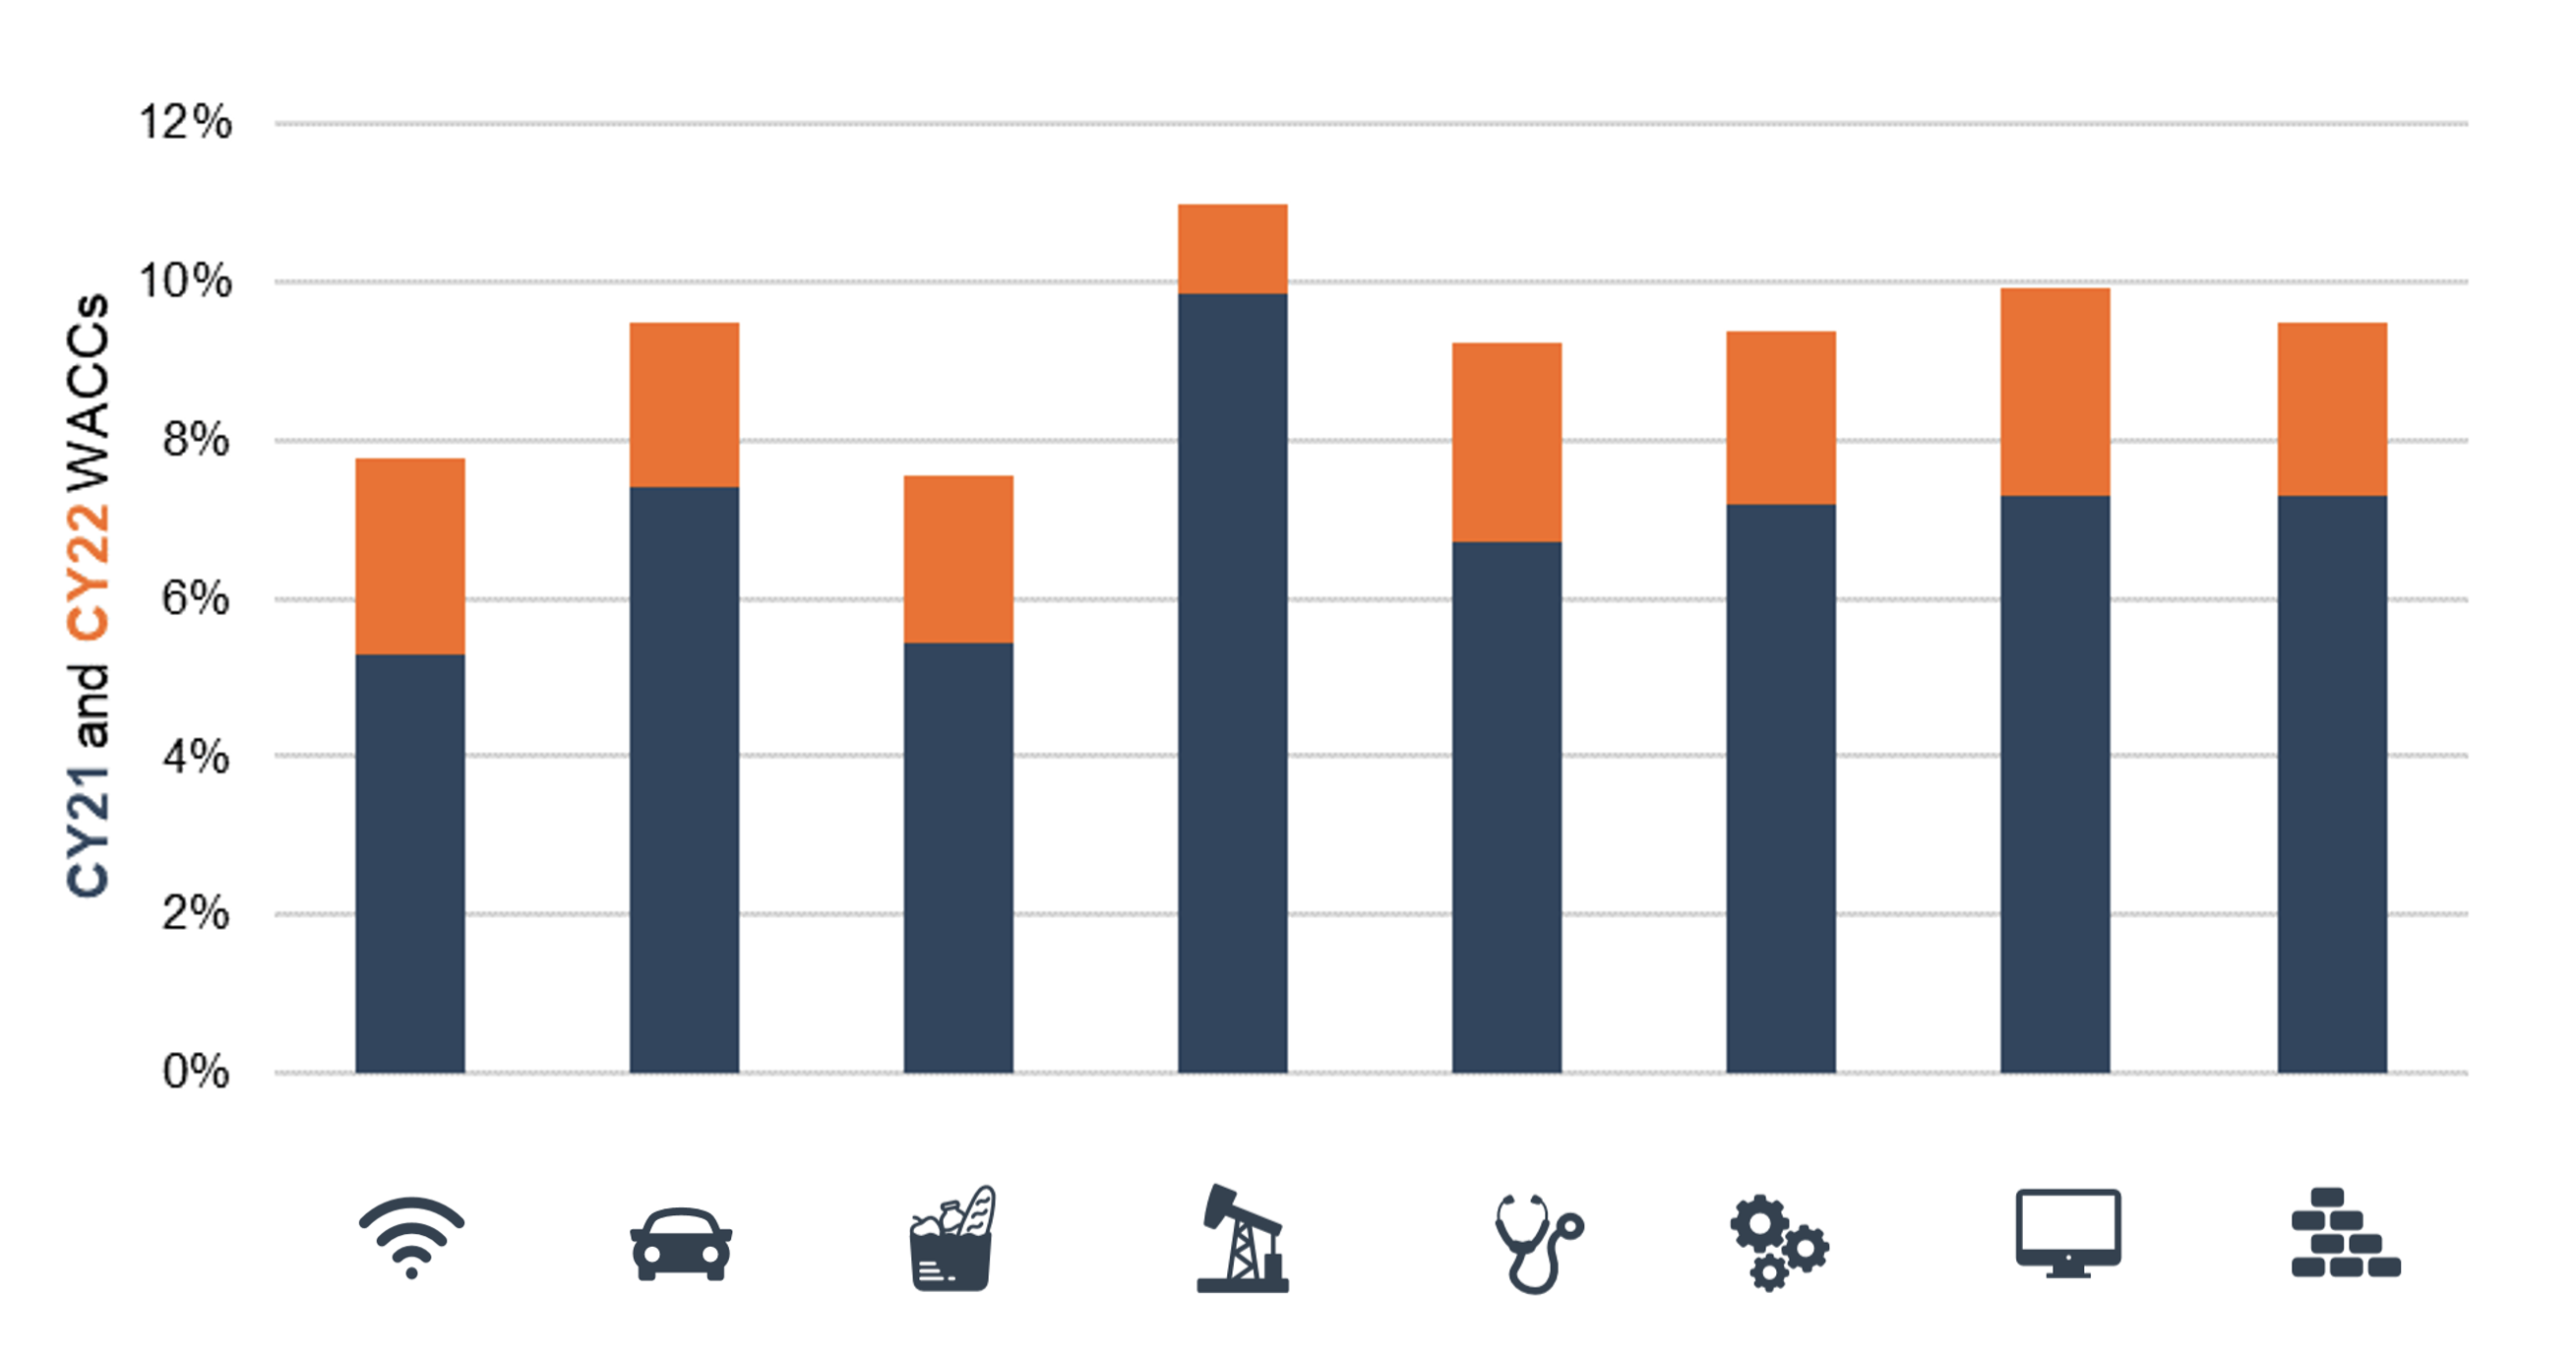
As shown above, calculated WACCs in 2022 were over 2.0% higher than in 2021 on average. Increase in interest rates, with 20-Year Treasury rising from 1.94% to 4.14% from year-end 2021 to year-end, the main driver. Borrowing costs (as reflected in BBB Corporate Bond Yields) were also up in line with treasuries.
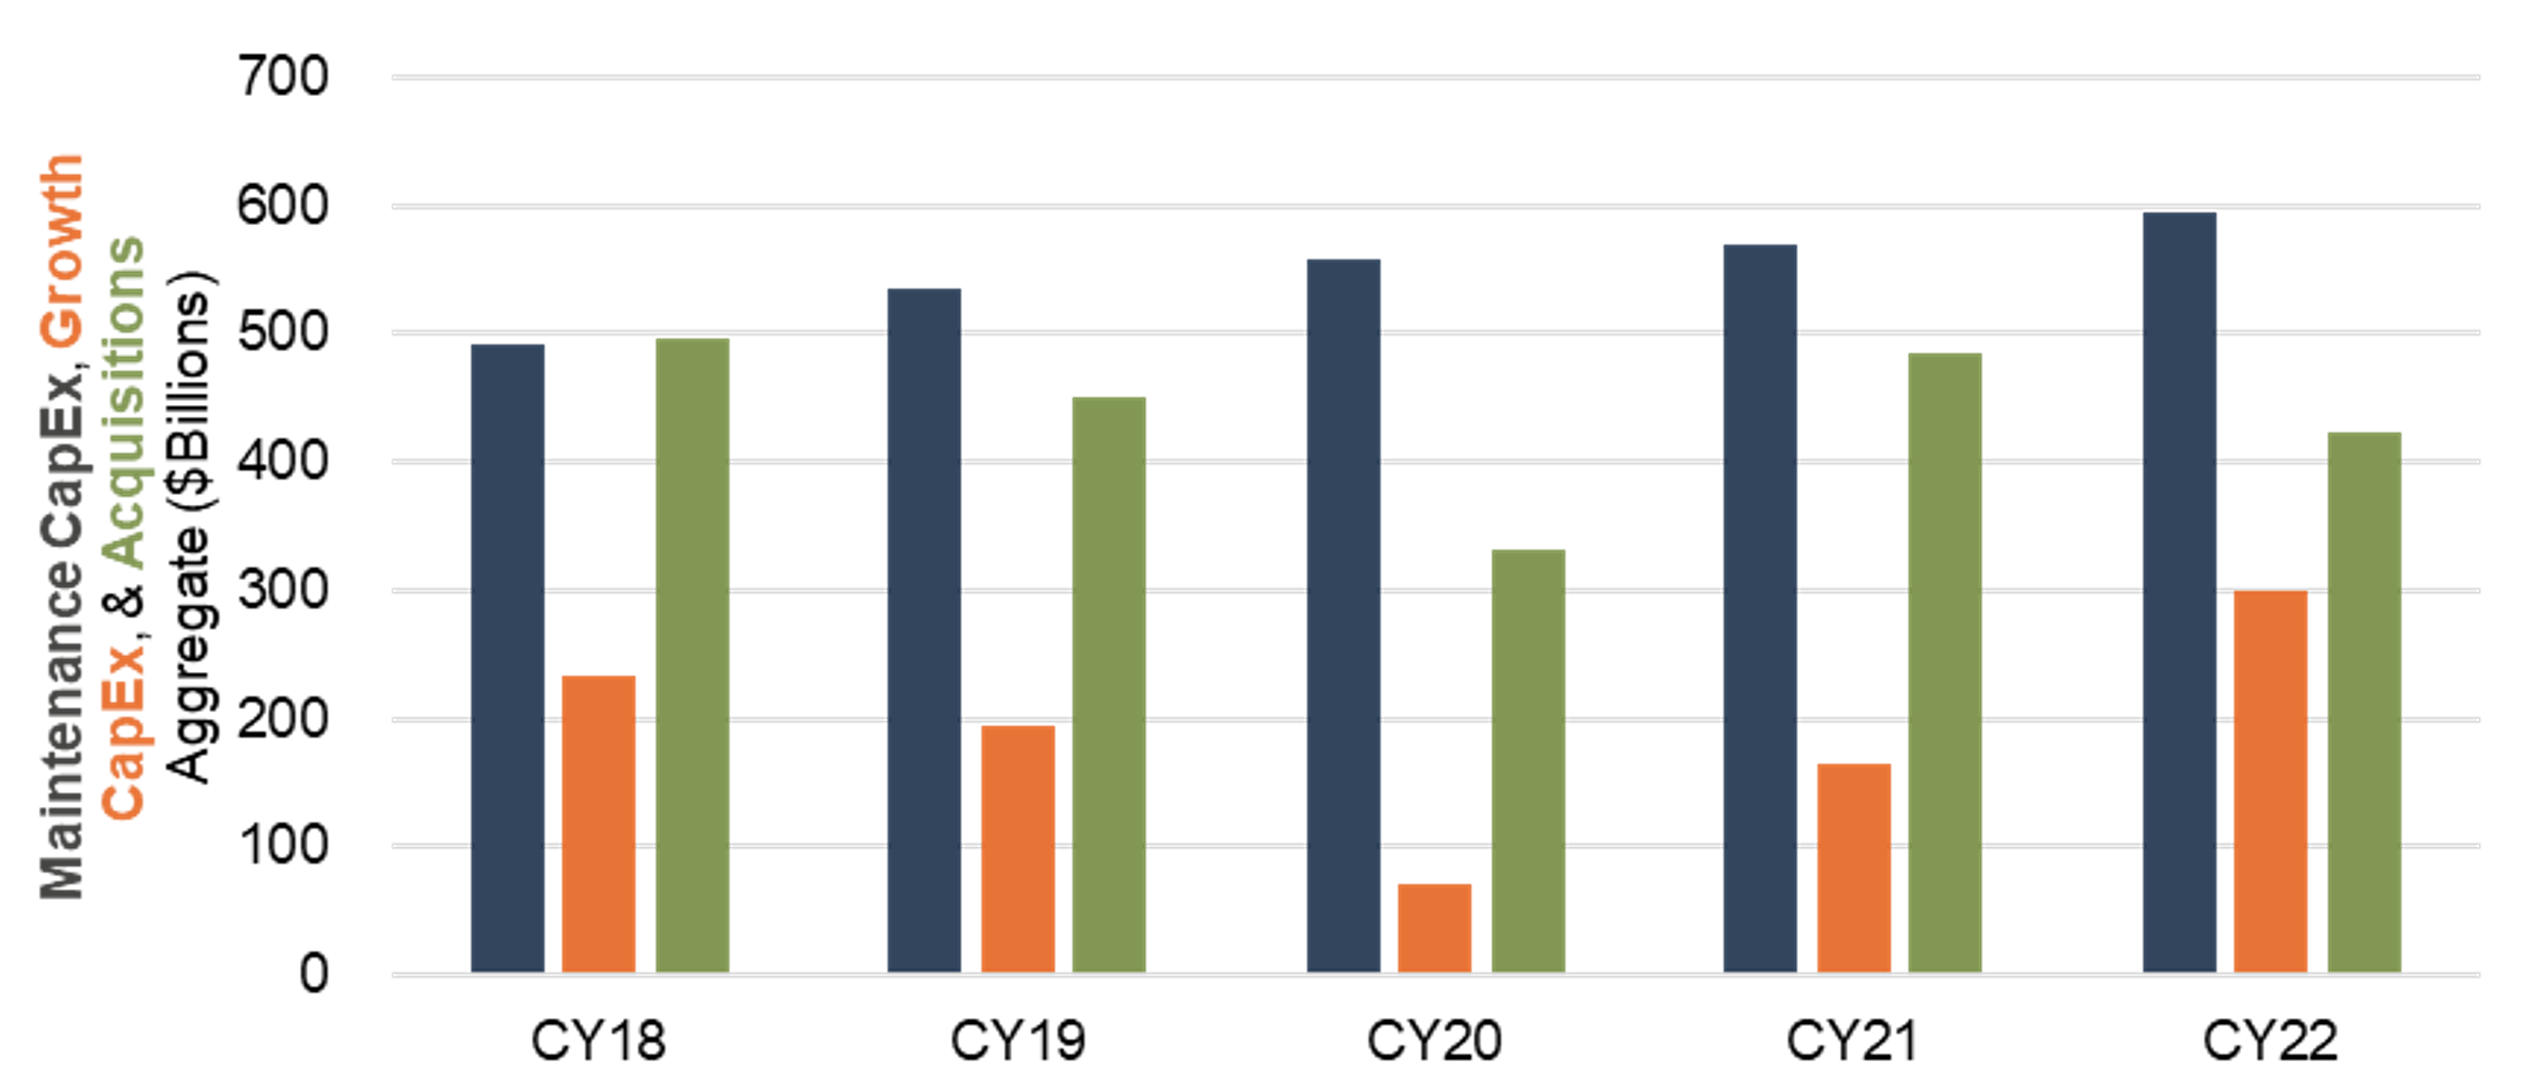
What’s the impact? Higher WACCs mean higher hurdle rates for companies and family businesses. This changes the calculus in reviewing potential projects and determining what is financially feasible for the business, affecting capital allocation and investment decisions. The chart below tracks aggregate spending on maintenance and growth capital expenditure, as well as acquisitions for the companies in the sample. Spending on acquisitions decreased in 2022 amid higher capital spending totals. Higher hurdle rates likely influenced this spending shift, as project-specific hurdle rates tied to acquisitions became perhaps less palatable to boards of directors. With more rate hikes occurring in 2023 and potentially more in the offing, 2023 could see further shifts in capital allocation decisions as we off-ramp the low/no interest rate environment.
Aggregate Investment Trends
Download your complimentary copy of the 2023 Benchmarking Guide for Family Business Directors, which gives you an in-depth analysis of the topics discussed here as well as discusses additional questions, including:
- How much money do companies like ours distribute?
- How much money do companies like ours borrow?
- How fast should companies like ours grow?
- What kind of return do companies like us generate for their shareholders?
For more targeted insights and observations, call one of our professionals to talk about a customized benchmarking analysis for your family business.