Basics of Financial Statement Analysis
Part 1: The Balance Sheet


This post is the first of four installments from our Basics of Financial Statement Analysis whitepaper. In this series of posts, our goal is to help readers develop an understanding of the basic contours of the three principal financial statements. The balance sheet, income statement, and statement of cash flows are each indispensable components of the “story” that the financial statements tell about a company.
The balance sheet summarizes a company’s financial condition as of a particular date. Similar to a photograph, the balance sheet does not record any movement, but preserves a record of the company’s assets, liabilities, and equity at a particular point in time. The fundamental accounting equation, as illustrated in Exhibit 1, is intuitive: Assets = Liabilities + Equity.
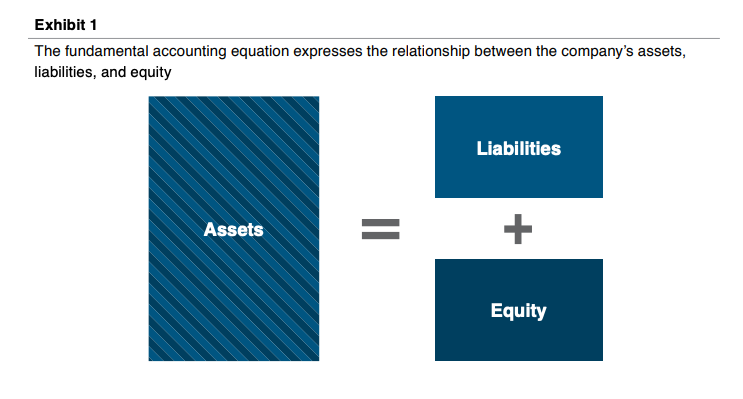
The balance sheet “balances” because what the company owns (the left side of the balance sheet) is ultimately traceable either to a liability (an amount that is owed to a non-owner) or equity (the net or residual amount attributable to the company’s owners). In broad strokes, the balance sheet relationships are analogous to the economics of home ownership – the equity in one’s home is equal to the excess of the value of the house at a particular time over the corresponding mortgage balance. Equity value can grow through either (1) appreciation in the value of the house, or (2) repayment of the mortgage. In either case, equity is the residual amount.
Principal Asset & Liability Groupings
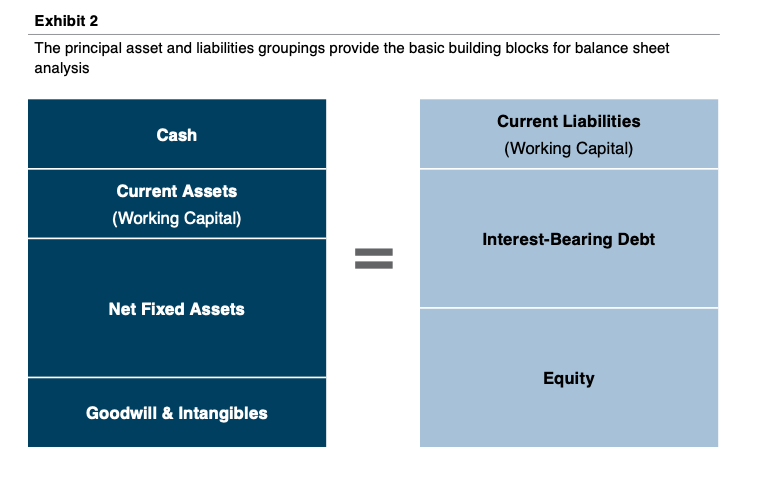
An experienced reader of financial statements can learn a lot about a company’s operations, strategy, and management philosophy by reviewing the balance sheet. The relative proportion of the major asset and liability groupings will differ on the basis of whether the company is a manufacturer, retailer, distributor, or service provider. Similarly, the relative proportion of liabilities and equity provides insight into the risk tolerances and financing preferences of the company’s managers and directors.
Exhibit 2 summarizes the principal asset and liabilities groupings for operating companies. While many of the concepts are similar, analyzing the financial statements of financial companies (banks, insurance companies, etc.) is outside the scope of this article.
Cash & Equivalents
Cash is a surprisingly slippery asset in the context of balance sheet analysis. On the one hand, cash is king, and it is essential that the company have sufficient cash to meet obligations as they come due. No company has ever gone bankrupt because it had too much cash. On the other hand, cash balances beyond what is needed to operate the business safely don’t really accomplish much. Especially with today’s low interest rates, cash is a sterile asset that does not contribute to the company’s earnings. The appropriate cash balance for a business will depend on factors like seasonality and upcoming debt payments or capital expenditures.
Working Capital (Current Assets less Current Liabilities)
The designation “current” is applied to assets if they are likely to be converted to cash within the coming year and liabilities if they are likely to be paid within the coming year. The net of current assets over current liabilities is referred to as working capital. Working capital is often an underappreciated use of capital for businesses. Investments in accounts receivable and inventory are no less cash expenditures than purchases of equipment or the acquisition of a competing business.
The cash conversion cycle is central to working capital analysis. As shown in Exhibit 3, the cash conversion cycle is a measure of operating efficiency for the business. Measuring the time from cash outflows for inventory purchases to cash inflows from collection of receivables, the cash conversion cycle provides perspective on the amount of working capital required to operate the business.
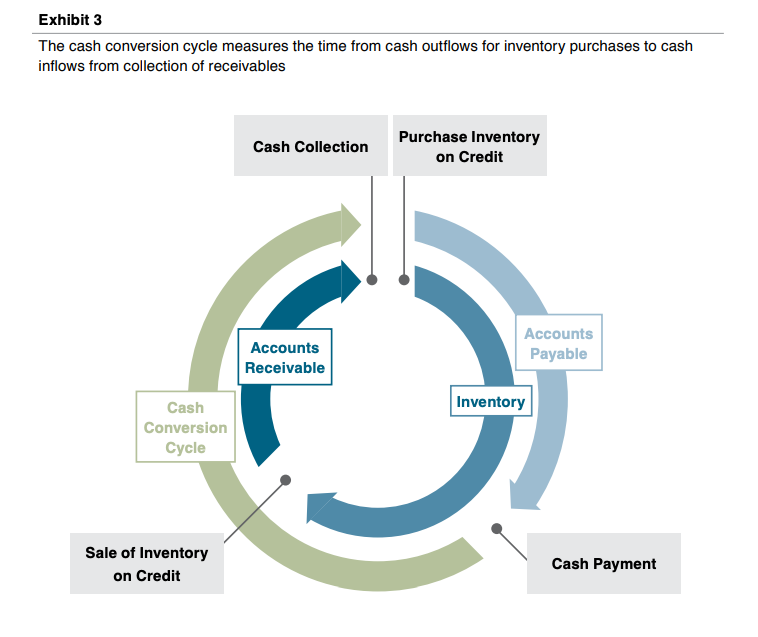
A shorter cash conversion cycle frees up capital to be reinvested in more productive assets in the business or distributed to shareholders. For some companies with limited inventory needs or predominately cash sales, the cash conversion cycle can be very short, or even negative (meaning cash is received from customers before it is paid to suppliers). As discussed further in a subsequent section, trends in working capital balances can signal whether the company is accumulating stale inventory or is at risk of future charges for bad debt.
Net Fixed Assets
The balance of net fixed assets represents the accumulated capital expenditures of the business over time less accumulated depreciation charges. In contrast to inventory purchases and operating expenses, which offer only short-term benefits to the company (inventory has to be replenished and workers need to be paid again next week), capital expenditures are expected to provide benefits to the company over a multi-year horizon. As a result, such expenditures are “capitalized” on the balance sheet and expensed bit by bit over the service life of the asset in order to match the cost of the asset to the periods during which the company benefits from owning the asset.
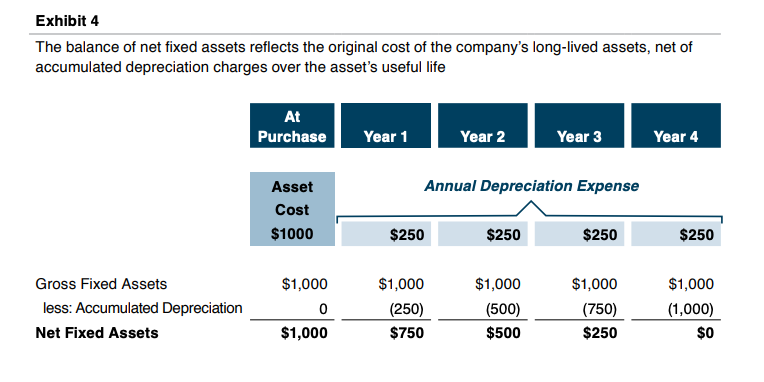
Depreciation is the annual charge that reflects the apportionment of the cost of a long-lived asset to the periods that benefit from the asset’s use. Over the life of the asset, the cumulative depreciation charges will equal the cost of the asset. In other words, the capital expenditure is charged to earnings as an expense over time. At a given point during the asset’s life, therefore, the balance sheet will show how much was paid for long-lived assets (the “gross” balance) and the accumulated depreciation charges that have already been recognized for the use of the asset, with the difference between those two figures being the balance of net fixed assets. Exhibit 4 illustrates the balance sheet presentation for long-lived assets over time.
Analysis of net fixed assets is subject to two limitations associated with historical cost accounting.
- First, current accounting rules do not allow the values to be adjusted to current market value. This can be especially problematic for real property which might be expected to appreciate. For example, land that was acquired for $500 decades ago may have a current market value that is considerably higher. However, the balance sheet will continue to report the land at its original cost (land is not depreciated for accounting).
- Second, depreciation is an accounting technique for allocating the cost of long-lived assets to different accounting periods – it is not intended to be a forecast of the future value of an asset. In Exhibit 4, the net balance of the subject asset at the end of Year 2 is $500. That is not an estimate of the asset’s market value at that date, which might be $500 only by coincidence.
As a result of these limitations, analysis of the fixed asset accounts should generally focus on relative proportions to other balance sheet components (i.e., does the company own or lease its primary facilities) and changes at the margin (are annual capital expenditures greater or less than annual depreciation charges) rather than absolute values.
Goodwill & Intangibles
Not all of the company’s valuable assets are presented on the balance sheet. The historical cost accounting model only captures assets that the company has acquired in exchange for cash. Some assets, such as tradenames, technology, customer relationships, and workforce accrue slowly over time rather than as the result of a discrete transaction. For example, the accumulated advertising expenses of the company, which build the value of the tradename over time, are expensed as incurred, and never reach the company’s balance sheet. For many companies, these intangible assets can actually be more valuable than the tangible assets that are found on the balance sheet.
The major exception occurs when one company buys another. In this case, Company A (the buyer) will record the hitherto unrecorded intangible assets of Company B (the company acquired) on Company A’s balance sheet. Since a transaction has occurred, the intangible assets of the acquired company will now be presented on the buyer’s balance sheet, as explained below, while the buyer’s internally-generated intangible assets will continue to be ignored.
The excess of the amount paid for the business over the net tangible assets of the acquired business is added to the buyer’s balance sheet as either a specific intangible asset or goodwill. Certain identifiable intangible assets such as customer relationships and tradenames are amortized (analogous to our depreciation discussion in the preceding section), while goodwill (the amount left over after all other tangible and intangible assets have been recognized) is not subject to amortization, but is periodically tested for impairment. As with fixed assets, current accounting rules do not permit assets to be written-up to market value, so the analytical value of the goodwill and intangibles is limited. The principal questions to consider when evaluating goodwill and intangibles balances include:
- Has the company historically grown organically or through acquisition? If the balance of goodwill and intangibles is modest, the company has relied on internal organic growth, whereas if the balance is large and growing, the company is fueling growth through acquisition.
- Has the company been a successful acquirer? While some identifiable intangible assets are subject to periodic amortization, a sudden decrease in the balance of goodwill corresponds to an impairment charge, implying that the acquisition giving rise to the goodwill has underperformed relative to expectations.
Interest-Bearing Debt
The operations and assets of the company are financed through either debt or equity. Evaluating the subject company’s capital structure is an important element of balance sheet analysis. Using debt increases the potential return – and risk – to the company’s shareholders. In order to assess whether the subject company is conservative or aggressive in its use of debt, it is helpful to compare the debt balance to other measures of financial performance and condition.
- Relative to shareholders’ equity. One obvious point of comparison is to equity, the other potential funding source. Comparing debt to the reported shareholders’ equity on the balance sheet is a simple and quick measure of the company’s reliance on debt compared to equity. When doing so, however, remember that the balance sheet reports historical cost figures, not current market values. While the current market value of debt is unlikely to stray too far from the balance sheet figure, the current market value of equity will often bear no relationship to the balance sheet.
- Relative to market capitalization. When calculating the weighted average cost of capital, the appropriate weightings on debt and equity should reflect market value, not balance sheet amounts. For public companies, market value of equity is known, but for private companies, it must be estimated. In neither case can the number be read off the balance sheet.
- Relative to earnings. A common measure of debt capacity is to relate the balance of debt to EBITDA (we will define and discuss EBITDA in a subsequent section of this series). Lenders commonly reference this measure in assessing a borrower’s ability to service a given debt load.
Assessing the company’s debt burden is a key element of reading a set of financial statements. Ultimately, there is no single “correct” amount of debt for a company. The right amount of debt is a function of multiple factors, not least of which is the risk tolerance of the company’s shareholders.
Shareholders’ Equity
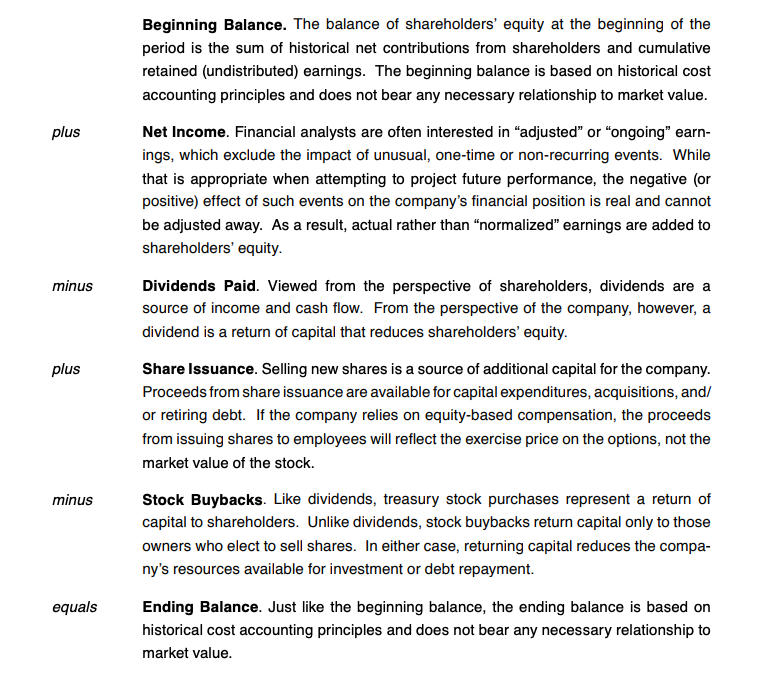
For most operating businesses, reported shareholders’ equity bears little or no relationship to market value. As a result, analysis should focus on the period-to-period change in the equity balance rather than the absolute dollar amounts. In fact, most financial statements include an explicit reconciliation to help the reader evaluate changes in equity during the period.
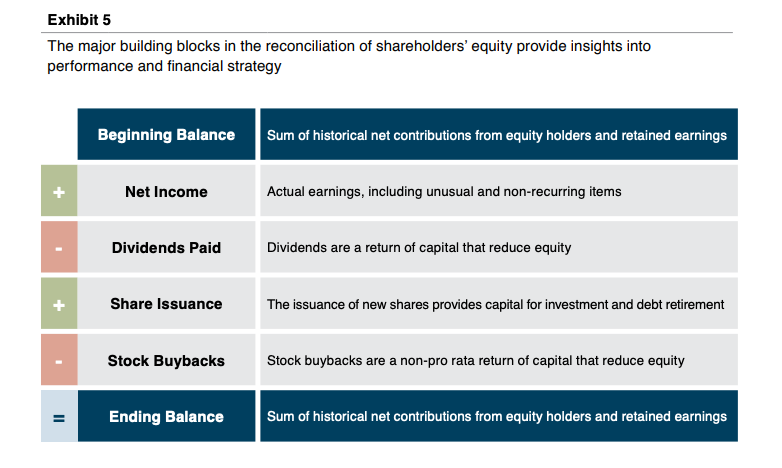
As summarized in Exhibit 5, the major components of the reconciliation of shareholders’ equity include the following items:
Conclusion
The balance sheet provides a point-in-time summary of what the company owns and what the company owes. Experienced financial statement readers can learn a lot from the balance sheet, but the primary limitations are that not every asset is represented on the balance sheet (i.e., homegrown intangibles) and the historical cost of some long-lived assets (i.e., land) may be very different from current market value.