Family Business in 2020: Musings on Market Signals


Amid the pre-election pandemonium, a couple items crossing our desk over the past weeks have made us think a bit about how investment returns for family businesses compare to other enterprises.
- The first is a story appearing in The Globe and Mail that was passed along by a former colleague. A recent study by the National Bank of Canada compared the returns on publicly traded companies that are family-controlled relative to the broader TSX index from June 2005 to June 2020. They found that the family-controlled firms generated a 7.1% annual return, compared to 6.0% for the TSX index. Over such a long period, this represents a significant difference. In addition to the usual factors trotted out to accompany this sort of statistic (long-term focus, culture, agility, etc.), the study authors note that the family-controlled companies are more than twice as likely than the overall index to have a female CEO. This is an element of the family vs. non-family comparisons that we have not previously seen. Perhaps this undermines one of the occasional knocks against family businesses, which is that they can be stodgy, or insular, relative to their non-family peers. It seems that maybe, at least in terms of gender equity, the opposite may actually be the case.
- The second is the persisting underperformance of small public companies relative to the large caps. As shown below, the year-to-date return on the S&P 500 has exceeded that of the small cap S&P 600 index by 18.4% (+8.7% for the S&P 500, compared to -9.7% for the S&P 600).
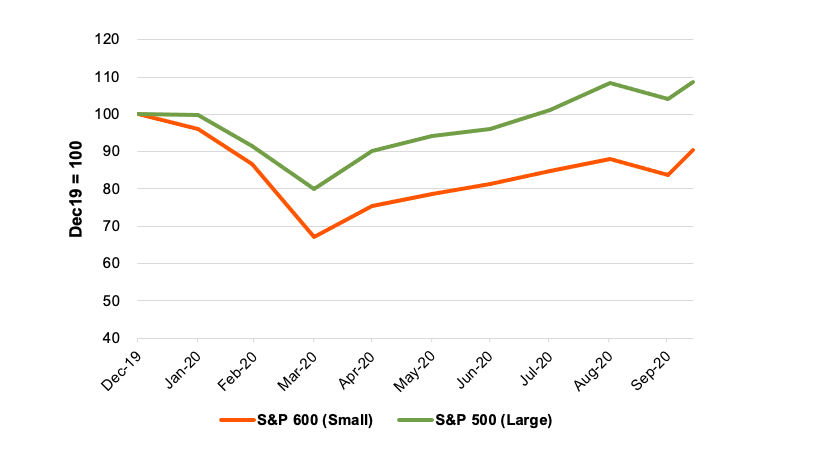
The popular financial press has seized on the outsized influence of the FAANG stocks on the overall index, and it is certainly true that, by virtue of their mammoth market capitalizations, these companies have driven a good bit of the outperformance of the S&P 500 during 2020. Our back of the envelope calculation suggests that the FAANG stocks have, by themselves, added about 6.0% to the total return on the index this year. That still leaves a lot of outperformance to account for. In the following table, we summarize returns for the S&P 500 (excluding the FAANG stocks) and the S&P 600 by industry sector. For purposes of this analysis, we have calculated weighted average returns based on December 31, 2019 market capitalizations, which will understate index performance, but the overall gist of the story is the same.
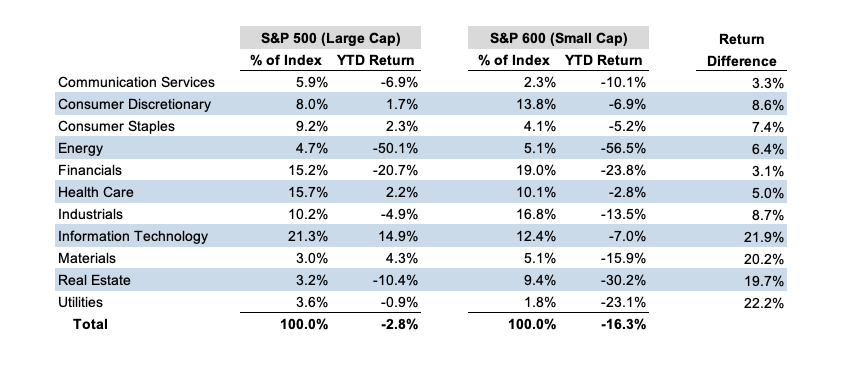
What is striking about this table is that, even excluding the FAANG stocks, the outperformance of large cap companies extends to each industry sector. In other words, the outperformance of the S&P 500 cannot be attributed solely to differing sector weights. The impact of sector mix likely accounts for about 300 basis points of the underperformance of the S&P 600.
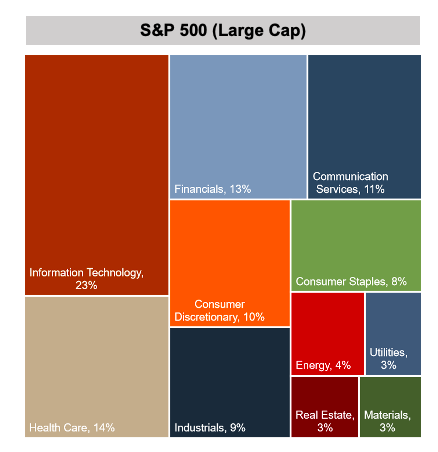
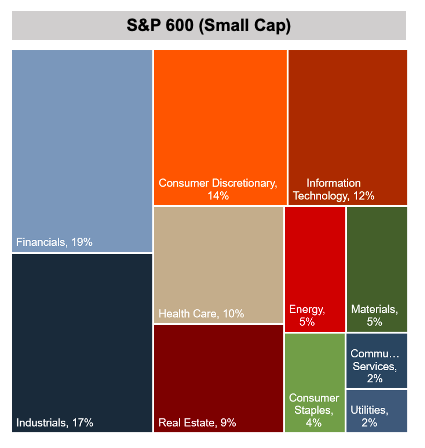
As shown in the preceding charts, the small cap stocks are overweighted in financials and industrials relative to the large cap universe, and underweight on information technology. However, the underperformance of small caps during 2020 has much more to do with the fact that small caps delivered inferior investor returns across all industry sectors than the industry composition of the indices.
Since we can’t lay all of the underperformance at the feet of the FAANG phenomenon or index composition, we next looked at the pandemic impact on earnings. The following chart compares current (October 31) estimates for full year 2020 EPS to the 2020 EPS estimates at the beginning of the year. While COVID has blown a hole in 2020 earnings, that hole is considerably larger for the S&P 600 than the S&P 500.
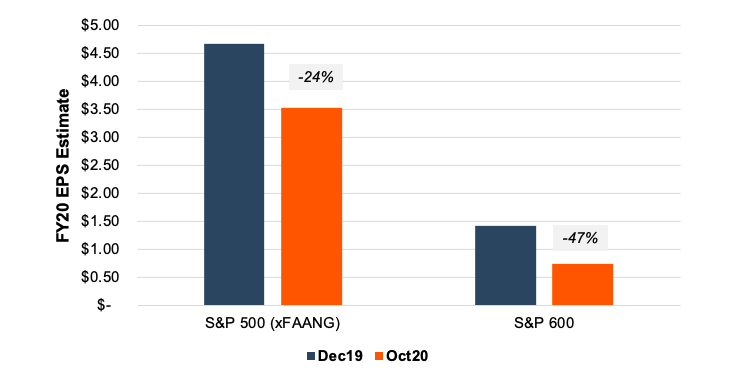
Analysts expect earnings to recover in 2021, and the net decrease from 2019 to 2021 is 12% for the large cap stocks compared to 25% for the small caps. So it turns out that the relative market performance of small cap stocks has been rooted in differences in cash flow, growth and risk, after all.
Conclusion
What conclusions can we draw for family business from all of this? How are family businesses faring compared to the small cap public companies? Of course, we don’t have a full data set, but anecdotally, we have been surprised at how well our clients have held up. Apart from hospitality, lodging, and commercial real estate, our family business clients have been remarkably resilient. Time will tell, but we suspect that many family businesses will have proven more adept at handling the pandemic than their non-family counterparts.
Maybe that National Bank of Canada study is on to something.