Suppose that your exposure to the French language consists of two years of high school classes twenty-five years ago. Imagine how frustrating it would be if suddenly the only news outlet available to you was Le Monde. With no small effort on your part, there’s a good chance you would be able to discern the broad outlines of the day’s events, but the odds of misunderstanding a key part of the story would be high, and any subtleties or nuance in the writing would be totally lost on you.
Communication promotes shareholder engagement, but what does it look like to communicate financial results effectively?
That is likely how many of your family shareholders feel when it comes to comprehending the financial results of your family business. Perhaps they took an accounting course at some point in their lives. Or simply by virtue of having grown up around the family business, they have developed a vague sense of the differences between revenue and equity, or assets and expenses. As a result, when they read a financial report, they are generally able to discern the broad outlines of performance for the year or quarter, but the odds of misunderstanding a key part of the story are high, and any subtleties or nuance beyond the most rudimentary data are likely to pass them by.
Everyone agrees that communication promotes positive shareholder engagement, but what does it look like to communicate financial results effectively? In this series of posts, we offer practical suggestions for presenting key financial data in ways that family shareholders find useful. We start in this post with the balance sheet.
The Balance Sheet
The balance sheet is a snapshot of what the family business owns, and what it owes, at a single point in time. The most important balance sheet concepts to communicate to family shareholders are scale, composition, and efficiency.
Scale
Is $1 million a lot of money? The answer to that question depends, of course, on your perspective. For a family-owned restaurant, it may be everything; but for Ford Motor Company, it is a rounding error. To have any meaning, balance sheet totals need context. As a raw data point, the fact that your business has net fixed assets of $205 million is meaningless to your family shareholders. To really communicate scale, you need a reference point, whether a prior date in your family business’s history, a contemporary peer, or some other benchmark. Exhibit 1 is an example of contextualizing balance sheet scale.
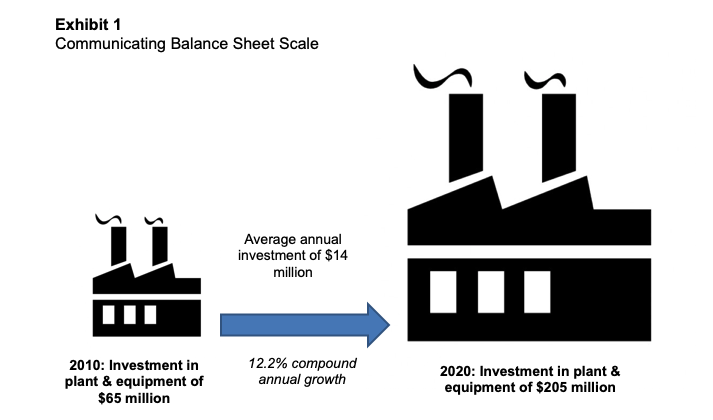 Exhibit 1 helps communicate scale more effectively in several ways.
- The icons help reinforce that financial statement balances aren’t just numbers, but correspond to actual stuff in the real world. The family business doesn’t exist to generate financial reports, but to produce real goods or provide real services.
- Comparing the balance today with that from a decade ago helps to give a sense for what $205 million really means. The meaning of a $205 million fixed asset balance today would be completely different if the balance in 2010 had been $300 million instead of $65 million.
- The average annual investment figure helps family shareholders to appreciate the cumulative nature of capital investment, and the fact that the need for capital spending is ongoing even though actual expenditures may occur only sporadically.
- The growth rate provides a benchmark for evaluating other parts of the company’s story, such as revenue growth or the growth rate in other asset categories.
Composition
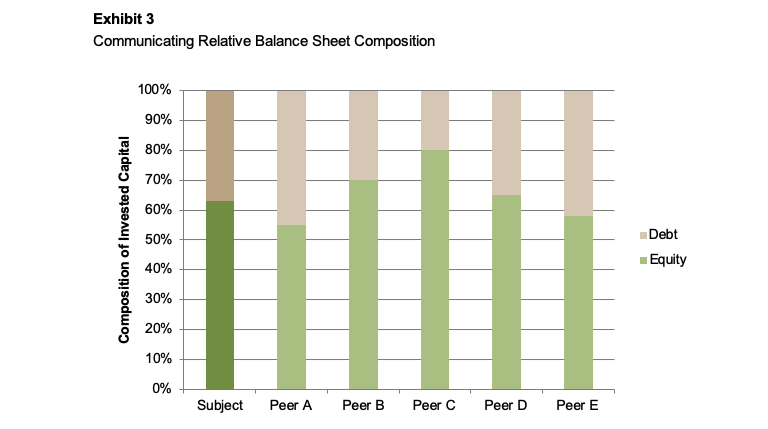
It is also important for family shareholders to understand the relative proportions of the balance sheet. With regard to the left side of the balance sheet, how are the total assets of the business allocated among the primary asset categories? The most important takeaway from the right side of the balance sheet, which consists of liabilities and equity, is the relative mix of funding sources used to finance the business.
It is hard to beat a pie chart or area model for demonstrating the composition of a whole. Exhibit 2 illustrates one way to use area models to communicate the composition of the balance sheet.
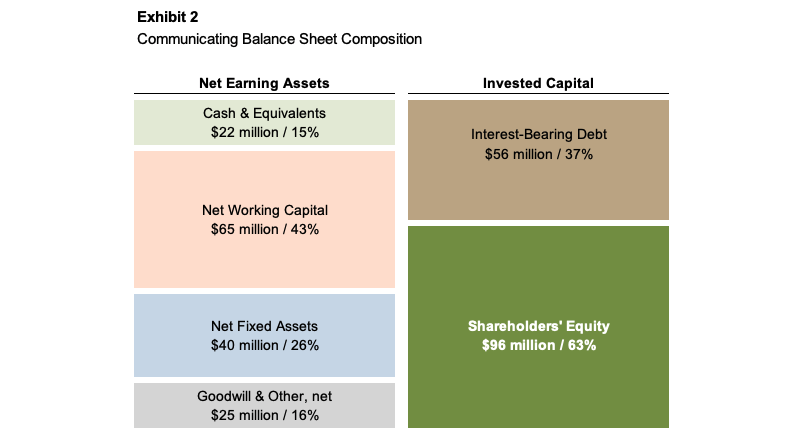
The balance sheet presentation in Exhibit 2 is effective for a several reasons.
- First, we have grouped individual line items together in order to reduce the “clutter” found on too many balance sheets. Detail that is appropriate for managers or even directors to consider just distracts from the overall message when the goal is communicating with shareholders.
- Second, we rearranged things a bit, netting non-debt liabilities against the left side of the balance sheet. This isolates the total invested capital entrusted to management, and helps prepare shareholders for an emphasis on return on invested capital as a primary performance measure.
- Finally, presenting the various balance sheet categories at scale conveys the relative composition of the balance sheet more intuitively than a series of numbers does.
Efficiency
The final balance sheet concept to communicate to family shareholders is efficiency. Managers and directors are stewards of family capital, and balance sheet efficiency measures demonstrate how effective their stewardship has been.
Tracing the elements of the operating cycle conveys how the business operates in a fresh perspective.
Efficiency measures include turnover and return statistics. Turnover measures compare a balance sheet item to a corresponding activity measure such as units sold, revenue, or cost of sales. Return statistics have a measure of income as the numerator and a balance sheet measure such as assets, invested capital, or equity as the denominator.
The cash conversion cycle measures the working capital efficiency of a business. In other words, how much family capital is tied up in inventory and receivables? Since the return on working capital is often relatively low, managers generally try to reduce their balance sheet allocation to working capital. Exhibit 4 provides an example of how to communicate the cash conversion cycle to family shareholders.
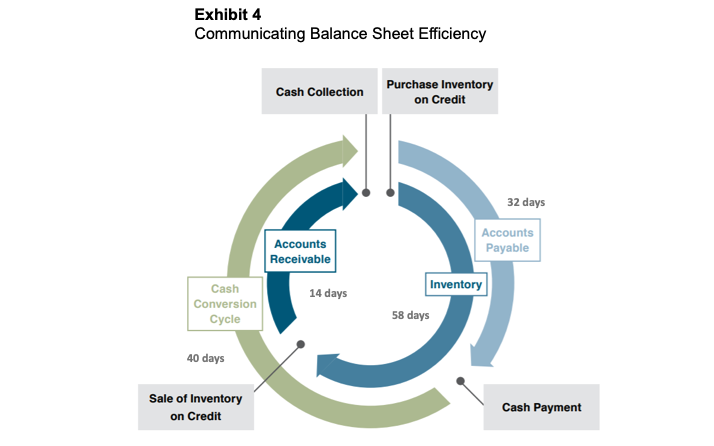
Exhibit 4 summarizes each component of the calculation, while also providing an intuitive basis for the calculation. By tracing the elements of the family business’s operating cycle, it conveys how the business operates to family shareholders in a fresh perspective.
Conclusion
Effective communication unlocks the power of positive shareholder engagement. When it comes to the financial performance of your family business, effective communication is more than simply providing audited financial statements when requested by family shareholders. Doing so is like handing them a newspaper written in their second (or third) language. They may get something out of it, but it will largely be a matter of chance.
In this post, we have provided examples of how to communicate the key balance sheet concepts of scale, composition, and efficiency to your family shareholders. The exhibits in the post are simply illustrations; the challenge is identifying the best way to communicate these balance sheet concepts to the shareholders of your family business. In future posts, we will illustrate techniques for communicating the key financial concepts from the income statement and the statement of cash flows.


