How to Communicate Financial Results to Family Shareholders (Part 2)


Family Business Director recently started watching Christopher Nolan’s 2010 movie Inception. While we are not really competent to comment on the artistic merits of the film, we were more than a bit confused by some of the dream-within-dream-within-dream sequences and the generally non-sequential plotline. We took some comfort from the fact that at least one website devoted to this sort of thing ranked Inception as one of the most confusing movies ever made.
If the balance sheet is a still photo, the income statement is a movie.
If the balance sheet is a still photo, the income statement is a movie. While the balance sheet records the assets and liabilities of your family business at a particular point in time, the income statement is a record of the revenue earned and expenses incurred by your family business over time.
Everyone agrees that communication promotes positive shareholder engagement, but what does it look like to communicate financial results effectively? In this series of posts, we offer practical suggestions for presenting key financial data in ways that family shareholders find useful. In the last post, we focused on the balance sheet; this week, we turn our attention to the income statement.
The Income Statement
When communicating results from the income statement, you don’t want your family shareholders to feel the way we did while watching Inception. If the income statement is the movie that tells the story of your family business, the goal should be to make the plotline as transparent and easy to follow as possible. The primary threads of the plotline for your family business as revealed in the income statement are growth, margin, and return on investment.
Growth
Growth is essential to family business success. As pointed out recently by David Wells, the “average” family needs to earn anywhere from 8% to 10% annually to maintain real, after-tax, per capita family wealth over time. Since growth is so important, family business managers should emphasize the trend in revenue over time when communicating results to family shareholders.
However, revenue growth alone does not tell the full story for most family businesses. After all, the business earns revenue by producing a good or providing a service, and revenue is the product of the volume of goods produced or services rendered and the effective price received per unit of activity. For some businesses, a volume metric is obvious (i.e., cases sold); for others, a bit more creativity may be required. Regardless of the specific volume measure, however, the underlying story is the same: revenue growth is a function of changes in the quantity of goods or services sold, and changes in the effective price received for such goods or services.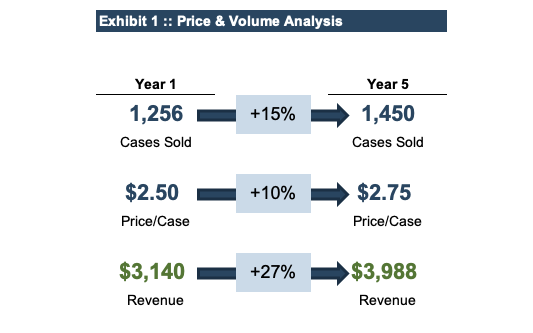
Exhibit 1 illustrates how breaking revenue into activity and pricing measures can add texture to revenue growth discussions. Exhibit 1 highlights for family shareholders that the growth attributable to selling more cases of product has been augmented by price increases to drive even faster revenue growth. The same type of presentation can then be used to discuss plans for the future. Telling shareholders that you expect revenue growth is pretty abstract; telling them that you anticipate selling 7% more cases at a 3% higher price is much more concrete and understandable.
Margin
Revenue is the source of everything good in business. But your family shareholders benefit only to the degree that revenue outruns expenses. Profit margin measures the efficiency with which you convert revenue into profits. In other words, how many dollars of profit does your family business wring out of $100 of revenue?
As with revenue, the challenge for communicating margins to family shareholders is to move from the abstract (our EBITDA margin was 20% last year) to the concrete (we spend these proportions of our revenue on these expenses).
Exhibit 2 illustrates one way to depict the family business’s profit margin in a more concrete and understandable manner.
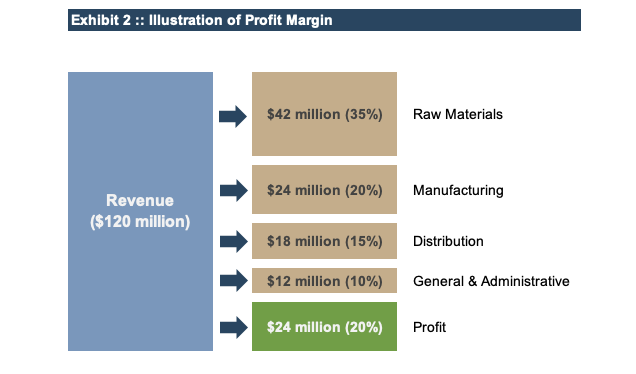
One virtue of the presentation in Exhibit 2 is that it aligns the concept of profit margin with the functional areas of the business. In other words, it clarifies how much of the company’s revenue goes to funding the various necessary functions of the business. This helps to remove much of the mystery about how the family business actually makes money. It also helps link profitability to business strategy by providing perspective on potential investments. For example, if we spend 2% more to acquire higher quality raw materials, we will be able to save 4% on manufacturing costs.
The presentation in Exhibit 2 relates to a single period. By establishing that base, then you can easily benchmark those results against available peer data or the family business’s own performance over time. Tracing where the company’s revenue goes is a great way for your family shareholders to better understand your current profit margin, along with the opportunities and challenges facing the business.
Return on Investment
Investors are much more interested in how to earn more per dollar invested.
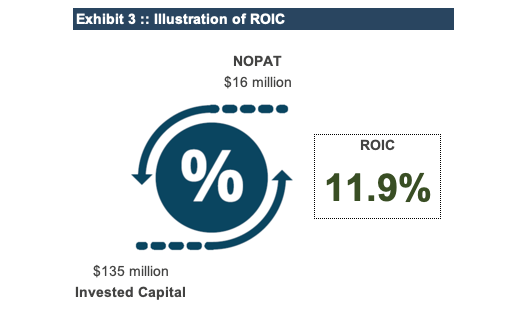
One surefire way to double the interest you earn on your savings account is to double the amount on deposit. While that strategy works, it’s not really what investors want to hear. Investors are much more interested in how to earn more per dollar invested. Yet, when companies report results to their shareholders, they often focus exclusively on the amount of income (profits increased 30%!) while ignoring the question of how much was invested. Return on invested capital (ROIC) is our preferred measure of financial performance for family businesses because it takes into account both earnings and the capital invested to generate those earnings.
In its simplest form, ROIC is the ratio of NOPAT (net operating profit after tax) to invested capital (the sum of equity and debt capital invested in the business). So if the 30% increase in profits referenced above was achieved only after increasing the capital invested in the business by 40%, that’s really not such a good thing. Exhibit 3 helps to emphasize that ROIC depends on both the income generated by the business and the amount of capital invested.
ROIC is an especially effective tool for capital allocation decisions within multi-segment family businesses. As shown in Exhibit 4, family shareholders can benefit from a clear presentation of how much capital is allocated to each segment of the family business, how returns compare among business segments, and how returns compare to a specified hurdle rate.
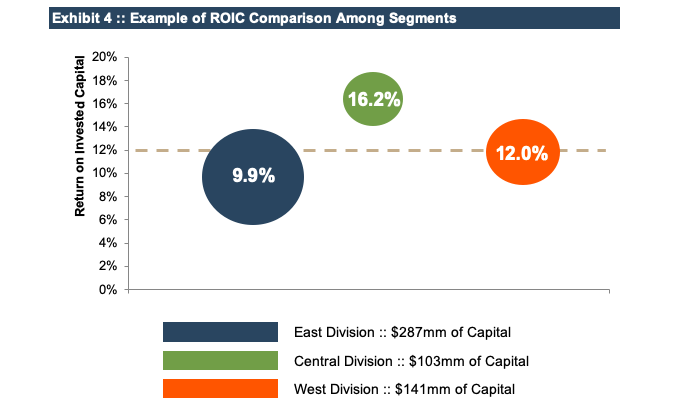
Exhibit 4 helps family shareholders see both the relative capital allocation to each segment and how the returns for those segments relate to the target return of 12%. This sort of presentation can help prepare family shareholders for important discussions about investment priorities going forward.
Conclusion
The income statement is the story of your family business, and it is important to tell that story well for the benefit of your family shareholders. Telling the story of the family business is probably not the best time to channel your inner auteur, however. Instead, stick to the basics and focus on an easily-grasped narrative arc that emphasizes growth, margin, and return on investment. Your family shareholders will thank you.