Making Sense of 2020: Part I
Benchmarking Cash Flow From Operations


Here at Family Business Director, we believe in the power of benchmarking for family businesses. Done well, benchmarking provides managers and directors with valuable insight and context for evaluating the operating performance of the family business and the strategic investing and financing decisions made by the directors. We published benchmarking guides in 2019: The 2019 Benchmarking Guide for Family Business Directors, and 2020: The 2020 Benchmarking Guide for Family Business Directors.
We are organizing the 2021 edition of our benchmarking guide using the statement of cash flows as our guide.
- This week, we review the components of cash flow from operations.
- Next week, we will consider investing activity, turning to financing decisions the following week.
- In our final installment, we will look at market performance and shareholder returns.
It is no secret that COVID-19 was the story of 2020. To assess more clearly the effect of the pandemic of the firms in our universe, we analyze results on a quarterly basis. We’ve drawn our data this year from the SEC filings of revenue-generating companies in the Russell 3000 index (excluding financial institutions, real estate companies, and utilities).
Operating Performance
Everything good in business starts with revenue. In Chart 1, we summarize aggregate revenue trends during 2019 and 2020.
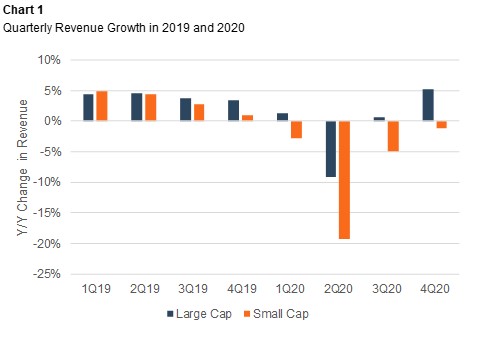
Chart 1 demonstrates that – in the aggregate – smaller companies felt more pain from the pandemic than their larger counterparts. For the large cap companies, revenue fell less than 10% during the second quarter before resuming year-over-year growth in the back half of the year. In contrast, revenue growth for the small caps turned negative in the first quarter, bottoming out with a nearly 20% reduction in the second quarter, with lower revenues persisting into the third and fourth quarters.
Financial analysts refer to the relationship between the change in revenue and change in operating expenses as operating leverage. Simply put, if some portion of a company’s operating costs do not vary directly with revenue (i.e., are fixed), revenue growth is likely to trigger expanding margins, while decreasing revenue reduces the operating profit margin.
Chart 2 compares the relationship between change in revenue and change in operating expenses for the small cap companies in our data set for 2019 and 2020.
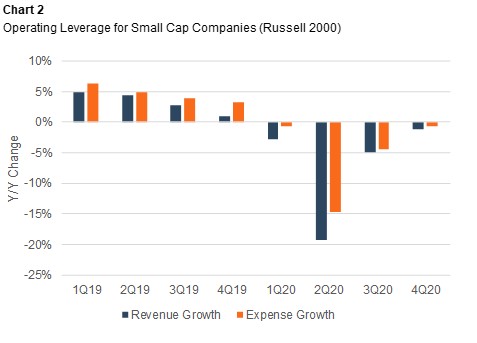
Throughout 2019, expense growth outpaced revenue growth, causing operating margins to compress on a year-over-year basis. This trend was exacerbated in the first half of 2020 before moderating in the second half of the year. Chart 3 illustrates the impact of operating leverage on the operating margins of the large and small cap companies.
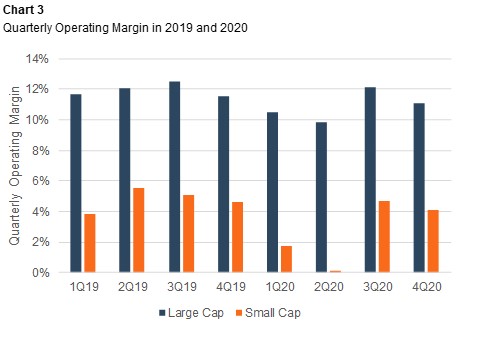
Since the revenue shortfall in 2020 was greater for the small cap companies than the large caps, the negative effect of operating leverage was more pronounced for the small cap firms in 2Q20, with the aggregate operating margin for the group decreasing by 542 basis points from 2Q19, compared to a 218 basis point reduction for the large cap companies.
Working Capital to the Rescue
In contrast to operating income, net income is burdened by interest costs, income taxes, impairment charges, and other unusual items. As shown in Chart 4, the small cap companies reported an aggregate net loss in the first two quarters of 2020. After breaking even in the third quarter, the group crept back into the black in the fourth quarter.
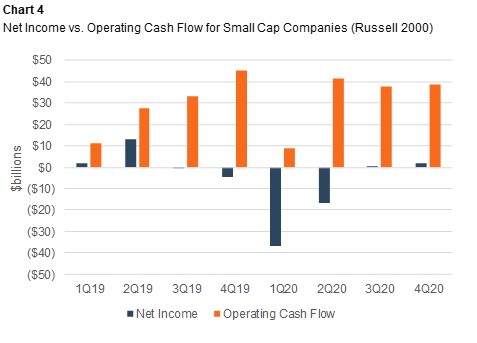
However, as shown in Chart 4, the earnings weakness in 2020 did not prevent these companies from generating more operating cash flow than in 2019 ($127 billion compared to $117 billion). How was that possible?
Table 5 summarizes the composition of operating cash flow for 2018 and 2019.
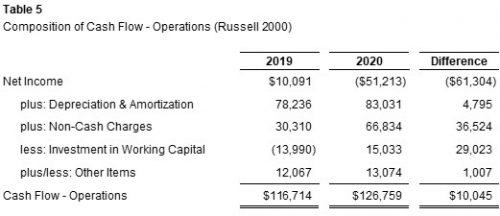
Net income was $61 billion lower in 2020 than 2019 for the small cap companies in our data set. However, $36 billion (60% of that difference) was attributable to non-cash charges to earnings (i.e., impairment charges). The balance of the difference is primarily attributable to working capital. One silver lining to the cloud of shrinking revenue is the release of working capital.
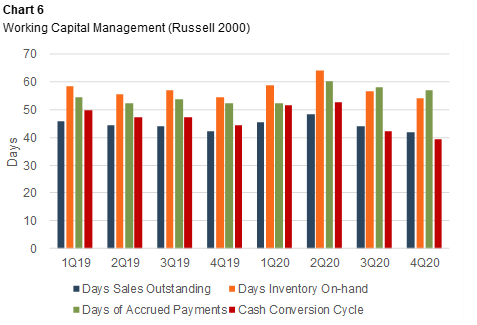
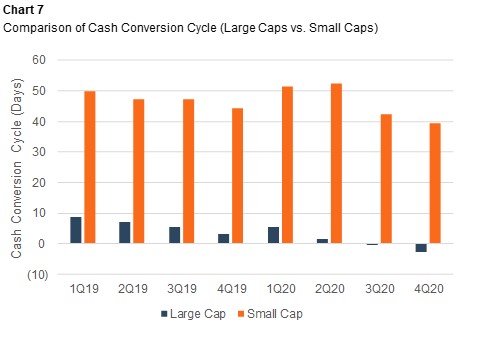
As shown in Chart 6, cash provided by liquidating working capital was augmented by more diligent cash management practices, as the cash conversion cycle for small cap companies fell from 52 days at the end of 1Q20 to 39 days at the end of 4Q20.
Of note, the large cap companies in our data set generally manage working capital more aggressively than their small cap counterparts, as shown in Chart 7.
Questions for Family Business Directors
The benchmarking data raises some critical questions for family business directors as the U.S. economy continues on the path to recovery.
It’s clear that larger firms fared better than smaller firms. What is less clear is why. Assuming your family business is not the size of a large cap public company, what steps did you take to preserve existing revenue sources and find new revenue sources in the pandemic? If you found new revenue sources (for example, e-commerce), what steps are appropriate now to preserve those revenues as the pandemic recedes?
Operating Leverage: We suspect that operating leverage ultimately has more to do with flexibility, creativity, and ingenuity than the traditional dichotomy of “fixed” versus “variable” costs. What did the pandemic teach you about your family business’s ability to adapt and manage operating expenses in the event of a negative shock to earnings? Looking forward, are there any “austerity measures” that should probably become the new normal for your family business?
Working Capital: If your family business did generate less revenue in 2020, was it able to liquidate working capital accordingly? Do you adopt any working capital management techniques during the pandemic that should continue? If you are expecting revenue to recover in 2021, have you identified and secured the necessary financing sources to support the accompanying increase in working capital needs? What appeared to be a large cash balance at the end of 2020 can be depleted quickly if strong revenue growth triggers larger working capital balances.
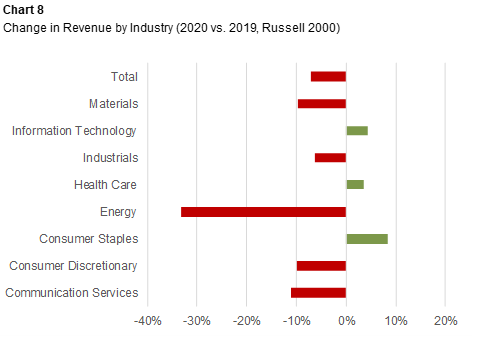
The pandemic did not affect all industries equally. As shown in Chart 8, revenue for some industry sectors actually increased during the year.
Conclusion
The observations in this article relate to the data set as a whole. For more targeted insights and observations, give one of our professionals a call to talk about a more customized benchmarking analysis for your family business.