The best performance metrics address not just “what” performance has been in the past, but reveal the “why” behind that performance and give direction for “how” to improve performance in the future. In last week’s post, we introduced return on invested capital (ROIC) as a comprehensive performance measure for family businesses. In this week’s post, we will dig a little deeper with ROIC, demonstrating how we can use ROIC to answer the “what,” “why,” and “how” questions for your family business.
What Has Historical Performance Been?
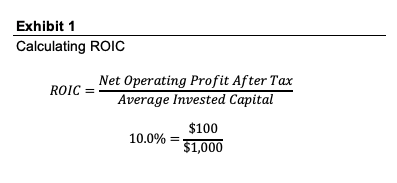
Return on invested capital correlates income statement performance (in the form of net operating profit, or NOPAT) with the balance sheet resources used to generate that performance (in the form of invested capital). The basic calculation of ROIC describes how much NOPAT the business generates per dollar of invested capital:
 ROIC measures the efficiency with which management is using family resources to generate income for the family. Because it is expressed in the form of a return, ROIC facilitates comparison to the performance of alternative investments that may be available to the family. Because ROIC is scaled to the size of the company, it also facilitates comparisons with available peer benchmarks.
Why Has Historical Performance Been What it Has Been?
Return on invested capital is valuable enough as a free-standing metric. But if we take a quick peek under the hood, we can learn a lot more about why ROIC is what it is. As shown on Exhibit 2, by inserting revenue into our calculation of ROIC, we end up with two distinct components that each have a story to contribute to the overall ROIC narrative.
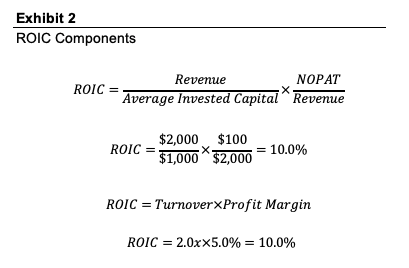 When we look at it this way, we can see that ROIC is the product of turnover and profit margin.
- Turnover measures how much revenue each dollar of invested capital generates. In other words, how well have management and the directors allocated family resources to a portfolio of business assets that produce revenue? All else equal, the more revenue generated per dollar of invested capital, the higher return on invested capital will be.
- Profit margin reveals how efficiently the family business converts revenue to profit. Revenue is essential, but only profits fuel family returns. All else equal, higher profit margins result in a higher return on invested capital.
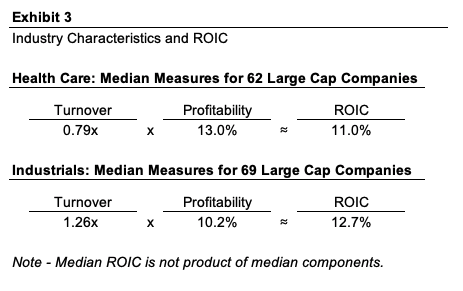 Relative to industrial companies, health care providers are very asset-intensive (real estate and expensive medical diagnostic equipment). However, health care providers tend to wring more profitability out of each dollar of revenue (medical care tends to be expensive). As a result, the median ROICs for the two sectors are broadly comparable despite the sectors’ having very different individual return components.
Breaking down the overall return into its component parts is helpful for discerning the “why” of performance within a particular industry.
Breaking down the overall return into its component parts is helpful for discerning the “why” of performance within a particular industry as well. Our example company, Blue Corp., earned a 10.0% return on invested capital on the basis of its turnover (2.0x) and profitability (5.0%). Assume that Blue Corp.’s primary competitor, Red, Inc., also generated a 10.0% ROIC. However, Red, Inc.’s higher turnover (2.5x) was offset by a lower profit margin (4.0%).
Relative to Red, Inc., Blue Corp. has a less efficient mix of assets, but more profitable operations. With this knowledge in hand, the directors of Blue Corp. can begin to formulate some probing questions for their next meeting:
- Do the performance differences revealed by ROIC correspond to our stated corporate strategy? In other words, given how our family business has elected to position itself in the market, do the components of ROIC make sense?
- Given our corporate strategy, is a 100 basis point premium in profit margin to Red, Inc. sufficient? Does the market perceive our family business to be a premium provider? If so, are we pricing our services appropriately, or are we leaving money on the table?
- Or, does our corporate strategy really necessitate that we have lower turnover than Red, Inc.? How does our strategy influence the manner in which we allocate family resources to productive assets?
How Can We Improve Performance in the Future?
Assessing why our past performance looked the way it did naturally leads us to the final and most pressing question: how can we improve our return on invested capital in the future? What operating changes or strategic adjustments will be required of our family business today if our goal is to enhance ROI tomorrow?
The component analysis we introduced in the prior section is instructive here as well. ROIC cannot improve unless one or both of the components of ROIC improve. Exhibit 4 illustrates how we can “map” current performance and the available options for increasing ROIC.
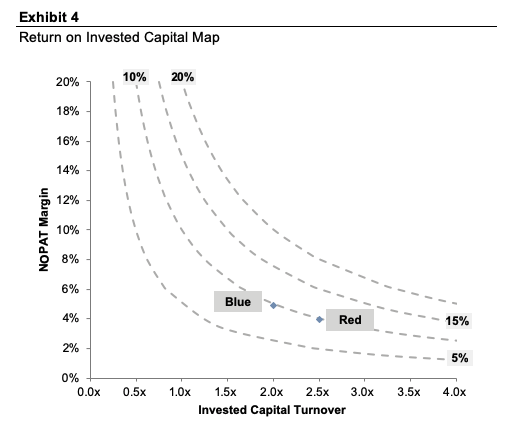 The dotted lines on Exhibit 4 represent different combinations of turnover and profitability that result in the same ROIC. So, for example, both Blue Corp. (2.0x turnover and 5.0% margin) and Red, Inc. (2.5x turnover and 4.0% margin) generate the same ROIC. Suppose that Blue Corp.’s goal is to improve ROIC to 15%. If turnover remains unchanged, NOPAT margin will need to increase to 7.5%. On the other hand, if profitability remains constant, turnover will need to increase to 3.0x. Of course, there are limitless possibilities in between and on either side of the current parameters. To take an extreme example, if Blue Corp. has a strategy to double profit margins to 10.0%, it can withstand a decrease to turnover to 1.5x and still meet the 15.0% ROIC goal.
What operating changes or strategic adjustments will be required to enhance ROI tomorrow?
Once the current set of components for your family business have been plotted on the map, along with available peer benchmarks, managers and directors can begin to evaluate what operational or strategic levers represent the best path to increasing ROIC (i.e., moving away from the origin in Exhibit 4). The challenge is to drill down from a broad goal, such as “Improve ROIC to 15.0%”, to concrete objectives that will drive improvements in either turnover or profitability. Here are some examples of concrete objectives that a family business may identify to boost ROIC:
- Reduce cash holdings to 2% of annual revenue
- Increase inventory turns from 5x per year to 6x per year
- Improve gross margin from 42% to 44%
- Reduce manufacturing overhead by 1%
Conclusion
Return on invested capital is a powerful tool for not just evaluating how your family business has performed in the past, but also for charting a course for future improvement. Once your family shareholders and fellow directors get a feel for it, ROIC is likely to become a go-to tool for developing, refining and evaluating corporate strategy.


