The magnitude of the equity risk premium, or required return in excess of the risk-free rate, is a perennial question for valuation specialists. The aggregate equity premium is typically broken into two pieces: (1) a market risk premium, and (2) a size premium.
The traditional method for measuring return premiums is backward-looking. Analysts typically compare realized returns for various asset classes over long historical periods, inferring the premiums from the differences in the return series. With regard to the size premium in particular, this approach has a number of shortcomings.
- The signal from realized returns is directionally opposite to changes in the relevant premiums. Value is inversely related to the magnitude of the risk premium; in other words, if the risk premium increases, value decreases, all else equal. Under the realized returns approach, the calculated premium is positively related to the change in value during the period. Perhaps over sufficiently long measurement periods (i.e., decades) realized returns provide a suitable proxy for the risk premium. Over the short term (and at the margin), however, they do not.
Consider a simple example:
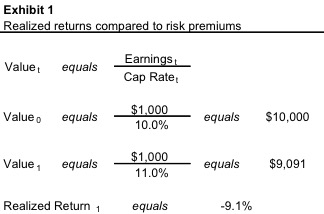
During period 1, the risk premium increased, yet the marginal impact of period 1 is to reduce the risk premium when calculated on the basis of realized returns.
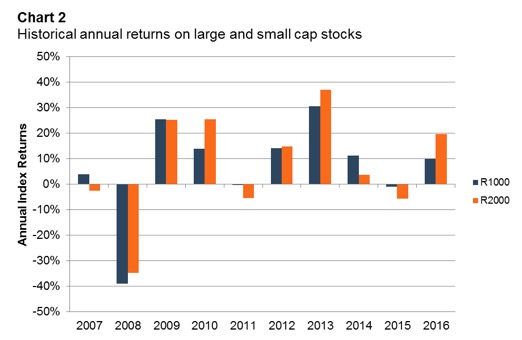
- Realized returns from smaller stocks are not consistently greater than those from larger stocks. Although business appraisers tend to apply size premiums consistently without regard to current market dynamics, there are periods when large-cap stocks deliver higher returns than small-cap names.
The following chart summarizes annual returns on large-cap (Russell 1000) and small-cap (Russell 2000) indices over the past decade. While the aggregate return on the small-cap index exceeded that on the large-cap index by 0.7% over the period, the annual performance was mixed with the Russell 2000 posting a higher return in only five out of ten years.
- Risk premiums are measured on an equity basis. For private operating companies, enterprise value (equity plus debt less cash) is the relevant perspective on value for market participants. Since the existing capital structure is replaced in its entirety in nearly all private company transactions, buyers and sellers think about enterprise value, not the value of equity in the seller’s capital structure. The relevant discount rate for measuring enterprise value is the weighted average cost of capital, not the equity discount rate. As a result, business appraisers would probably do well to consider the impact of size on the overall WACC rather than on a single component of the capital structure. Given the iterative relationship between capital structure and the cost of the individual components, such an emphasis would also lend some stability to the analysis.
- Realized returns can be reliably measured only for public companies. As a result, size premiums have historically been calculated by comparing realized returns on small public company stocks to those on large company stocks. However, the middle market and lower middle market companies that business appraisers value are often smaller than small cap public companies. Further, the smallest public companies (the “10b” companies) are often distressed, ignored by institutional investors, or otherwise subject to specific risk factors that render them unsuitable as a basis for measurement. As a result, measuring the size premium applicable to lower middle market companies has proven vexing.
In this post, we summarize an “ex ante” analysis of the size premium applicable in measuring the WACCs for lower middle market companies. Over the past decade, researchers have begun to advocate various forward-looking equity risk premium models in an attempt to alleviate some of the weaknesses associated with the realized returns approach, particularly the impact of a secular increase in valuation multiples over the past six decades.
- One such method, focused on small businesses, referred to as the Implied Private Company Pricing Line, is described here.
- Professor Aswath Damodaran has advocated a similar approach for estimating the equity risk premium for public companies.
Our procedure is straightforward. First, we analyze relevant data on small- and mid-cap public companies, calculating implied WACCs based on current valuation multiples. Second, we infer WACCs on lower middle market private companies using aggregate transaction data from GF Data. The resulting differences provide a measure of the size premium applicable to lower middle market companies (at the level of the WACC).
Implied WACC for Public Companies
To derive the implied WACCs for public companies, we analyze data from Capital IQ for the companies in the S&P 1000 (the combination of the S&P 400 mid-cap index and the S&P 600 small-cap index) as of January 26, 2017. Eliminating financial companies (for which enterprise value is not a relevant basis of measurement) and companies with negative EBITDA (indicating a measure of financial distress), we are left with a sample of 755 companies, with enterprise values ranging from $147 million to $18.6 billion.
Exhibit 3 summarizes relevant performance measures for broad industry groups. The industry groupings were made to promote comparability to GF Data industry measures.

A cursory review of the statistics in Exhibit 3 confirms the overall reasonableness of the observations. For example, distribution companies have the lowest margins, and manufacturing companies carry relatively large amounts of working capital.
Using a basic five-period discounted cash flow model, we then calculate the implied WACC for each industry grouping. Exhibit 4 illustrates the application of the model for the overall group.
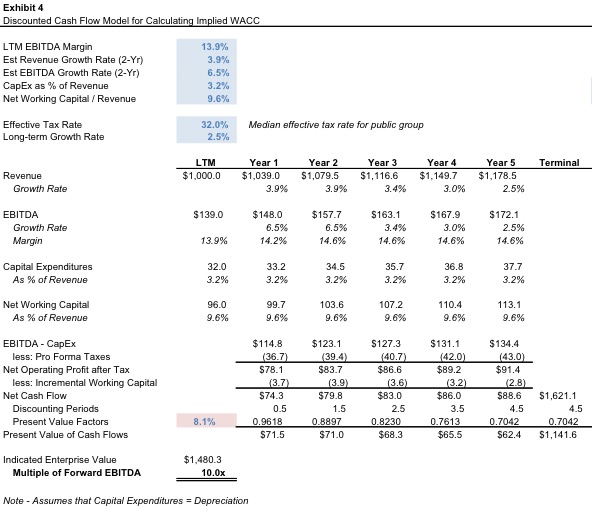
Using the relevant cash flow measures from Exhibit 3, the implied WACC is the discount rate at which the indicated enterprise value conforms to the forward EBITDA multiple. For the overall index, the median performance measures and EBITDA multiple imply a WACC of 8.1%.
Exhibit 5 summarizes results for the various industry groupings.
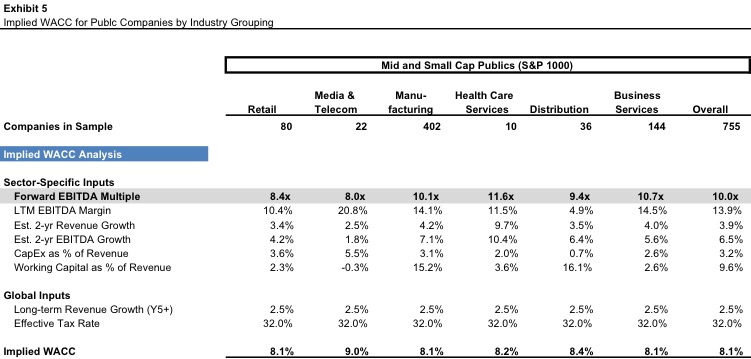
The most conspicuous observation from Exhibit 5 is that the WACCs for the public companies are more tightly clustered than the valuation multiples. This is encouraging, as it indicates that variation in company-specific attributes that affect cash flow exerts greater influence over valuation multiples than variation in the WACC. Excluding the Media & Telecom subgroup, the median observed EBITDA multiples range from 8.4x to 11.6x, while the implied WACCs range only from 8.1% to 8.4%. (The outlier valuation multiple and implied WACC for the Media & Telecom subgroup is perhaps explainable by the woes besetting the news publishing and TV/radio broadcasting businesses.)
Implied WACC for Lower Middle Market Companies
We next calculate the implied WACC for lower middle market companies (transaction values between $10 million and $250 million) based on transactional data compiled by GF Data. GF Data collects and publishes transaction information from approximately 250 private equity groups on a blind and confidential basis. In addition to transaction multiples, GF Data publishes very useful data on capital structure and financial costs. You can subscribe here. Since forward earnings estimates, capital expenditure, and working capital data for the companies in the GF Data set are not available, we assume that the relevant performance measures for the corresponding public company groups are applicable to the private companies. The implied WACCs and corresponding size premiums are summarized in Exhibit 6.
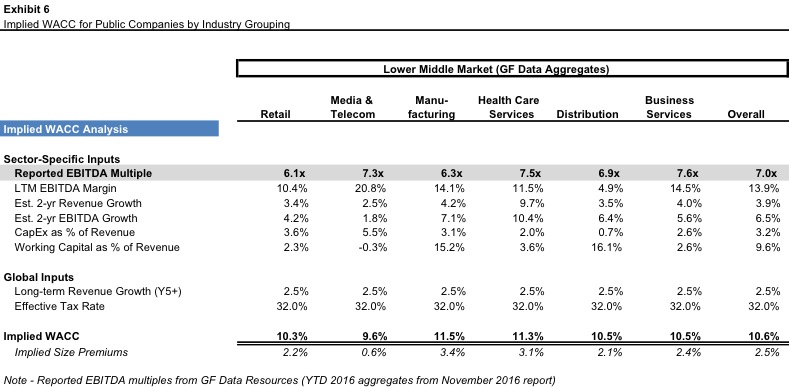
Excluding the Media & Telecom sector, the implied size premiums for the various industry groupings are between 2.1% and 3.1%, with the overall market at 2.5%. Again, these are size premiums relative to the WACC, not the cost of equity. On an absolute basis, the implied WACCs range from 10.3% to 11.5%.
Size Differences within the Lower Middle Market
In addition to the industry breakdowns, GF Data segregates the universe of observed transactions by size. As expected, within the lower middle market universe, valuation multiples are positively related to size, with the average EBITDA multiple on $100 million to $250 million transactions (8.9x) exceeding that on $10 million to $25 million transactions (6.0x). Applying the same procedure to this data yields additional color regarding the size premiums applicable to lower middle market companies, as summarized in Exhibit 7 below.
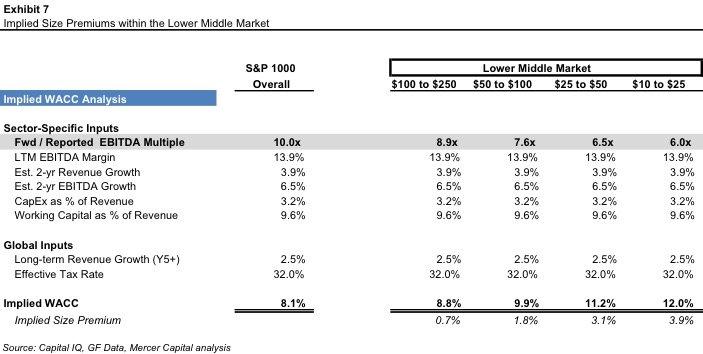
On this view, the size premium for the larger end of the lower middle market shrinks to 0.7%, while that for the smallest companies is 3.9%.
Takeaways
The analysis summarized in this post is not intended as a technique for calculating the weighted average cost of capital. It is offered, rather, as a set of guideposts to assist valuation specialists in assessing the reasonableness of the calculated WACC, particularly when the subject of the valuation is a controlling interest; for minority interest valuations, an equity perspective within the existing capital structure may be more relevant.
The traditional build-up computation of the WACC is subject to a host of variables that can have a material impact on the overall conclusion of the WACC. Different estimates regarding the risk-free rate, market risk premium, size premium, specific-company risk, cost of debt, tax rate, and capital structure can result in significantly different estimates of the WACC. The analysis in the post is not intended to suggest that certain build-up components are more appropriate than others. Rather, the analysis is intended to support the overall reasonableness of the concluded WACC.
To be sure, the implied WACCs presented in this post are also dependent upon multiple assumptions regarding growth rates, margins, tax rates, capital expenditures, and working capital. While we are comfortable with the overall reasonableness of these assumptions, others are certainly possible. For example, if the assumed long-term growth rate is higher, the implied WACCs will also be higher. However, given that our focus in this post is on the size premium measured as a delta, consistency is more important than precision.
It is also possible that the GF Data – like all transaction data sets – is subject to a selection bias, as it includes data only on companies that actually transacted. Perhaps more attractive companies having lower costs of capital are more likely to transact. That is ultimately very hard to know.
- Further, available trailing twelve month revenue growth rates and EBITDA margins reported by GF Data are generally higher (revenue growth often in the mid-teens and margins in excess of 20%). Whether the reported growth rates are sustainable with “normal” levels of capital investment is unknowable. Adjusting growth rates and margins to conform more closely to the GF Data statistics would increase the implied lower middle market WACCs on Exhibits 6 and 7 between 100 and 200 basis points.
- GF Data also publishes leverage statistics regarding the observed transactions. As expected, the observed capital structures at acquisition use more financial leverage than the typical public company. While the lower middle market capital structures may be expected to moderate over time, the capital structure discrepancy ultimately confirms the decision to focus on the WACC, rather than the cost of individual components, each of which will vary with leverage levels. The analysis assumes that the implied WACCs are optimal for the companies transacted.
The WACC for a specific company will necessarily consider risk factors unique to that company. In addition, the growth, margin, and other assumptions must be appropriate to the subject. In our view, however, the industry aggregate data summarized in this post can prove valuable for valuation specialists as they assess whether the inputs for the subject company are appropriately greater than, equal to, or less than these industry measures.
In the end, reasoned judgment is more important than technique. While further analysis is certainly possible, we believe the analysis presented in this post contributes to the goal of estimating the WACC from the perspective of the relevant market participants for lower middle market operating companies.
Mercer Capital’s Financial Reporting Blog
Mercer Capital monitors the latest financial reporting news relevant to CFOs and financial managers. The Financial Reporting Blog is updated weekly. Follow us on Twitter at @MercerFairValue.