Some valuation practitioners use a normalized risk-free rate in determining the cost of capital. This can inflate the cost of equity by up to a couple of percentage points, which in turn depresses valuation multiples. Is normalizing the risk-free rate a rational, reasonable practice? In today’s guest post, Chris Mercer suggests the answer is an emphatic no. (First appeared on Chris’s blog at chrismercer.net on July 16, 2017.)
The idea of normalizing Treasury yields when building up equity discount rates has been around for about a decade. The spot yield on the 20-year Treasury bond peaked at 15.1% in October 1981. After following a meandering downward path, the 20-year Treasury yield dropped to the 4% level in 2008 during the Financial Crisis.
At about this time, Duff & Phelps began advocating that 20-year Treasury yields should be “normalized” at about 4.0% when building up discount rates using versions of the Capital Asset Pricing Model. It was argued that the decline below the 4.0% level was temporary and at least partially a result of monetary policy. It was suggested that Treasury rates below that level were not reflective of the risks of business ownership during and following the Financial Crisis.
I do not believe that “normalizing” Treasury rates when building up discount rates is a procedure that should be used by business appraisers. This post provides the rationale for this position.
Some Context
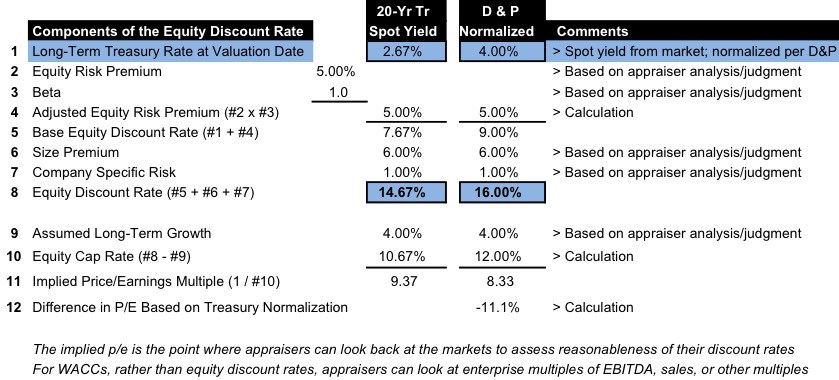
Assume for example a valuation date of September 21, 2015. The 20-year Treasury rate at that date was 2.67%. One appraiser used this 2.67% yield in its build-up of an equity discount rate. The other appraiser used a 4.0% “normalized” Treasury rate citing publications of Duff & Phelps. [e.g., Valuation Handbook 2017: U.S. Guide to Cost of Capital] For purposes of this discussion, assume that there were no other differences in assumptions related to the discount rates of the two appraisers.
The difference between these two assumptions is 1.33%, which is a significant difference in the context of developing equity discount rates for the same business at a point in time.
Background on Building Discount Rates
The question of normalizing long-term Treasury yields in building up discount rates is one that needs to be addressed in appropriate context. For discussion purposes, the two appraisers just mentioned developed discount rates as shown in the chart below. We will discuss the impact of differences in a following section.
In the table, the appraisers each made five assumptions in developing their discount rates. These are:
- The long-term Treasury rate yield. Historically, appraisers have used the spot yield for the long-term Treasury yield as of a valuation date as the base return in building up discount rates. Treasury rate yields are visible and readily available to business appraisers. The concept of “normalizing” Treasury rates is a relatively new idea advanced by professionals from Duff & Phelps and perhaps elsewhere.
- The equity risk premium. The equity risk premium is the expected return premium of the market, usually defined as the return of large capitalization stocks such as the S&P 500 Index, over the base Treasury yield used in the build-up. Historically, appraisers looked at the arithmetic average historical return of the market over the similar return of long-term Treasury bonds as measured by Ibbotson Associates (then Morningstar and now Duff & Phelps). In more recent years, there has been a focus on using expectational equity risk premiums, and appraisers and market participants have done independent studies to develop such premiums. The current range for equity risk premiums used by most appraisers is from about 5.0% to about 6.5%.
- The beta statistic. Beta, in plain language, is a measure of the riskiness of expected returns. A beta of 1.0 is reflective of the riskiness of the (large capitalization) market. Betas less than 1.0 and greater than 1.0 are reflective of less than market risk and greater than market risk, respectively. Beta is calculated by several services, and appraisers can calculate beta statistics on their own. There is potential for different assumptions regarding the time period for calculating beta. Betas can also be levered or unlevered. Suffice it to say that there is considerable room for appraiser judgment in assumptions made regarding
- The size premium. Smaller capitalization stocks are generally considered to be riskier than larger capitalization stocks and therefore, investors demand a premium in return for smaller capitalization companies. The extent of the size premium is a matter of appraiser judgment and analysis. Appraisers currently use return statistics published by Duff & Phelps (and before, Morningstar and Ibbotson Associates) in assessing the extent of appropriate size premiums.
- The company specific risk premium. The return statistics of public companies are the basis for the analytical judgments discussed above. When valuing private companies, there are often risk factors applicable to them that may not be applicable to the public companies to which they are being compared indirectly. There is no available market evidence regarding the extent of appropriate company specific risk premiums. There is, therefore, considerable room for judgment in assessing appropriate company specific risk premiums in private company valuations.
With all the room for appraiser judgment in developing discount rates, what can appraisers do to assure that the rates they develop are reasonable? I have said for many years that when appraisers develop discount rates – and implied valuation multiples – they need to be looking to test the reasonableness of their multiples and valuation conclusions in light of available market and transactional evidence.
I have also said that appraisers and courts too often focus in excruciating detail on the individual assumptions of build-up methodologies, rather than on the reasonableness of concluded discount rates and implied valuation multiples.
Impact of Using Spot Yields vs. Normalizing Long-Term Treasury Rates
We see in the chart above the impact of normalizing Treasury rates relative to using spot yields on discount rates and on the implied price/earnings multiples. The base equity rate (Line #5) is 7.67% using the actual valuation date Treasury yield while the comparable base equity rate is 9.00% if the Duff & Phelps normalized rate of 4.0% is used (assuming both appraisers use a 5.0% equity risk premium).
That difference translates into equity discount rates (Line #8) of 14.67% for the spot yield versus 16.00% for the normalized yield. The latter discount rate is 9.1% higher than the former. That could be significant, but let’s look a bit further. Equity discount rates are often used to capitalize expected net income (or net cash flow) in single-period valuation methods. We develop the appropriate capitalization rates using an assumed 4.0% long?term growth rate above (Line #10) and then, the implied price/earnings multiples (Line #11).
The multiple using the spot Treasury yield is 9.37x and the multiple using normalized Treasury rates is 8.33x. The normalized result is more than full a turn lower than the spot multiple (11.1% lower). Appraisers using normalized Treasury yields to build up discount rates include a subtle discount relative to valuations using spot yields. If no one mentions it, no one knows. So what should appraisers do and which Treasury yields should they use?
Why We Should Not Normalize Long-Term Treasury Rates
Years ago, when long-term Treasury rates were sliding down the slope mentioned above and noted in the charts below, I made an effort to normalize Treasury rates when building up discount rates in a couple of appraisals. After I had done this, I thought about things a good deal more and stopped the practice immediately.
Some of the reasons that came to mind then and now include:
- Normalization is a process in valuation that is used to adjust for one-time and non-recurring items on the income statement.
- The long-term decline in Treasury rates is neither one-time nor non-recurring. We see in a chart below that the 20-year Treasury yields were at or below 4.0% for more than a decade in the 1950s and early 1960s. And they have been in that range now for almost a decade as we write in 2017.
- The market for long-term Treasury bonds is both large and liquid. At the present time, the stock of Treasury bonds outstanding is on the order of $2 trillion, and the market is subject to active trading. In short, the price of long-term Treasuries is what it is as reflected in an open and active market.
- Looking at the discussion of building discount rates above, it is clear that the spot Treasury yield is the only readily available and unambiguous component of the build-up methodology. I am therefore quite reluctant to use any rate other than that readily available and visible rate.
- When long-term Treasury rates decline, that is an indication that long-term return expectations for other investments, including equities, may be declining as well. This decline needs to be reflected appropriately in the valuation of private businesses.
- A normalization process as reflected in the Duff & Phelps base equity percent (discussed below) places an artificial dampener on value using methods under the income approach. See the section just above.
Importantly, there is no “lookback” in the Duff & Phelps materials to suggest that the earnings multiples (price/earnings multiples, EBITDA to enterprise value, etc.) derived using the normalized recommendations make sense in light of then- or now-current market conditions.
The idea of normalizing long-term Treasury rates because of some notion that they are abnormally low at a point in time is a different concept than that of normalizing adjustments applied to company income statements.
My conclusion is and has been that normalizing long?term Treasury rates is not a reasonable valuation procedure when developing discount rates using the Capital Asset Pricing Model.
Historical Long-Term Treasury Rates
Before further discussing the rationale for suggesting that it is not reasonable to make “normalizing” adjustments to long-term Treasury rates for building up discount rates, let’s look at historical long-term rates. The following chart shows 10-year and 20-year Treasury Bond rates from 1953 to the present.
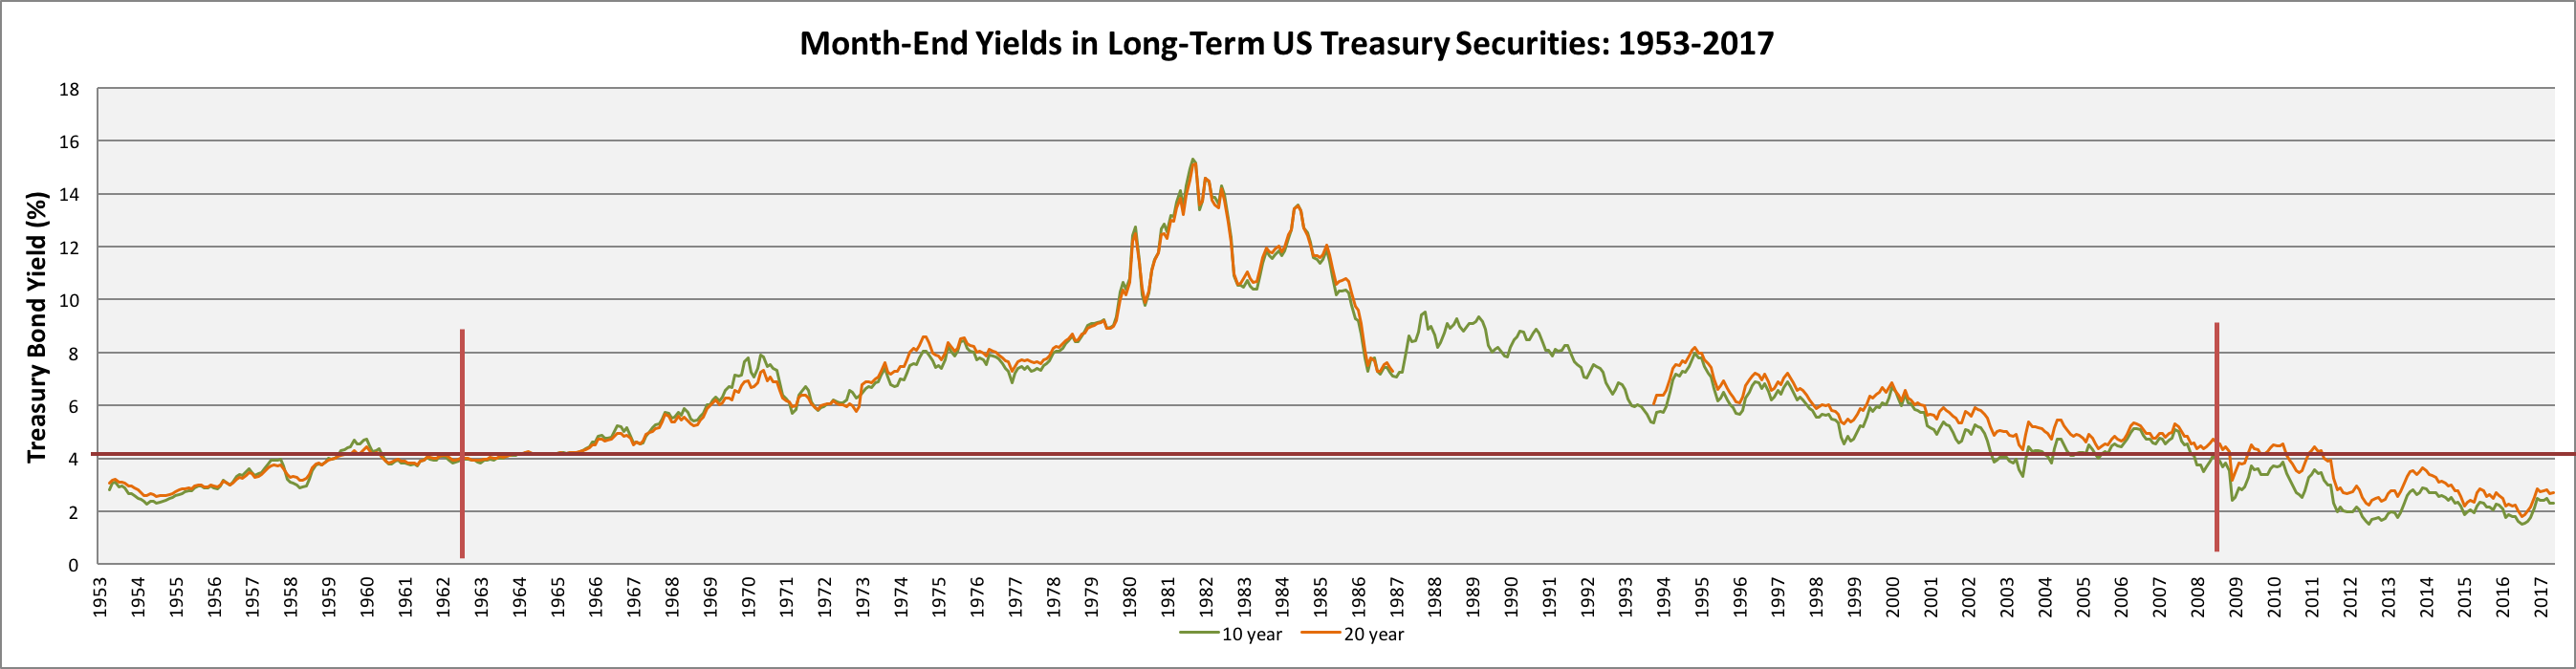
What we see in the left half of the chart above is that long-term Treasury rates held near or below 4.0% for more than a decade until mid-1963. The long-term rates then began a generally long-term climb before the 20-year rate peaked at 15.13% in October of 1981 (during a recession). After
After peaking, the 20-year rate began a generally declining trend, dropping below 4.0% in the Financial Crisis month of December 2008 and has remained generally below 4.0% since then. So the 20-year Treasury rate was at or below 4.0% for more than a decade in the 1950s and 1960s and has been at or below 4.0% for almost a decade as of June 2017.
The point is that within the lifetimes of many baby boomers, long-term Treasury rates have been near or below 4.0% for more than two decades. So what is “normal?”
This single-dimensional analysis of long-term Treasury rates does not support a normalization process beginning with the Financial Crisis in 2008.
Long-term Treasury rates peaked during the 1980-82 Recession at 15.13% (at a month-end). The right half of the chart shows long-term rates from the peak in 1982 until the present.
Since December 1981, the trend in long-term Treasury rates has clearly been down, as indicated by the blue trend line above. The red vertical line at December 2008 marks the time when the 20-year rate dropped below 4.0%. Is what has happened since December 2008 an aberration? Or does it more reasonably reflect a continuation of the downward trend begun in October 1981? The latter interpretation seems more reasonable in light of the analysis of long-term Treasury rates thus far.
Is what has happened since December 2008 an aberration? Or does it more reasonably reflect a continuation of the downward trend begun in October 1981? The latter interpretation seems more reasonable in light of the analysis of long-term Treasury rates thus far.
Market Multiples Respond to Declining Treasury Rates
The Gordon Model is a single period income capitalization model represented by the equation:
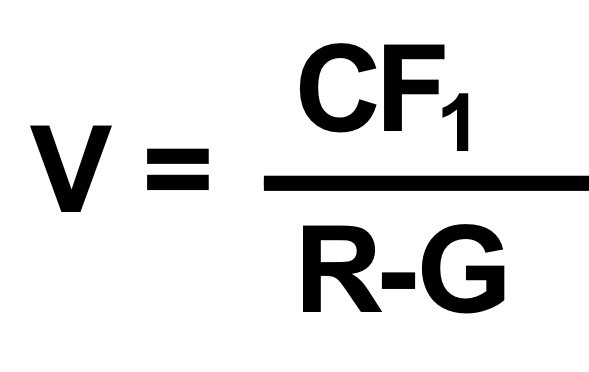
CF1 is expected cash flow. R is the equity discount rate like in the table above. G is the expected growth rate in cash flows.
We can examine the multiple part of the equation by looking at ( 1 / ( R – G )). Value is a function of the expected cash flows, risk and growth. As the discount rate, R, decreases, all else equal the expected price/earnings multiple and value will increase.
The next chart looks at monthly price/earnings multiples for the S&P 500 Index since December 2007, or just prior to the Financial Crisis, as reported by www.multpl.com. During the financial crisis, many companies in the S&P 500 experienced declining or substantially declining earnings (and losses). The chart looks past the abnormal price/earnings multiples for months in the Financial Crisis where price/earnings multiples exceeded 25.0x, as a result of short-term earnings decline and
The chart looks past the abnormal price/earnings multiples for months in the Financial Crisis where price/earnings multiples exceeded 25.0x, as a result of short-term earnings decline and begins in July 2010. The purpose of this is to hold the scale of the remaining observations to a reasonable level.

Post-crisis, the price/earnings multiple (as measured at each month-end) held in the general range of 15.0x until about December 2011. After that, the multiple has increased almost continuously to about 26x as of June 2017. Needless to say, the market capitalization of the S&P 500 Index has increased in step.
We compare the S&P 500 price/earnings multiples with the 20-year Treasury Bond yields for the same period. The blue line showing p/e multiples exhibits less volatility than does the red line showing 20-Year Treasury rates, but the general trend is (historically) low and generally downward. The simple correlation coefficient for the two series is -0.50%. The general decline in Treasury yields has some explanatory power relative to the rising price/earnings multiples, but clearly, other factors are at play, as well. The equity risk premium (or the range of premiums used by appraisers and market participants) has declined. Further, if we examine historical returns, there appears to have been some diminution in size premiums in recent years, as well.
The general decline in Treasury yields has some explanatory power relative to the rising price/earnings multiples, but clearly, other factors are at play, as well. The equity risk premium (or the range of premiums used by appraisers and market participants) has declined. Further, if we examine historical returns, there appears to have been some diminution in size premiums in recent years, as well.
We show this chart and talk about the Gordon Model math here because, while many factors may have contributed to the rise in equity values in recent years, at least one significant contributing factor has to have been a lowering of return expectations post the Financial Crisis. This would be reflected in a lowering of R in the equation above, and increases in price/earnings multiples.
Appraisers who normalize Treasury rates in building up discount rates eliminate this source of increasing value in private company valuations.
The Duff & Phelps Normalized Risk-Free Rates and Equity Risk Premiums
Duff & Phelps has advocated a normalizing of Treasury rates and a corresponding normalizing (or at least estimating) the equity risk premium since about 2007. In the Valuation Handbook 2017, a table is provided that summarizes the Duff & Phelps recommended U.S. equity risk premiums and the corresponding long-term risk-free rates since December 2007.
The table shows when either the recommendation for the equity risk premium or the normalized (versus spot yield) Treasury rate has been changed since inception in 2007. The table presumes that the appropriate base yield for the long-term Treasury assumption for appraisers is the normalized/spot yield recommended by Duff & Phelps. The recommended equity risk premiums and Treasury yields are added to provide the Duff & Phelps recommendation for the base equity discount rate percentage for use in building up discount rates.
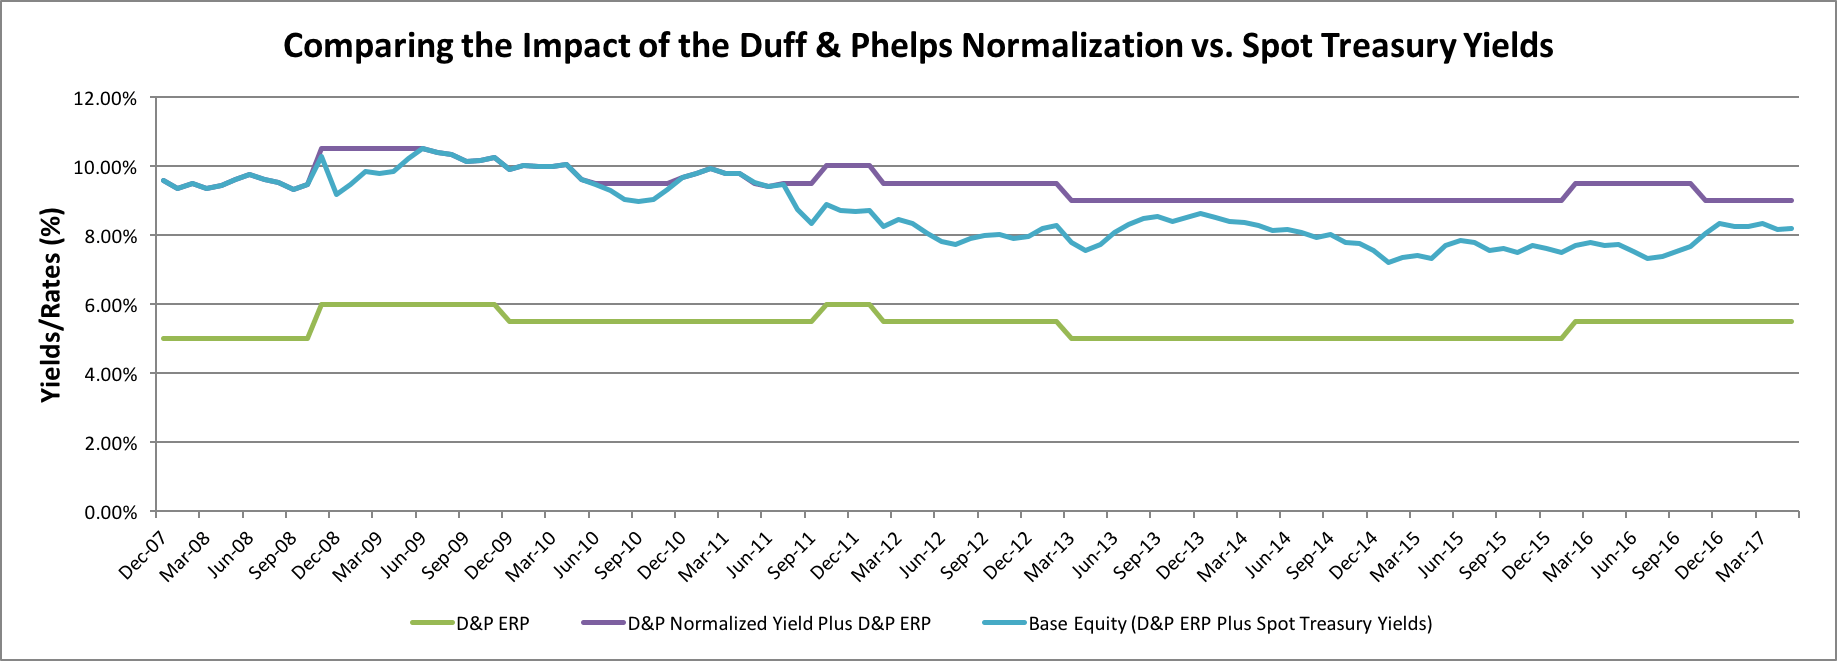
The table covers a number of time periods, and it is difficult to get a sense of the changes over time. In the next chart, we show the following based on the table above:
- 20-Year Treasury Spot Yields (dark blue). These are the month-end yields for the 20-year rate beginning at December 2007.
- Duff & Phelps Normalized (or Spot) Yields (red). The recommended yields from Duff & Phelps include normalized yields in some periods and then, a recommendation for the use of the spot yields in certain periods. The spot yields were the recommended rates for a number of periods leading to June 2011. Since then, the recommendations have been for the normalized yields.
- Duff & Phelps Equity Risk Premium (ERP) (green). The recommended ERP has been in the 5.0% to 6.0% range since inception and is shown for perspective.
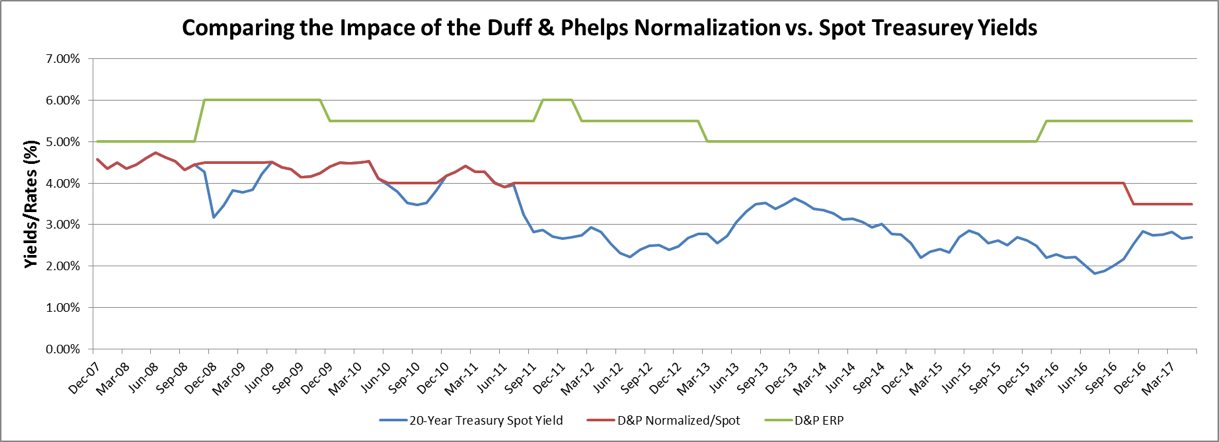
The normalized yield generally followed the spot yield until the second half of 2011. Since then, the normalized yield was held at 4.0% until November 2016, when the normalized yield was lowered to 3.5%. The spot yield on 20-year Treasuries has been below 4.0% since second half 2011. The conceptual impact of the normalization process is reflected by the difference between the red line (normalized) and the blue line (spot yields). That difference has ranged from about 1% to more than 2% over the normalization period.
Note that since June 2011, the spot yields have been below or well below the Duff & Phelps normalized Treasury rates. This is the issue that we posed at the beginning of this post. The average normalized Treasury yield per Duff & Phelps since June 2011 has been 3.95%, or about the 4.0% threshold of “normalizing” posed in their publications. The average Treasury spot yield (at month-ends) has been 2.73% since then, or 1.22% lower than the Duff & Phelps normalized yield (on average). This is a significant valuation judgment, and one that we at Mercer Capital have not made for reasons noted in this post.
We now look at the base equity rates implied by the Duff & Phelps normalization process and compare them to the base equity rates based on normalized yields.
- Duff & Phelps Base Equity Rates with Normalized Treasuries (purple). This series is the sum of the normalized Duff & Phelps Treasury rate and their recommended equity risk premium.
- Base Equity at Spot Treasury Yields (blue). This final series is the sum of the spot Treasury yields and the Duff & Phelps recommended ERP. We could have used another series for the ERP, but the Duff & Phelps series is in the range of what many appraisers have used over the period covered in the table.
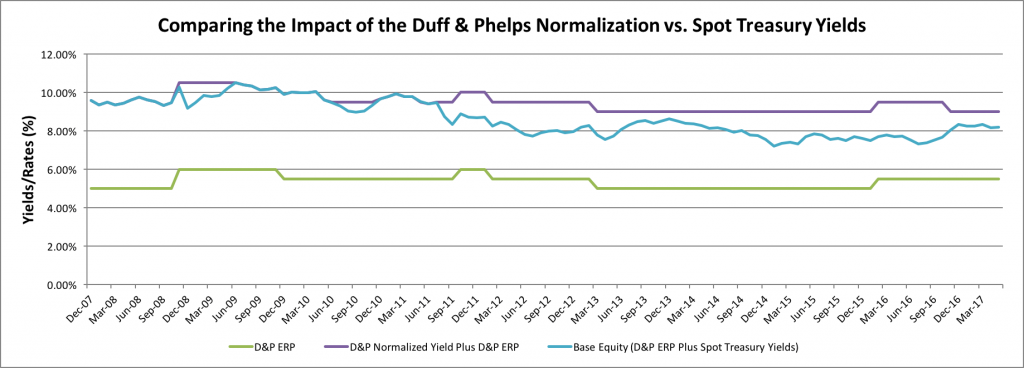
The chart above takes the Duff & Phelps normalized Treasury yields and the spot Treasury Yields from the immediately preceding chart and adds them to the Duff & Phelps equity risk premium. Focus now on the upper lines (lighter blue and purple). The purple line is the recommended Duff & Phelps base equity rate (including the Duff & Phelps normalized Treasury rate), and the lighter line is the sum of the spot yields (blue line at the bottom) and the ERP (green line). The difference between the Duff & Phelps base equity rate and that derived using spot Treasury yields is the difference between these two lines, and it parallels the difference between the normalized and spot Treasury yields.
Look at the first normalization chart above at the far right on the red line denoting the Duff & Phelps normalized Treasury yield. The recommended yield was dropped from 4.0% to 3.5% effective November 15, 2016 (as noted in the chart above, as well). This lowers the differential between the spot rates and the recommended rate from the 1.5% to 2.0% range down to the 0.66% to 1.0% range.
This change could be an indication that Duff & Phelps now believes that their recommended normalized Treasury rate has differed too much from the observable spot yields, and a decision was made to reduce that difference. Regardless, the lowering of this recommendation reflects the fact that long-term return expectations are lower now than they were before the change.
Conclusions
For the reasons noted in this post, I believe that business appraisers should not normalize Treasury rates when building discount rates using the Capital Asset Pricing Model. The 20-year Treasury bond rate is used as a proxy for long-term investments in private businesses and long-term expectations for cash flows. The market for long-term Treasury bonds is both large (nearly $2 trillion) and active in trading. I do not think it is a business appraiser’s job to second-guess this market, but if you think otherwise, feel free to reach out.
Mercer Capital’s Financial Reporting Blog
Mercer Capital monitors the latest financial reporting news relevant to CFOs and financial managers. The Financial Reporting Blog is updated weekly. Follow us on Twitter at @MercerFairValue.