Component Analysis of RIA Returns
A Method to Examine Valuation, Risk Management, and Return Optimization
Ayrton Senna dominates the 1988 Formula One season in the McLaren Mp4/4. (Instituto Ayrton Senna, CC BY 2.0
If you ask most people to name an entrepreneur who made their mark in cars, they would probably name Henry Ford or Elon Musk. A third and equally compelling story is that of Bernie Ecclestone, the former chief executive of Formula One Group. Ecclestone grew a fairly obscure and marginally sustainable auto racing series into one of the world’s largest and most widely followed sports, with billions of viewers. Even more remarkable is that Ecclestone didn’t “acquire” his ownership in F1 from anybody—he created it.
Ecclestone started his career after World War II as a parts dealer, mechanic, and sometimes racecar driver. In the early 1970s, he cobbled together enough money to buy an F1 team (a much cheaper endeavor then). With the perspective of a team owner, Ecclestone realized that the teams needed to band together to collectively negotiate better deals with track owners and television, and formed the Formula One Constructors Association and later the Formula One Promotions and Administration.
Eventually, Ecclestone negotiated the Concorde Agreement, yoking together the teams and associations affiliated with F1 to set the terms by which teams compete in races. He then wrapped all of this up in Formula One Group, effectively his holding company. By the late 1990s, Ecclestone had, piece by piece, constructed an enterprise that controlled Formula One racing, and he controlled that enterprise. It made F1 what it is today, and it made him a billionaire.
The Sum Is a Function of Its Parts
Bernie Ecclestone’s assemblage of F1 from various parts that became greater as a whole is a useful reminder that businesses can be viewed not just as a monolithic enterprise but also as an assemblage of individual functions with their own performance attributes, risks, and opportunities. Like a racecar, the whole may be greater than the sum of its parts, but examination of the parts yields valuable information about the whole.
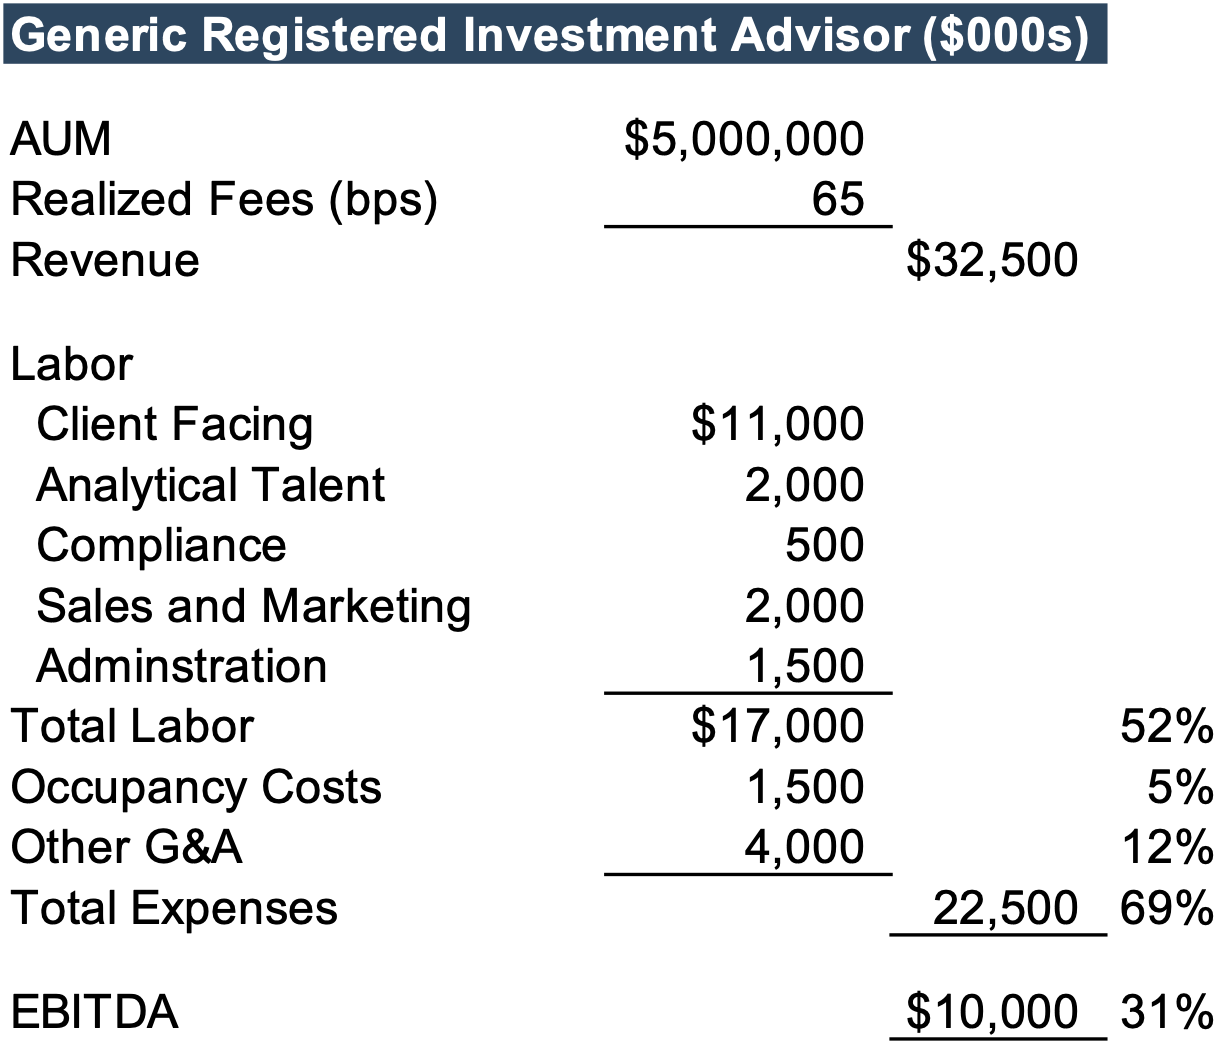
This sort of component analysis can be a helpful way to analyze RIAs. Broadly speaking, RIAs exist to manage money, but that business’s profitability (and value) over time hinges on 1) servicing existing clients and 2) attracting new clients. Those two functions are usually not thought of independently of each other. An example P&L for a $5 billion AUM firm might look something like this:

For purposes of this discussion, it doesn’t matter what flavor of RIA this is (wealth or asset manager, individual or institutional, MFO or OCIO, etc.). In aggregate, our “Generic” RIA has $5 billion in AUM, generates revenue off a blended fee schedule of 65 basis points, spends a bit over half of that on labor, between 15% and 20% on non-labor expenses, and ultimately generates an EBITDA margin of just over 30%.
Existing Business on a Stand-Alone Basis
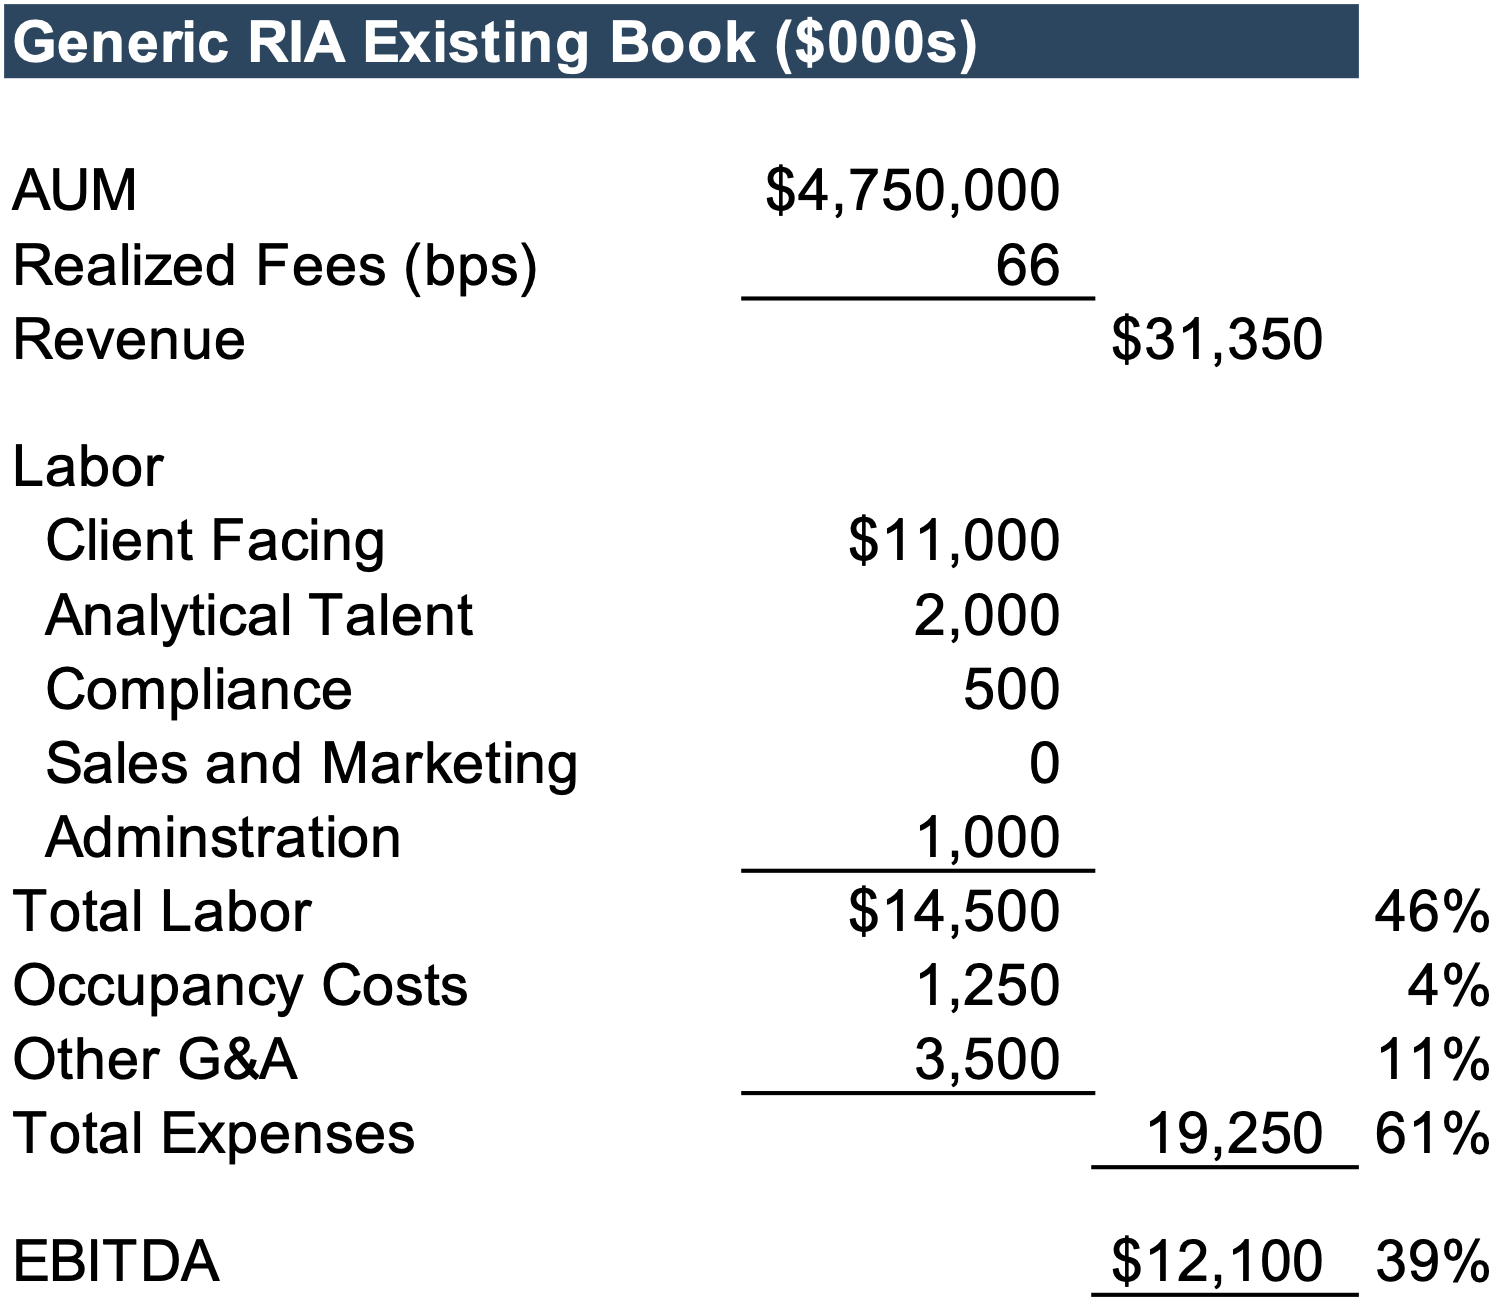
The value of an RIA is a function of recurring revenue. Investment management engenders long-term relationships between firms and their clients, and the persistence of those relationships provides an almost bond-like series of predictable returns. If you take the Generic RIA we’ve set up as an example and look at the revenue from the existing book of business and the cost of servicing that revenue, you get a stand-alone P&L that looks something like this:

Returns from the existing book of business can generally be characterized as more plentiful than returns from new business. In an era of growing fee pressure, existing business usually pays more (basis points) than new business. Labor costs remain significant to service existing business but are lower than the cost of acquiring new clients. Even if we charge for an appropriate amount of occupancy and other G&A, the existing book of business, in isolation, generates a profit margin more than 25% higher than that of the aggregate enterprise. It shouldn’t be surprising that existing business is usually the most profitable business.
Performance Metric for Existing Business
The golden opportunity for RIAs is the higher and more predictable margins associated with existing relationships. The biggest threat to that opportunity is, of course, client attrition. Mitigating attrition requires spending on client service, and from that relationship, you can glean a valuable performance metric.
If you’re looking for a useful KPI to help manage your business, think about the tradeoff between the incremental margin generated by servicing existing clients and the net AUM attrition (client withdrawals and terminations net of market returns and client contributions). Theoretically, more spending on servicing existing clients should stem attrition. Optimizing the margin/retention equation will build value in your firm.
(RIA) Growth at a Reasonable Price
The worst-kept secret in the RIA industry is that most firms struggle to generate organic growth. This is often explained in terms of the industry’s maturation, the aging advisor base, and the lack of service differentiation. Arithmetically, though, it’s easy to show that growing an RIA is, if you look at it in isolation, very expensive.

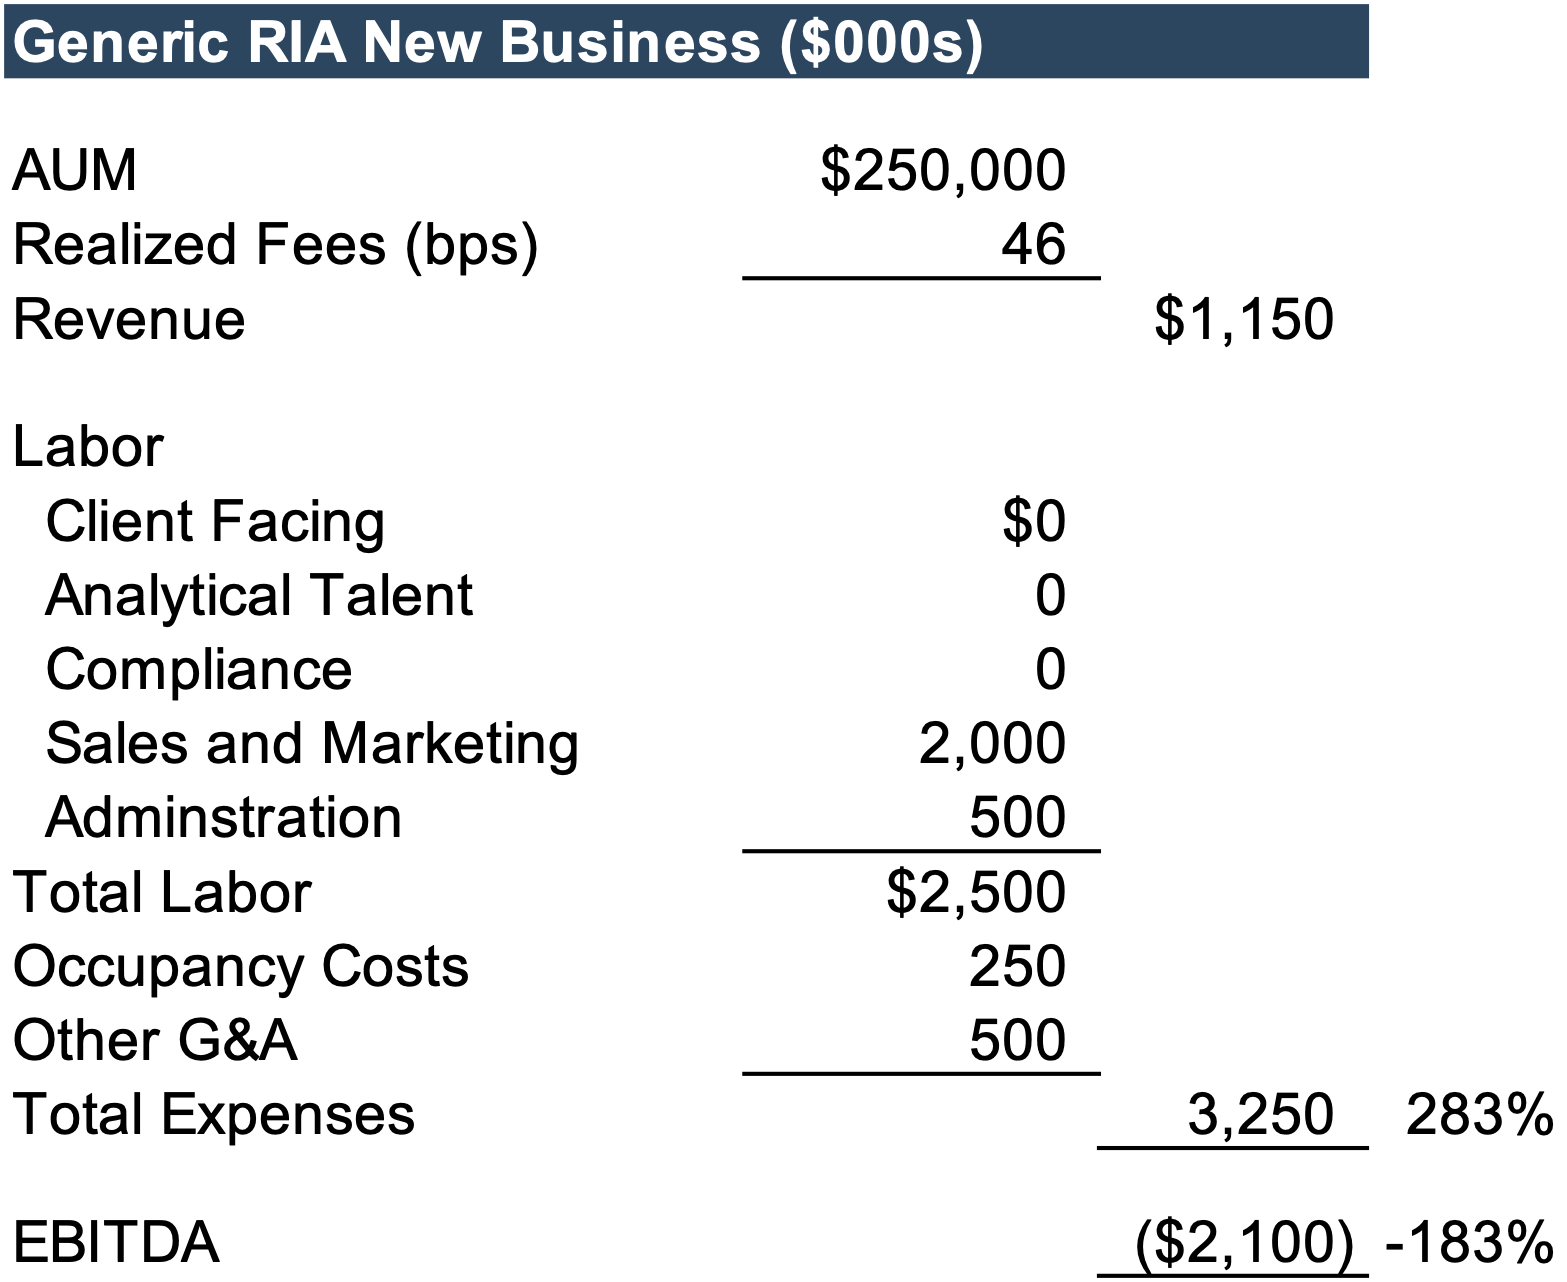
Assume our Generic RIA shows net AUM growth of 5% per year, absent market activity. That’s $250 million and probably at a somewhat lower fee schedule than legacy clients pay. Attracting new business doesn’t need much of the client service, compliance, administrative, and G&A costs that servicing existing clients requires, but it does require expensive sales and marketing. The cost of attracting new business in any given year usually exceeds the marginal benefit of that new business in the first year and sometimes in the first several years.
Growth is expensive, but it isn’t optional
Growth is expensive, but it isn’t optional. Growth provides opportunities for staff development, which reduces talent attrition and augments shareholder returns. Growth provides a portion of an investor’s required return and supports the narrative that the firm’s business model is viable and sustainable. For these reasons, among others, the RIA community is racing to find multiple arbitrage opportunities to generate growth that isn’t happening organically.
Performance Metric for New Business
What is a reasonable cost for growth? As shown above, efforts to deliver new AUM to manage often cost more, initially, than the revenue generated by new business. In our example case, the total expense for new revenue is nearly three times the amount of new business. Put another way, it will take three years for the new business to pay for the investment to generate it. After the payback period, new business becomes accretive to profitability as it becomes part of that existing book, with more predictable revenue and bigger margins.
The payback period for new business is a useful way to think about a firm’s investment in generating new business. If the payback period is too long, an RIA may not have an effective marketing plan. If payback is too quick, the firm may be under-exploiting an excellent opportunity. Optimizing the payback period is a function of the growth and investment tolerance of the ownership, and the margin on existing business. If building a larger book is particularly valuable, you’ll have more margin to invest in building more business.
Unfortunately, the opposite is also true. Poor margins on existing business won’t provide the cash flow needed to build the business.
Volatility and Valuation
Segmenting an RIA into component returns also offers opportunities to think about risk and value to the RIA. The steady returns of existing business, in which market gains and client additions may be more than enough to offset withdrawals and attrition, suggest a bond-like return. Mapping returns from new business can show everything from moderate variability (in the case of mass-affluent wealth management) to very lumpy (in the case of institutional platforms like an OCIO) and should be thought of through the lens of probability distribution.
Think about risk and value to the RIA
As such, the cost of capital for the existing book of business is necessarily much lower than it would be for new business. How much lower is a function of fact patterns specific to the RIA and some market-informed judgment? Fortunately, a close look at historical investment flows should reveal a pattern for what to expect in terms of net AUM changes from an existing book of business. Applying a lower than firm-wide discount rate offers clues as to the value of the existing book on a stand-alone basis, as well as the proportion of overall firm value.
It’s also interesting to think about the value of growth by modeling the internal rate of return for investment in new business.
 In this case, we’ve assumed that the EBITDA margin for new business in our Generic RIA would be around 60% and modeled the IRR to receive that return for ten years following the marketing expenditure to land the business. (A more thorough analysis would look at the likely attrition rate on new business and model some residual cash flow at the end of the projection period into perpetuity. For the sake of not putting any more numbers on your screen than necessary, a finite ten-year projection is a good guess.)
If the investment amount is higher, or the marginal EBITDA return is a lower percentage of new fees, the IRR compresses. If returns are better or the cost to generate them lower, the IRR will improve. One would want an IRR at a good premium to the firm’s aggregate cost of capital to make marketing for new business worthwhile. Optimizing the investment in new business would likely be a tradeoff between the highest aggregate level of new business (more is more) and the IRR of the effort (more is more).
Component Analysis of Risk
Component return analysis is also useful to model the risk attributes of an investment management firm. Certain risks affect the existing base of business differently than new business.
Certain risks affect the existing base of business differently than new business.
For RIAs in businesses facing legislative action, such as attempts to restrict institutional ownership of rental housing, component analysis helps isolate the stroke-of-the-pen risk that would limit opportunities to raise new funds or make new investments to the “new business” side of the equation, leaving the value of servicing existing relationships intact.
Other sorts of exogenous shocks, like severe market corrections, may negatively impact existing client relationships but simultaneously increase opportunities for new relationships. This ties well with our thesis that existing business models are like a bond, where risk is asymmetric to the downside, and new business models more like an option, where volatility is accretive to value.
In Closing…
There’s much more to say about component return analysis, but we don’t offer it as a substitute for keeping your eyes on the big picture. As brilliant as Bernie Ecclestone was in creating his dominant position in F1, he also became a bigger target and was eventually dethroned and lost his position at Formula One Group. He may have focused a bit too much on the upside when he neglected to pay all of his taxes and, consequently, had to face the downside of incarceration.
If you’re curious about how to examine your RIA using component analysis, give us a call, and we will think through the exercise with you. You might be surprised by what you learn.
 RIA Valuation Insights


