Multiple Contraction Drives Returns for Publicly Traded Asset/Wealth Managers


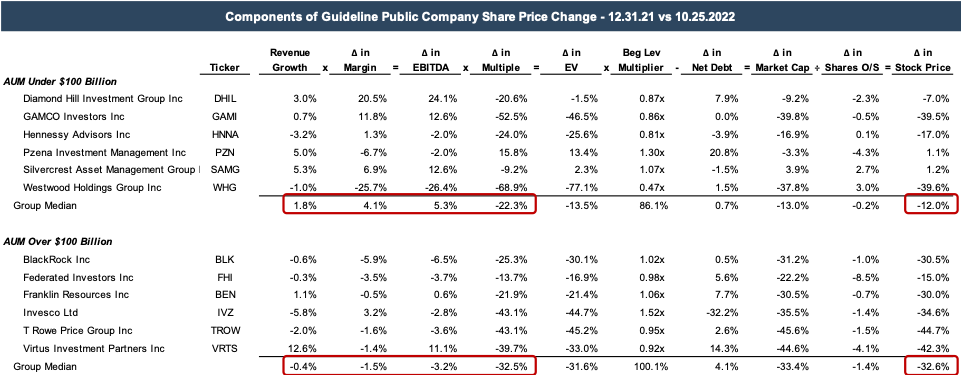
So far this year, many publicly traded investment managers have seen their stock prices decline by 30% or more. This decrease is not surprising, given most firms’ broader market decline and declining fee base. With AUM for many firms down significantly from year-end, trailing twelve-month multiples have declined, reflecting the market’s expectation for lower profitability in the future. For more insight into what’s driving the decrease in stock prices, we’ve decomposed the decrease to show the relative impact of the various factors driving returns between December 31, 2021, and October 25, 2022 (see table below).
Click here to expand the image above
For publicly traded investment managers with less than $100 billion in AUM, the last twelve-month (LTM) revenue for the most recent available twelve-month period increased about 2% relative to year-end. Due to the operating leverage in the RIA business model, the decline in revenue also resulted in a higher EBITDA margin. The net effect is that LTM EBITDA increased about 5% on average year-over-year for these firms. The fundamentals for the larger group (firms with AUM above $100 billion) fared worse, with profitability generally decreasing due to modest revenue declines and margin compression.
While the sub-$100B group generally saw better actual performance than the larger group, both groups saw significant declines in the LTM EBITDA multiple, which was the primary driver of the stock price decreases. Year-to-date, the median multiple for the larger group (AUM above $100 billion) has been cut by nearly a third. In comparison, the smaller group (AUM below $100 billion) saw the median multiple decrease by about 12%.
The multiple compression relative to year-end is not surprising, given the market’s trajectory this year. While LTM EBITDA declines have been modest for the larger group and performance has increased for the smaller group, market participants value these businesses based on expectations for the future, not on LTM performance.
What’s Your Firm’s Run Rate?
The multiple contraction seen in the publicly traded investment managers over the last year illustrates the importance of expected future performance on RIA valuations. The market decline and inflationary pressures that have manifested this year have yet to be fully reflected in LTM performance metrics. But as AUM has declined for most RIAs, so too has the run-rate revenue and profitability. The decline in run-rate revenue and profitability (and expectations for the same) is a driving factor behind the multiple compression observed over the last year in public companies.
Market participants tend to focus on the run-rate level of profitability because it’s the most up-to-date indication of a firm’s revenue and profitability and the baseline from which future performance is assessed. This is increasingly true in today’s volatile market as buyers seek to determine a firm’s ongoing profitability after giving effect to the market movements and inflationary pressures that have impacted firms this year.
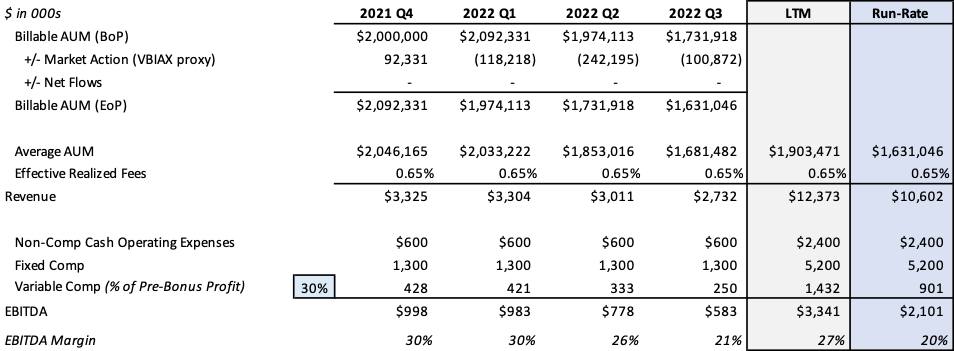
Consider the financial results for a hypothetical firm (ABC Investment Management) shown below. While illustrative, the AUM trajectory and cost structure of this firm since year-end are not unusual relative to those exhibited by publicly traded investment managers and many of our privately held RIA clients.
Click here to expand the image above
In the example, we assume that ABC began the fourth quarter last year with $2.0 billion in AUM. Market movement is estimated using the market performance of VBIAX (a rough proxy for a traditional 60/40 portfolio). Assuming zero net inflows over the last year, ABC would have ended the third quarter of 2022 with a little over $1.6 billion in AUM, down nearly 20% from a year prior. Given the operating leverage of the business, ABC’s EBITDA in the third quarter declined by over 40% relative to the fourth quarter of last year.
On an LTM basis, ABC generated revenue of about $12.4 million and EBITDA of $3.3 million (representing a 27% EBITDA margin). On a run-rate basis, however, the performance is markedly different. Given current levels of AUM and operating expenses, ABC’s run-rate revenue is $10.6 million, and run-rate EBITDA is just $2.1 million—a nearly 40% decline relative to LTM EBITDA. This example illustrates the differing perspectives that emerge in down markets: While sellers focus on LTM metrics, buyers focus on the run rate.
Implications for Your RIA
While multiples for publicly traded asset and wealth managers have been hit hard this year, RIA valuations in the private market have been more resilient as a proliferation of professional buyers and capital in the space have supported deal activity and multiples. Nevertheless, market conditions are beginning to have an effect. Run rate performance for most firms is down significantly, and borrowing costs for leveraged consolidators are rising. The upward momentum in multiples that persisted throughout last year has stalled, and deal structures have started to shift more of the purchase price into contingent consideration to bridge increasingly divergent buyer and seller expectations.