Multiple Expansion Drives 70%+ Returns for RIA Stocks Over Last Year


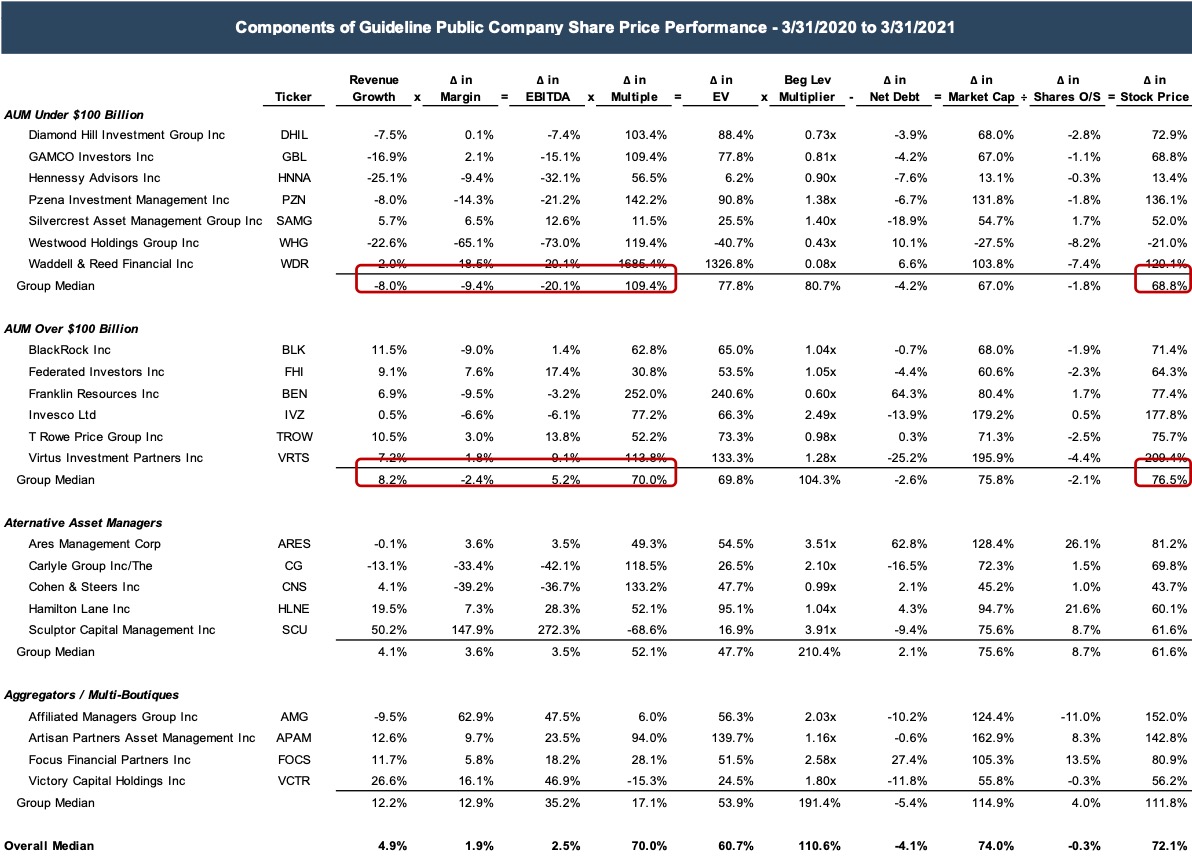
Over the last year, many publicly traded investment managers have seen their stock prices increase by 70% or more. This increase is not surprising, given the broader market recovery and rising fee base of most firms. With AUM for many firms at or near all time highs, trailing twelve month multiples have expanded significantly, reflecting the market’s expectation for higher profitability in the future. For more insight into what’s driving the increase in stock prices, we’ve decomposed the increase to show the relative impact of the various factors driving returns between March 31, 2020 and March 31, 2021 (see table below).
Click here to expand the table above
For publicly traded investment managers with less than $100 billion in AUM, trailing twelve month (TTM) revenue for the year ended March 31, 2021 declined about 8% year-over-year. Due to the operating leverage in the RIA business model, the decline in revenue also resulted in a lower EBITDA margin. The net effect is that TTM EBITDA declined about 20% on average year-over-year for these firms. The fundamentals for the larger group (firms with AUM above $100 billion) fared better, with profitability generally increasing despite the market downturn during the year ending March 31, 2021. These firms saw positive revenue growth across the board, although in many cases the revenue growth was partially offset by margin compression.
For both groups, expansion in the TTM EBITDA multiple was the primary driver of the stock price increases. The larger group (AUM above $100 billion) saw the median multiple increase 70%, while the smaller group (AUM below $100 billion) saw the median multiple more than double.
The multiple expansion between March 31, 2020 and March 31, 2021, while extreme, is not surprising given the trajectory of the market over the last year. While EBITDA was down ~20% year-over-year for the smaller group (and up ~5% for the larger group), the market values these businesses based on expectations for the future, not on LTM performance. As of March 31, 2020, AUM (and run-rate profitability) was down significantly, and depressed market prices continued to impact revenue for 2-3 quarters for many firms. But the market recouped its losses relatively quicky and continued to trend upwards. Today, AUM for many firms is hovering at or near all time highs.
What’s Your Firm’s Run-Rate?
The multiple expansion seen in the publicly-traded investment managers over the last year illustrates the importance of expected future performance on RIA valuations. The baseline for estimating future performance is the firm’s run-rate performance today. RIAs are unique in that run-rate revenue can be computed on a day-to-day basis using the market value of AUM and the fee schedules for client accounts. After deducting the firm’s current level of fixed and variable costs, run-rate profitability can also be determined.
Market participants tend to focus on the run-rate level of profitability because it’s the most up-to-date indication of a firm’s revenue and profitability and the baseline from which future performance is assessed. As AUM has increased for many RIAs, so too has the run-rate revenue and profitability. The significant improvement in run-rate revenue and profitability (and expectations for the same) is a driving factor behind the multiple expansion observed over the last year.
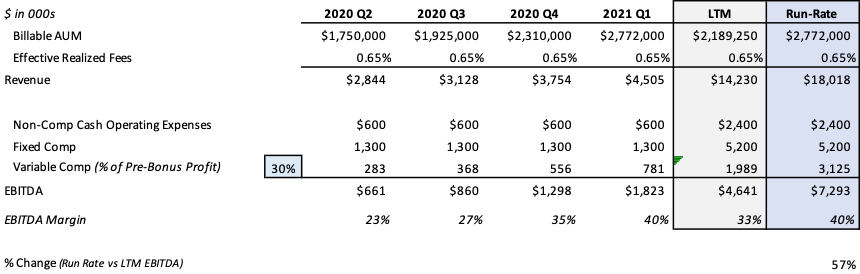
Consider the financial results for a hypothetical firm (ABC Investment Management) shown below. While illustrative, the growth of this firm since March 31, 2020 is not unusual relative to that exhibited by publicly traded investment managers and many of our privately-held RIA clients. During the second quarter of 2020, ABC Investment Management billed on $1.75 billion in AUM at an effective realized fee of 65 basis points, resulting in revenue for the quarter of $2.8 million. After subtracting compensation expenses and overhead, ABC generated $660 thousand in EBITDA for the quarter. AUM grew rapidly as the market recovered, such that by the first quarter of 2021 the firm was billing on $2.8 billion in AUM at the same fee of 65 basis points. For the full year, ABC Investment Management generated $14.2 million in revenue and $4.6 million in EBITDA.
As of March 31, 2021, however, the firm’s run-rate performance was significantly higher than its performance over the last twelve months. ABC’s $2.8 billion in AUM was generating $18.0 million in annualized revenue at the effective realized fee level of 65 basis points. Assuming the same level of fixed costs and the appropriate increase in variable costs to reflect the higher revenue, ABC was producing run-rate EBITDA of $7.3 million at the end of the first quarter. That’s a 57% increase relative to EBITDA over the last twelve months.
Implications for Your RIA
As always, valuation is forward looking. In relatively stagnant markets, there might not be much of a difference between LTM and ongoing performance. But given the shape of the market recovery over the last year, the difference today can be material, as the example above illustrates. If you’re contemplating a transaction in your firm’s stock, it’s worth considering where your firm is at today, not just what it’s done over the last year.