RIA “Comps” Don’t Always Tell the Same Story
Divergent Performances of LM, TROW, BEN, and AMG Show Industry’s Susceptibility to Company Specific Events Over Market Forces


As valuation analysts, we often look to comparable publicly traded businesses (“comps”) to glean an appropriate range of valuation metrics and multiples for the companies we value. Calling them “comps,” however, is often a stretch, since it is rare that we can find public companies that are truly comparable to the private company we’re trying to value. The publics are often too large and diverse to be labeled as comps, so we usually seek public companies that are in a similar line of business and call them guideline companies instead.
While it’s not unusual for companies in the same guideline group to have divergent share price performance despite facing the same industry headwinds (or tailwinds), publicly traded RIA stock performance can vary dramatically.
The past twelve months have been no exception, especially for T. Rowe Price (ticker: TROW), Franklin Resources (BEN), Legg Mason (LM), and Affiliated Managers Group (AMG). TROW and LM have bested the market and asset manager index while AMG and BEN have fallen well short.
Performance Over the Last Twelve Months
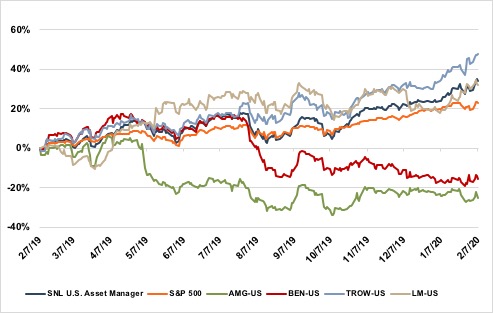
Source: S&P Global Market Intelligence
So what’s driving this disparity? Much of it can be explained by performance net of expectations. T. Rowe Price and Legg Mason have consistently beat consensus EPS over the last several quarters on steady gains in revenue and earnings. AMG and BEN have missed Street estimates and recent financial performance has been more volatile.
While we would not ordinarily include these businesses in a guideline group (our clients are typically much smaller than these companies), there is a key takeaway from all this variation in stock performance. Our recurring clients are often surprised when AUM, revenue, and earnings are up year-over-year, yet our valuation of their company goes down. This usually occurs when these key financial metrics fall short of forecast expectations, and the outlook for the business gets revised accordingly. This may happen to your clients’ stock holdings, and it’s no exception for the value of your business.
We’re sometimes surprised by the variations in RIA share price performance since their revenues are so highly correlated with market conditions. The reality is that these businesses are unique, and their values can diverge widely on variations in financial performance and the outlook for earnings. On the qualitative side, new business development, personnel changes, variations in investment performance, and regulatory changes can all drive a wedge in how your business performs relative to your competition. The market certainly has an impact, but there are many other factors that you and your employees can control.
Still, we don’t typically see a 40%+ increase in value (TROW) and a ~25% decline in a bull market (AMG) for two businesses in the same industry, so this disparity is worth a second look. T. Rowe Price was able to lever a market tailwind with cost-cutting initiatives and net client inflows to its mutual fund business unlike many of its competitors. AMG, on the other hand, has struggled with the many headwinds facing asset managers and the consolidators that invest in them.
Your firm’s value has probably not changed this much over the last year. You’ve likely benefited from strong market conditions, but industry headwinds persist, particularly on the asset management side. It’s difficult to assess the net impact of a lot of conflicting forces, especially if you have little or no background in business valuation or corporate finance. This is why we recommend hiring a valuation firm to appraise your business on a regular basis to gauge your progress and have a feel for what your company could sell for when that day comes. We’re here to help.