The Eye of the Storm
RIAs Outperform the S&P 500 in Q4 2022


The RIA industry saw a strong fourth-quarter rally, driving most categories of publicly traded investment managers to outperform the S&P in the last quarter of the year. Alternative asset managers, however, declined from their early-November peak to perform in line with the S&P during this period.
Performance by Sector
The uptick in the broader market during Q4 translated to an improved profitability outlook for asset managers due to their revenue model and operational leverage. However, Q4 earnings have yet to be announced as of the writing of this blog. With inflationary pressures continuing to drive up operating costs, it is yet to be seen how Q4 market gains translate to the bottom line.
Investment Manager Performance by Sector – Q4 2022
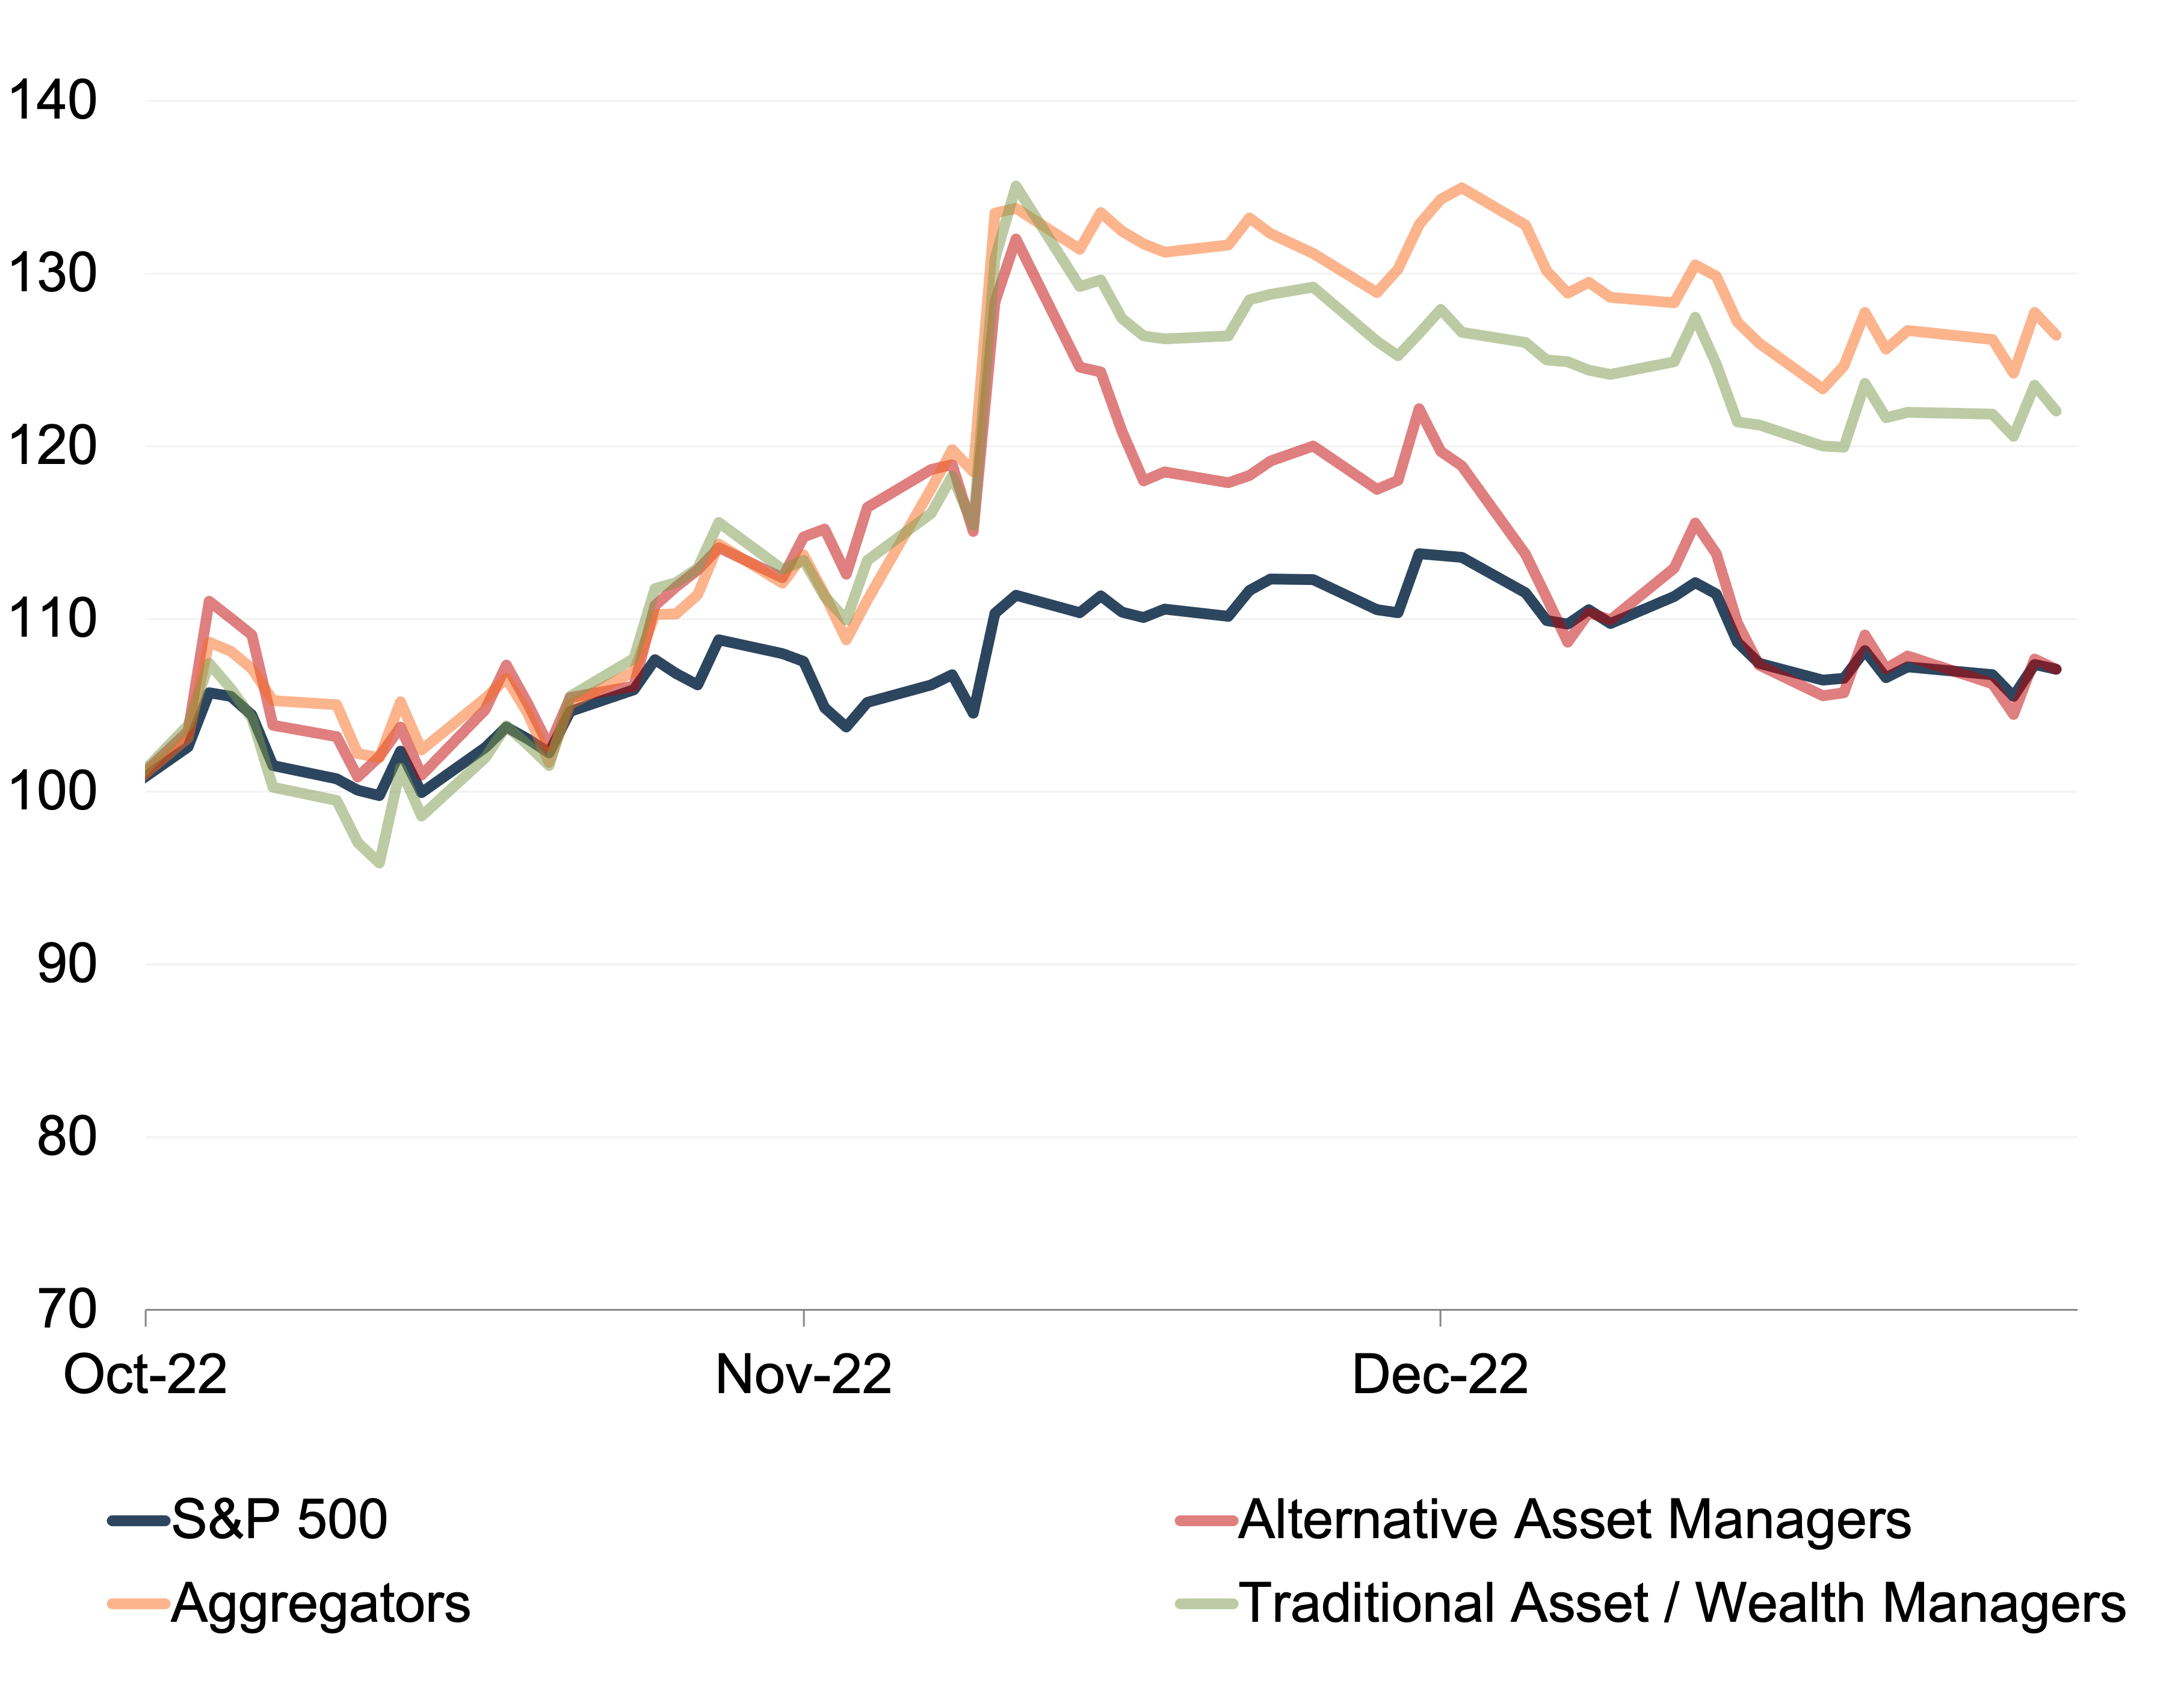
Source: S&P Market Intelligence
>>>
Investment Manager Performance by Sector – Year Ended December 31, 2022
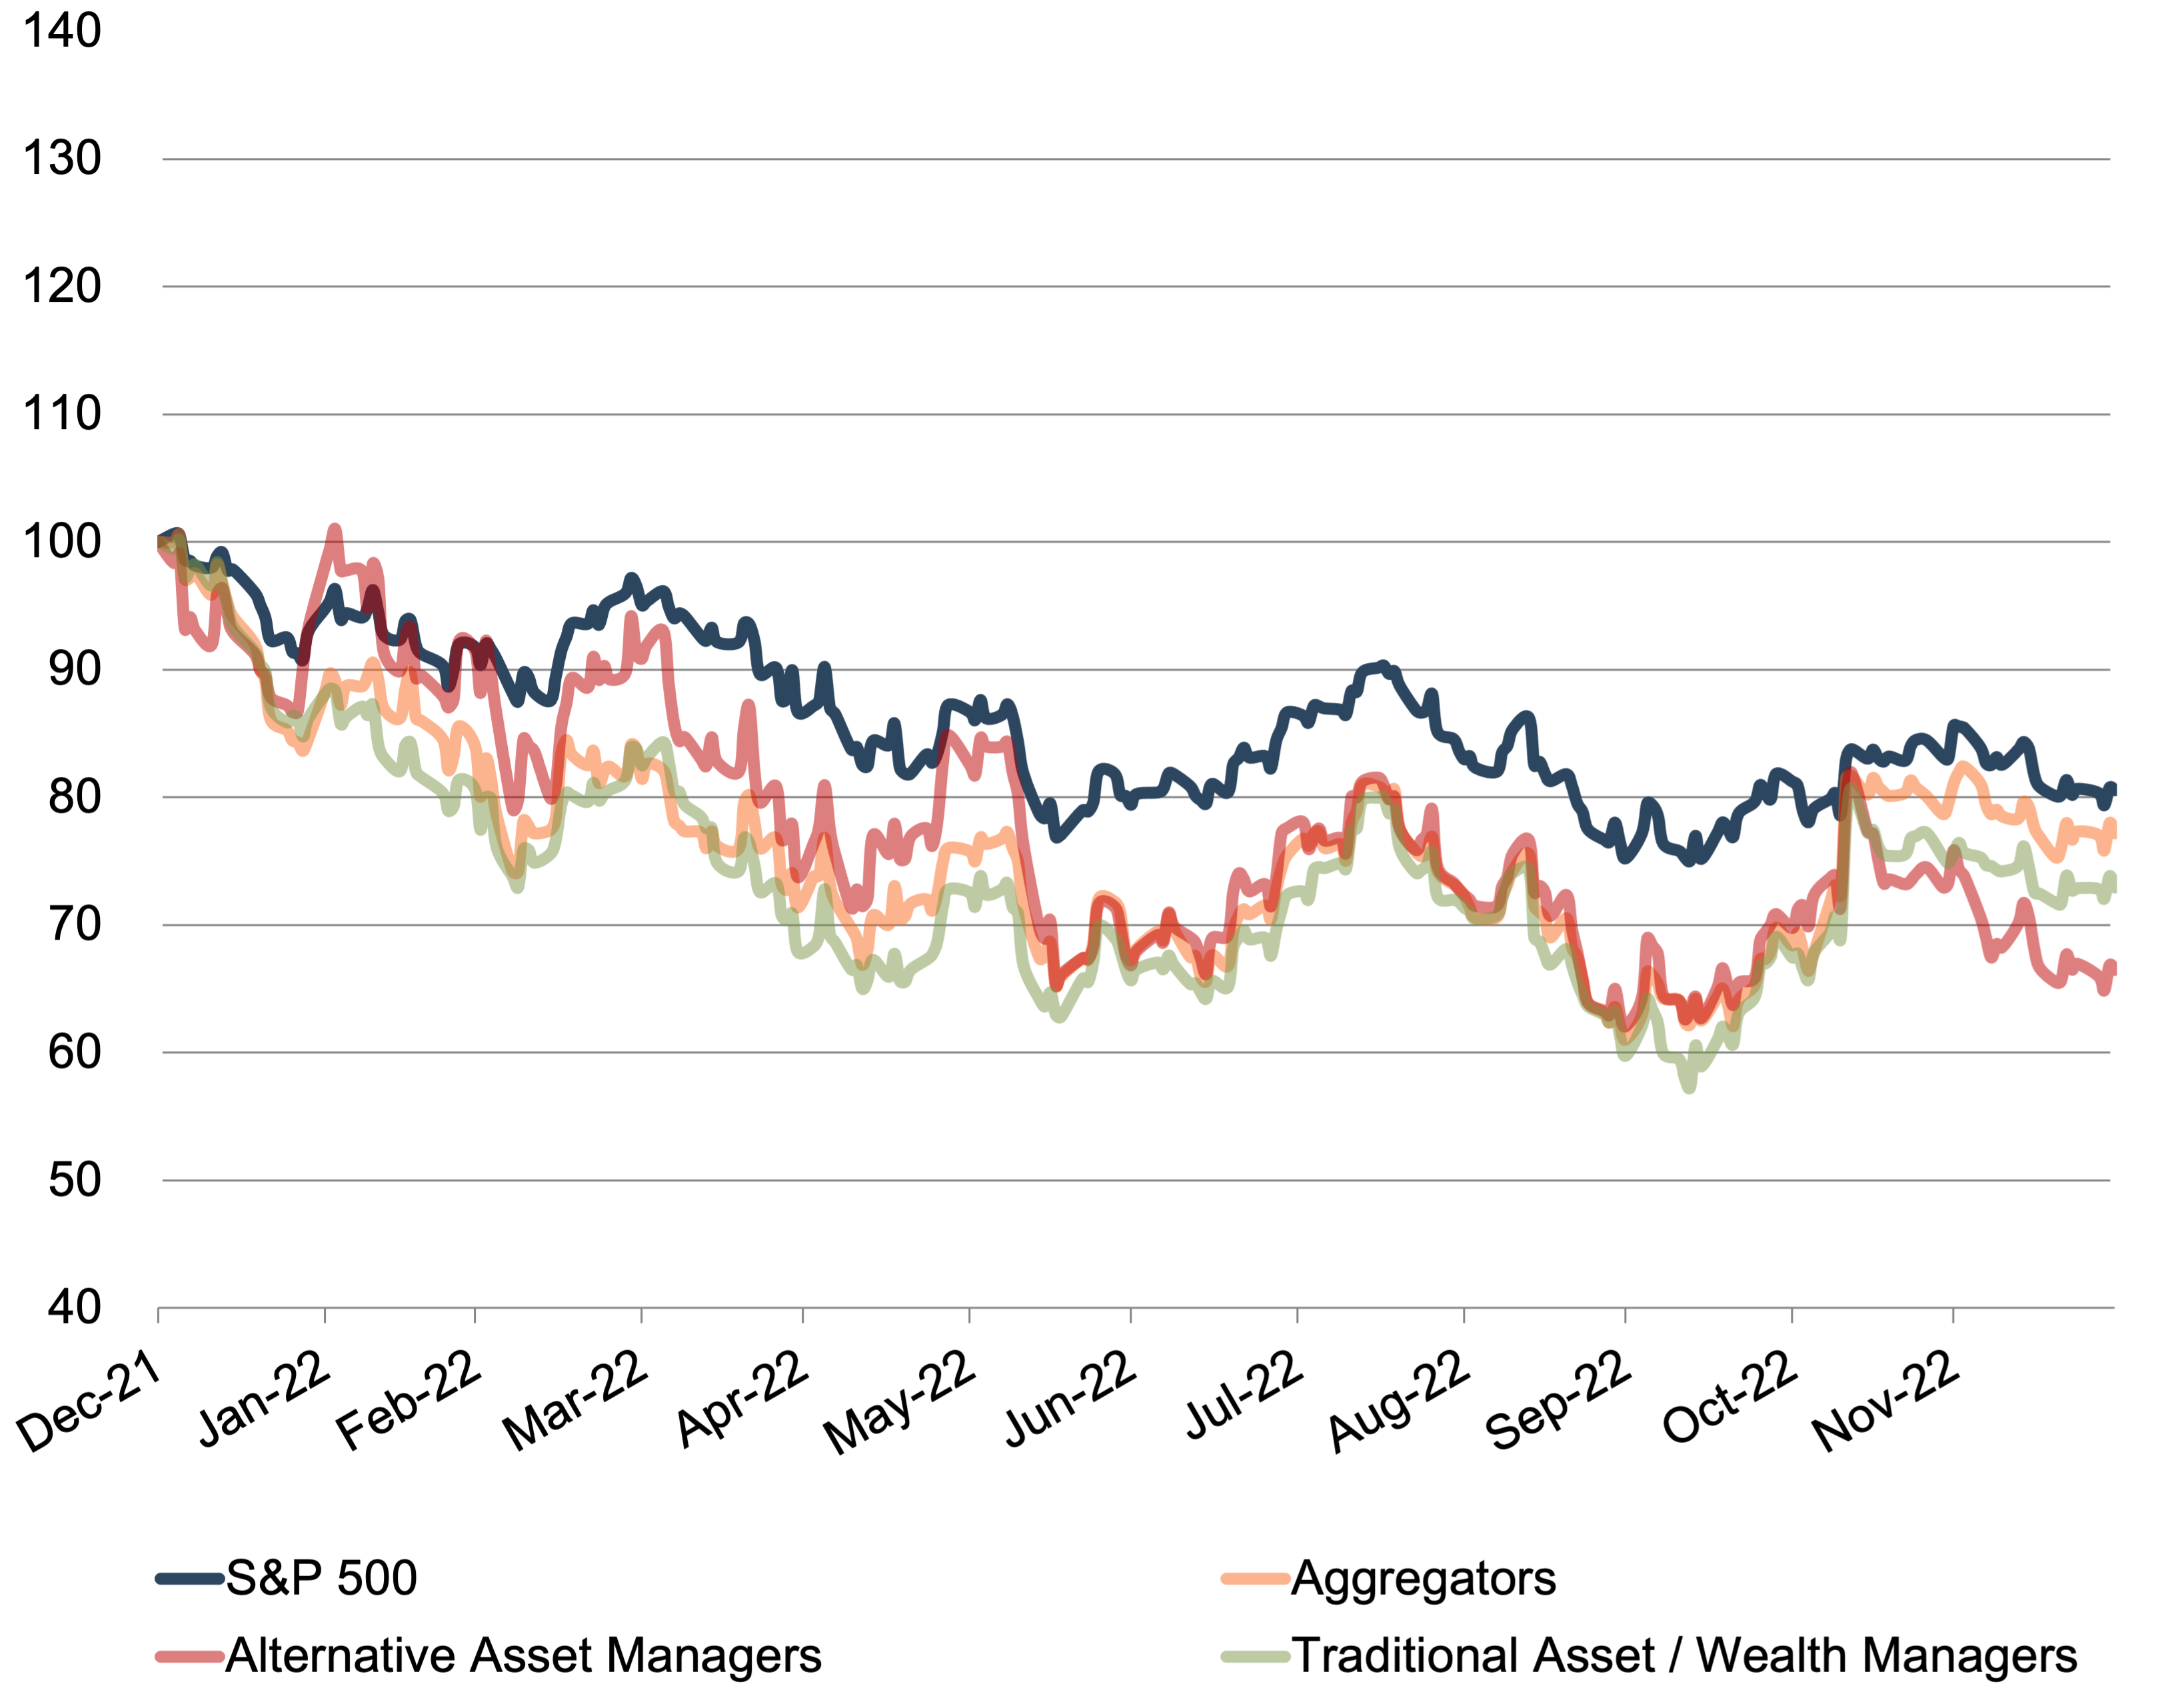
Source: S&P Market Intelligence
Performance by AUM
The largest asset managers saw the highest stock price growth in Q4, while smaller asset managers performed in line with the S&P. In our previous market update, we wrote that the smallest asset managers with AUM <$10 billion were the only group to outperform the S&P for the year. This was still true at year end. Due to the Q4 gains experienced by larger asset managers (those with AUM between $100 and $500 billion), this group went from severely underperforming the S&P for the year at the end of Q3 to slightly underperforming the S&P at year end.
Investment Manager Performance by AUM Size – Q4 2022
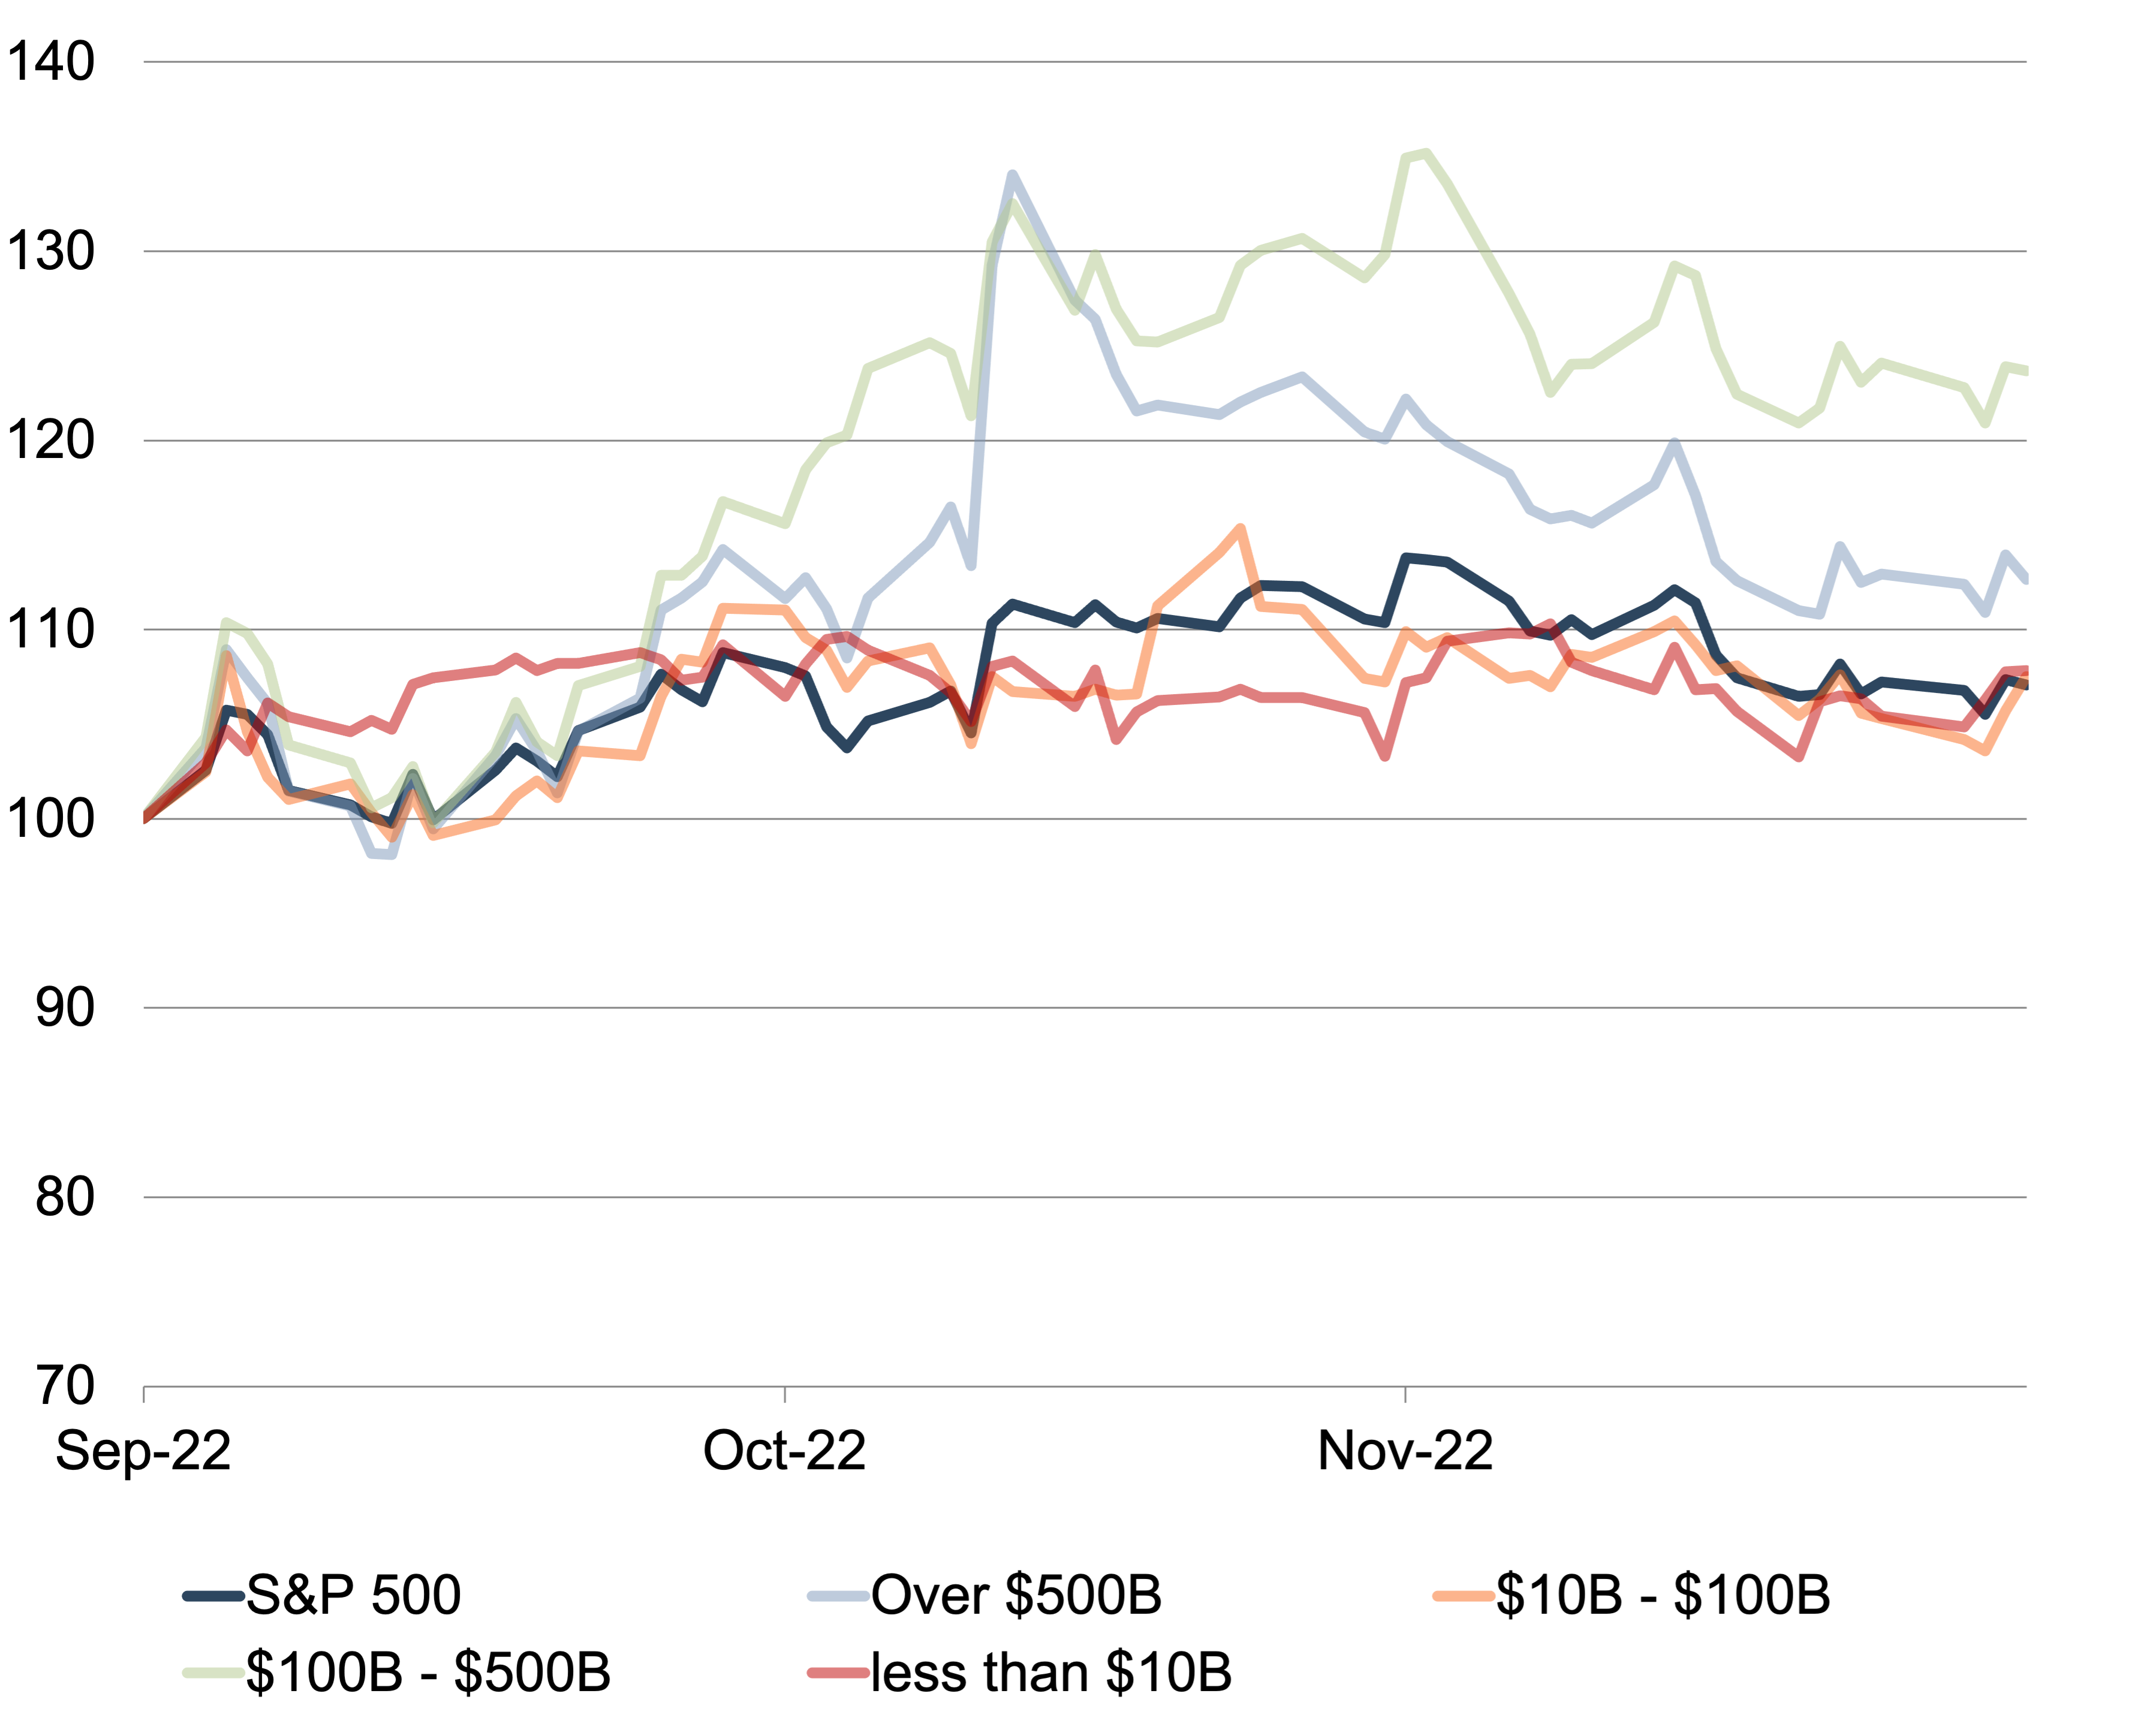
Source: S&P Market Intelligence
>>>
Investment Manager Performance by AUM Size – Year Ended December 31, 2022
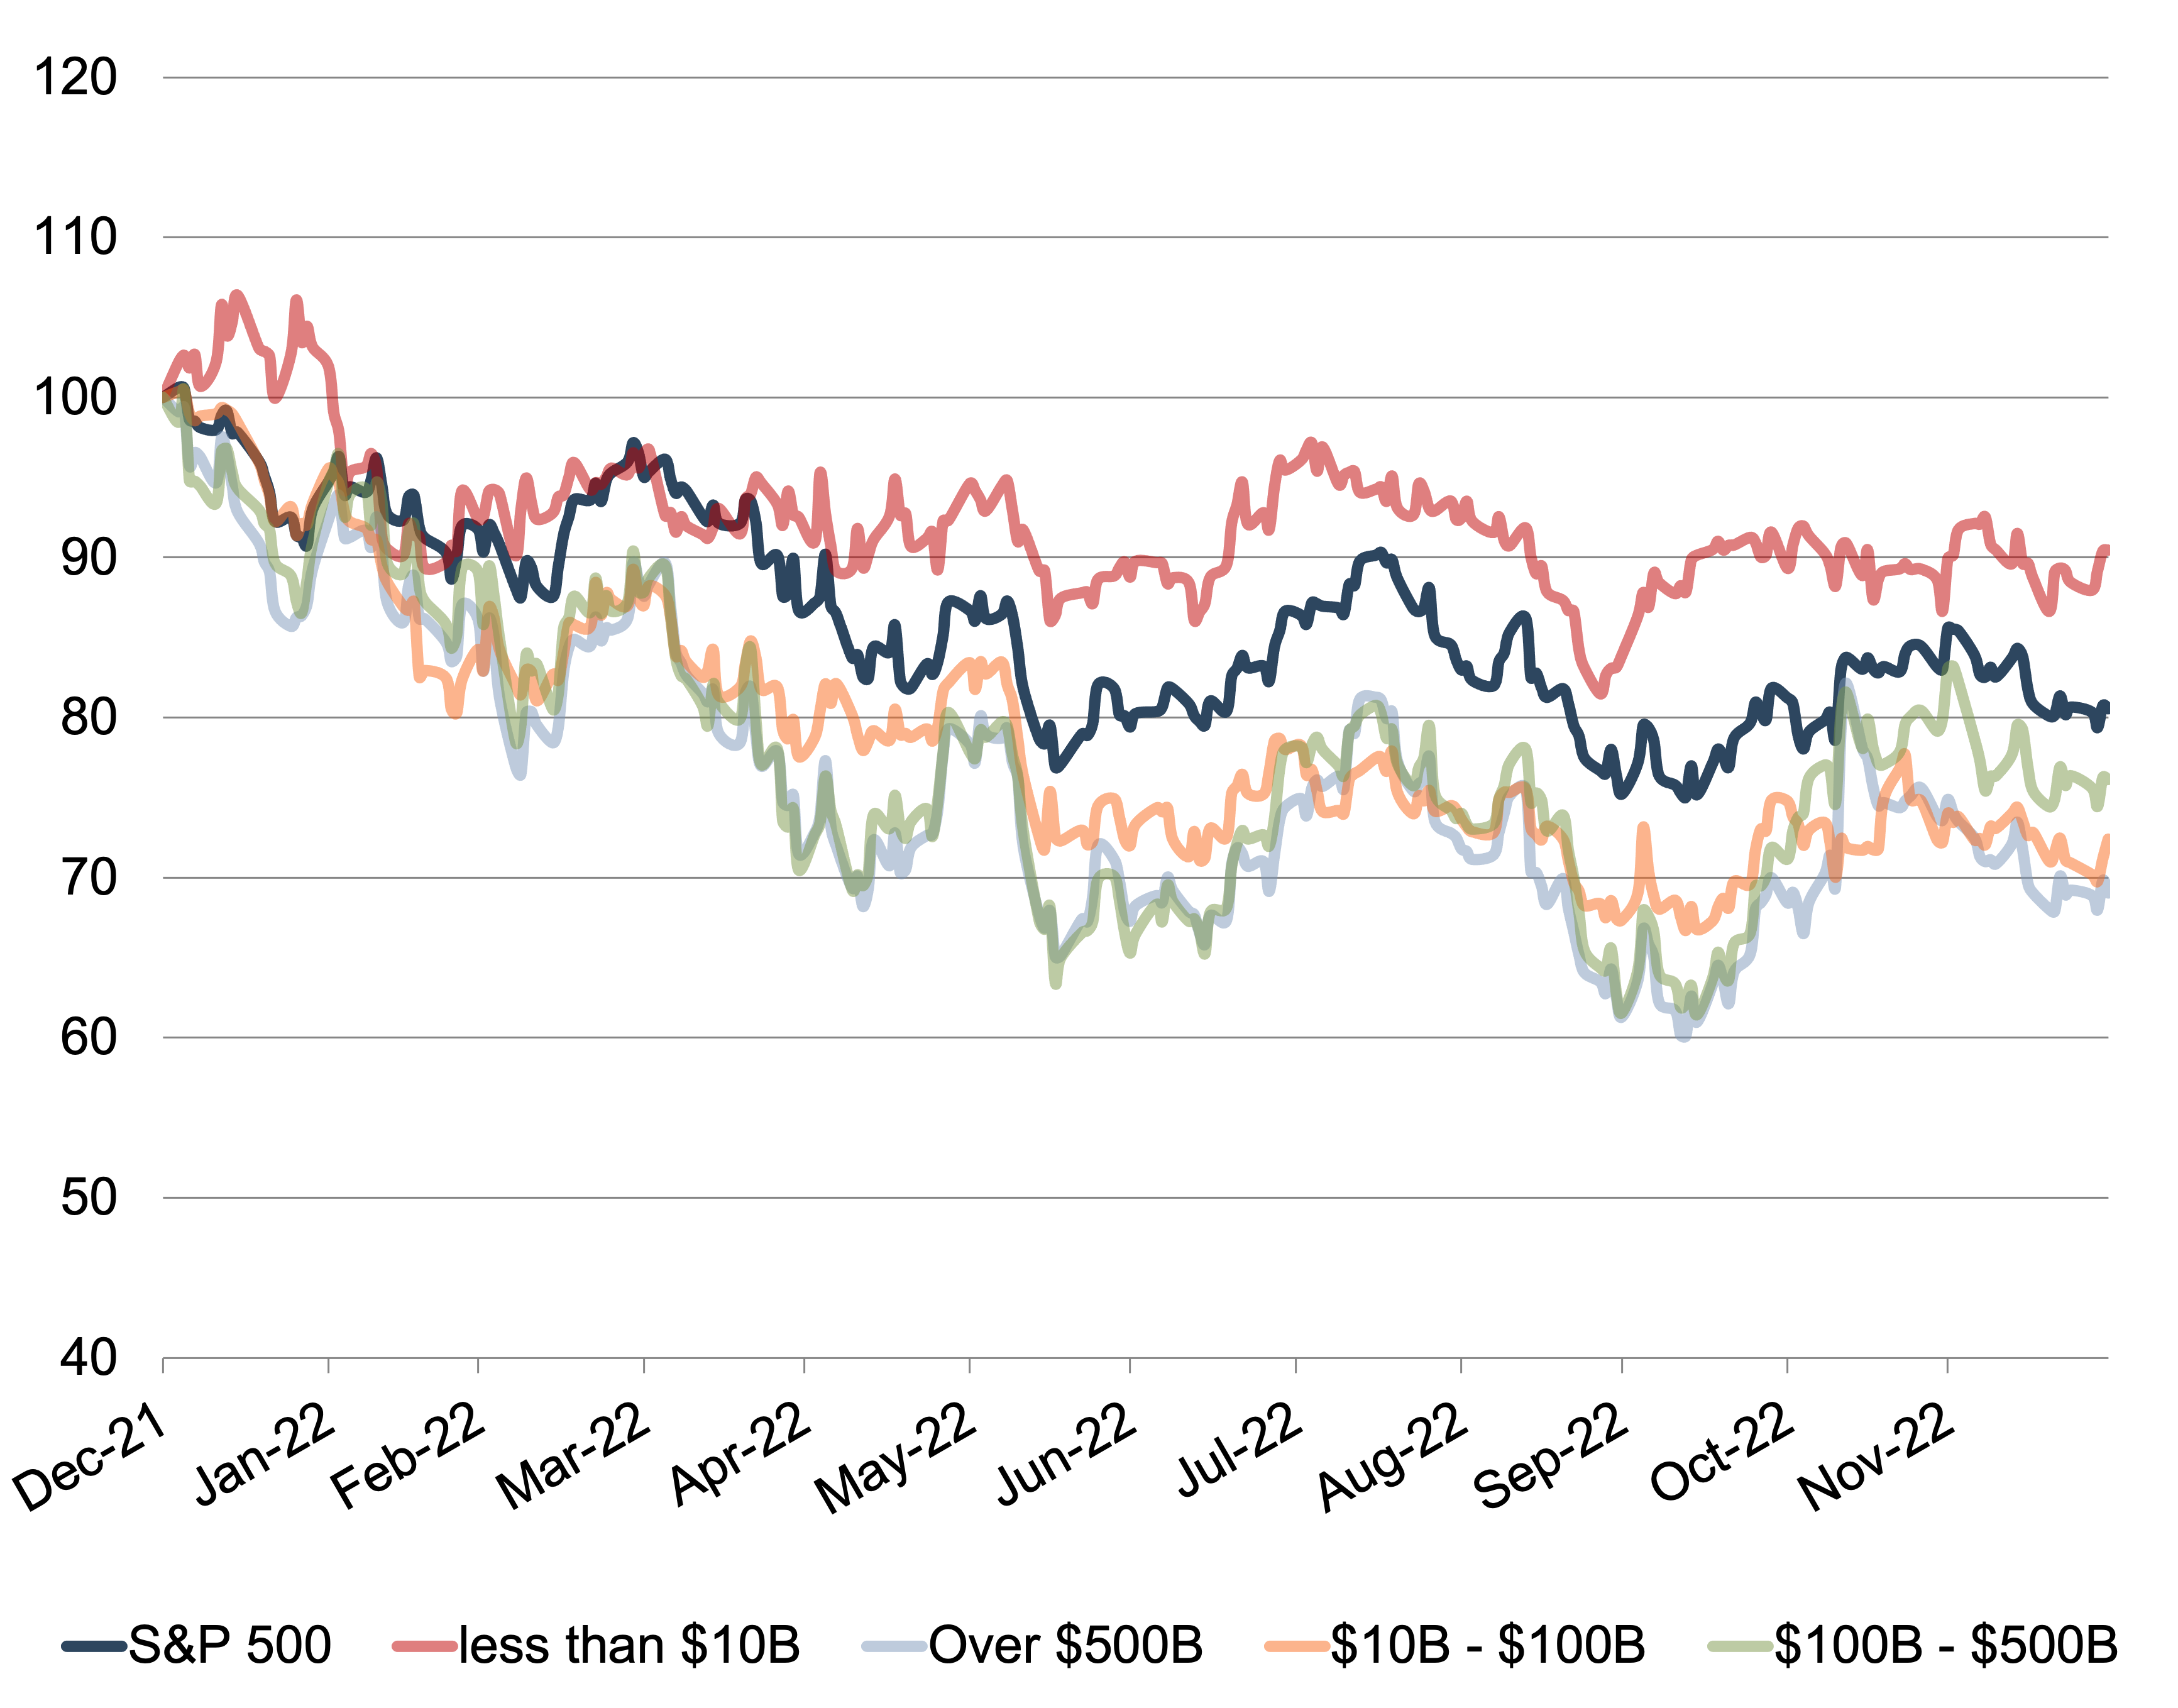
Source: S&P Market Intelligence
Multiple Arbitrage
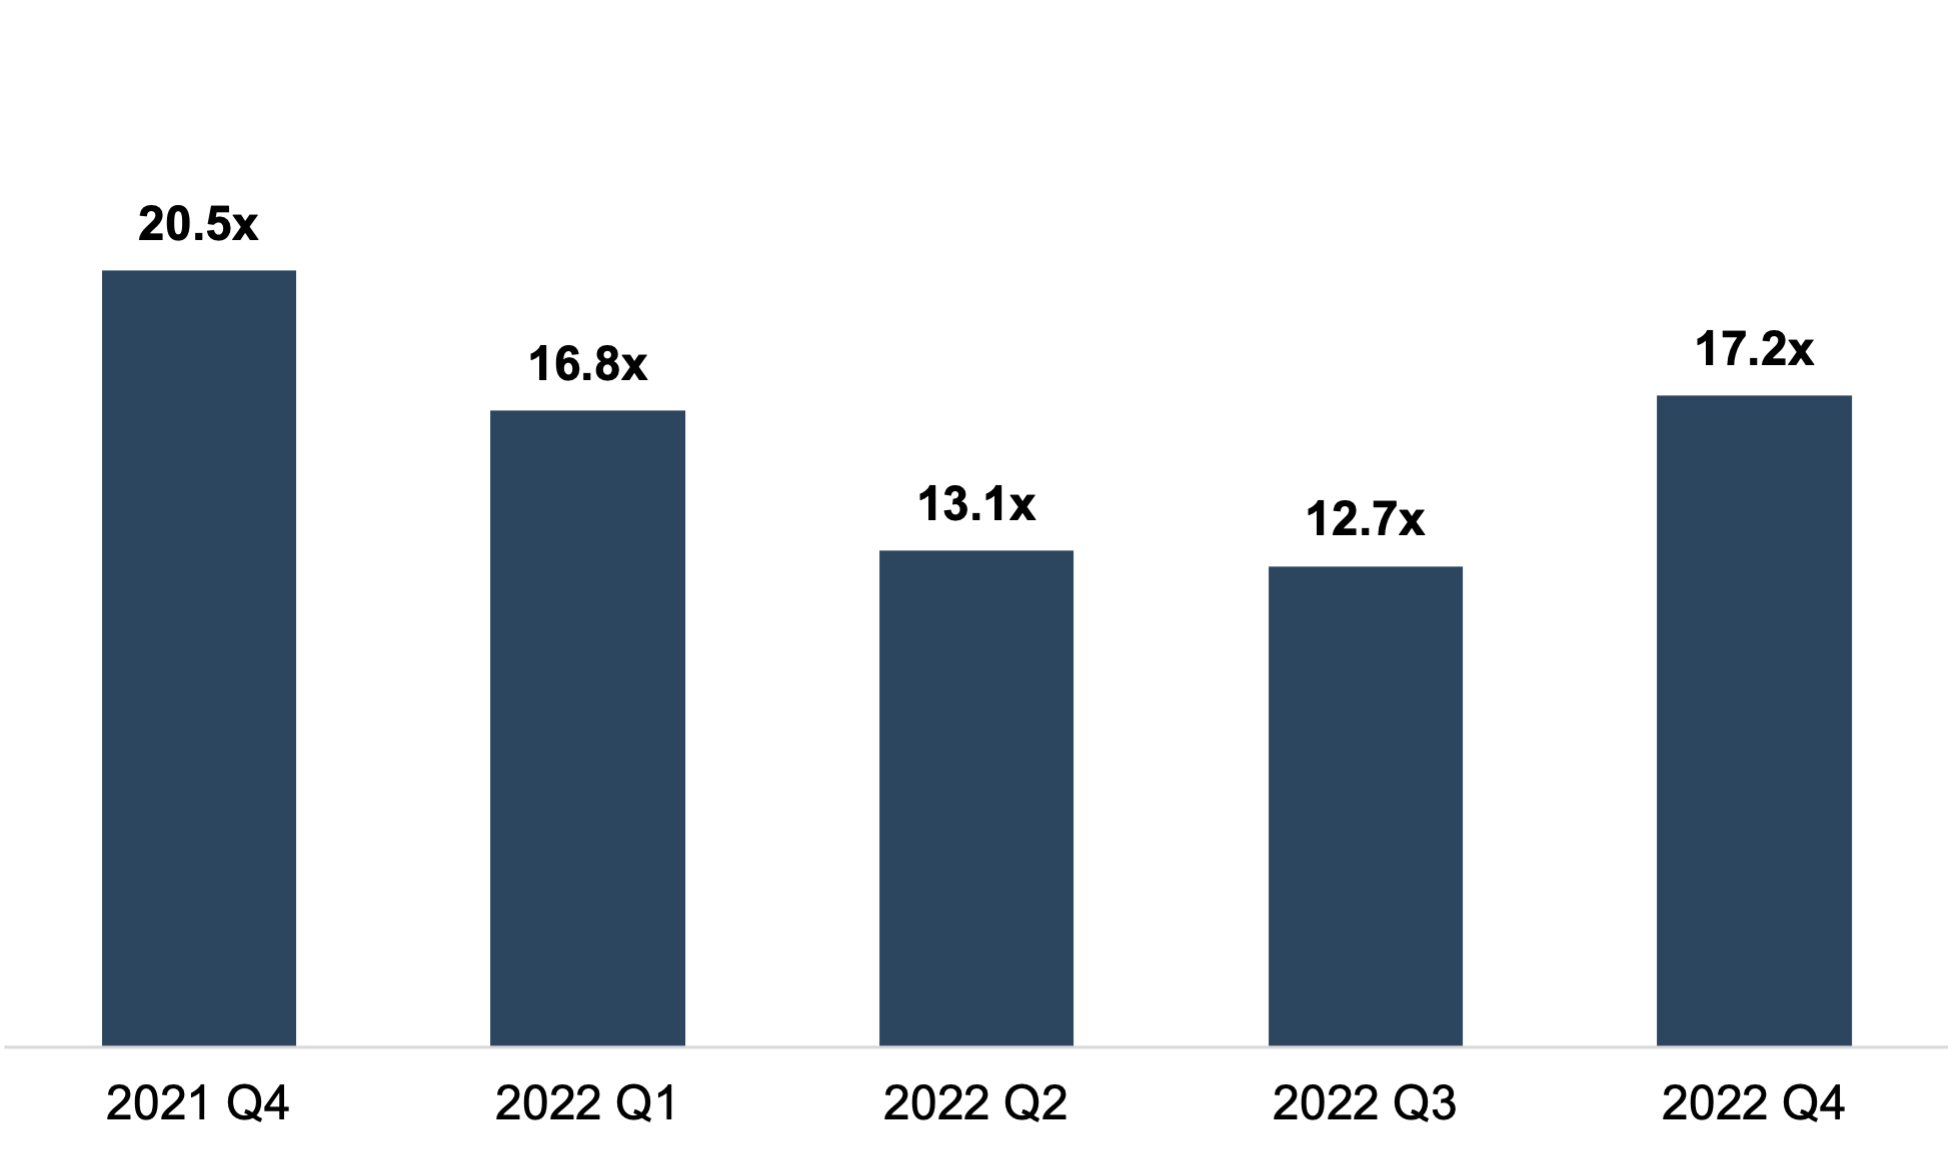
Public RIA LTM earnings multiples are up 35% from the end of Q3 to the end of Q4. After steadily increasing over the second half of 2020 and throughout 2021, LTM earnings multiples for publicly traded asset and wealth managers have dropped 16% this year, reflecting investor anticipation of lower revenue and earnings from the recent market decline and rising cost structure. See the price-to-LTM earnings ratio for Traditional Asset / Wealth Managers below.
Price-to-LTM EPS for Traditional Asset / Wealth Managers
Source: S&P Market Intelligence
Implications for Your RIA
The value of public asset and wealth managers provides some perspective on investor sentiment towards the asset class, but strict comparisons with closely held RIAs should be made with caution. Many smaller publics are focused on active asset management, which has been particularly vulnerable to headwinds such as fee pressure and asset outflows to passive products. Many sectors of closely-held RIAs, particularly wealth managers and larger public asset managers, have been less impacted by these trends and have seen more resilient multiples as a result. In the case of wealth management firms, strong demand from aggregators has also helped to bolster pricing in recent years.
In our previous market update in October, we described the increase in M&A activity and the decline in transaction multiples during Q3. M&A is often viewed as a lagging economic indicator since deals take several months or even quarters to complete. Later this month, we will report on Q4 M&A activity to keep you informed on changing market trends.