What Wealth Managers Need to Know About the Market Approach


The market approach is a general way of determining the value of a business which utilizes observed market multiples applied to the subject company’s performance metrics to determine an indication of value. The “market” in market approach can refer to either public or private markets, and in some cases the market for the subject company’s own stock if there have been prior arms’ length transactions. The idea behind the market approach is simple: similar assets should trade at similar multiples (the caveat being that determining what is similar is often not so simple). The market approach is often informative when determining the value of a wealth management firm.
There are generally three methods that fall under the market approach.
- Guideline Public Company Method
- Guideline Transaction Method
- Internal Transaction Method
All three methods under the market approach involve compiling multiples observed from either publicly traded guideline companies, comparable transactions in private companies, or prior transactions in the company’s own stock and applying the selected (and possibly adjusted) market multiples to the company’s performance measures.
Multiple Multiples
The most common multiples used when valuing wealth management firms are enterprise value (EV) to EBITDA1, EV to AUM, and EV to revenue multiples. The multiples used are generally categorized into “activity” multiples and “profitability” multiples. Activity multiples are multiples of AUM and revenue whereas profitability multiples are multiples of earnings metrics (e.g. EBITDA).
Both profitability and activity multiples have their advantages and disadvantages.
Both profitability and activity multiples have their advantages and disadvantages. Activity multiples can provide indications of value for a subject wealth management firm that are only a function of the chosen activity metric—typically AUM or revenue. Such an indication is not a function of the profitability of the firm, which can be an issue because the underlying profitability of a firm is the ultimate source of value, not revenue or AUM. The benefit of activity metrics is that they can be used without explicitly making normalizing adjustments to a wealth management firm’s profitability. The caveat, however, is that applying market-based AUM and revenue multiples to the subject wealth management firm’s activity metrics is essentially transposing the realized fee structures and EBITDA margins of the guideline companies onto the subject firm—an implicit assumption about normalized profitability and realized fees which may or may not be reasonable depending on the specific circumstances.
Profitability multiples, on the other hand, explicitly take into account the subject firm’s profitability, which on its face is a good thing. Profitability metrics are not without their drawbacks, however. Differences in risk or growth characteristics will, all else equal, result in different EBITDA multiples. If the risk or growth prospects of the subject company differ from the guideline companies that informed the selected EBITDA multiple, then the appropriate multiple for the subject company will likely differ from the observed market multiple.
Subject Company Measure
Once a market-based profitability multiple is obtained that reflects the risk and growth prospects of the subject firm, the next question is often: which EBITDA (or other profitability metric) is the multiple applied to? Reported EBITDA? Management adjusted EBITDA? Analyst adjusted EBITDA? Wealth management firms frequently require significant income statement adjustments—the largest of which is typically related to normalizing compensation—and so the answer to the question of which EBITDA to apply the multiple to can have a significant impact on the indicated value.
It’s often said that “value is earnings times a multiple.” While there is some truth to be had there, the simplicity of the statement belies the reality that the question of the appropriate multiple and the appropriate earnings is rarely straightforward, and buyers and sellers may have very different opinions on the answer.
Guideline Public Company Method
The guideline public company method is a method under the market approach that uses multiples obtained from publicly traded companies to inform the value of a subject company. For wealth managers, the universe of publicly traded firms is relatively small – there are only about two dozen such firms in the U.S.
The chart below shows historical EV / LTM EBITDA multiples for publicly traded RIAs with less than $100 billion in AUM (the size range which most of our clients fall in). As can be seen, the public companies have generally traded in a band of 8-11x LTM EBITDA, although the pricing at the end of 2018 had fallen to a historically low multiple of just over 5 times, partly due to increased market volatility observed at year-end.
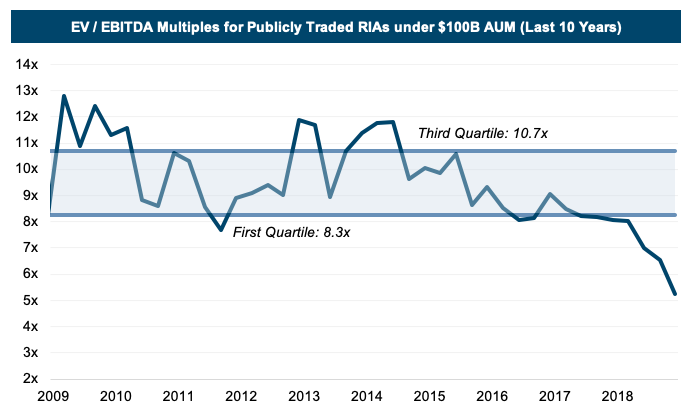
When valuing small, privately held wealth management firms, the use of multiples from publicly traded companies—even the smallest of which is still quite large compared to most privately held RIAs—naturally brings up questions of comparability. How comparable is a wealth management firm with, say, $1-10 billion in AUM and a few dozen employees to BlackRock, which manages over $6 trillion? The answer is probably not very.
The comparison of the small, privately held RIA to BlackRock is obviously extreme, but it illustrates the issues of comparability that are frequently present when using publicly traded companies to value privately held wealth management firms. In our experience, the issues of comparability between small, privately held companies and publicly traded companies are frequently driven by key person risk/lack of management depth, smaller scale, and less product and client diversification. These differences point towards greater risk for privately held RIAs versus the publicly traded companies, which, all else equal, suggests that the privately held RIAs should trade at a lower multiple to that observed in the public markets.
The growth prospects for privately held RIAs can differ from publicly traded companies as well. Because small, privately-held RIAs tend to be focused on a single niche, the growth prospects tend to be more extreme, either positive or negative, compared to publicly traded guideline companies. A subject company’s singular niche may be growing quickly or shrinking, whereas the diversified product offerings of publicly traded companies are likely to have some segments that are growing and some that are shrinking, resulting in a moderated overall growth outlook. The growth prospects, of course, impact the multiple at which the subject company should trade. In some cases, we’ve seen RIAs much smaller than the guideline public companies transact at a premium to the then-prevailing observed public company multiples because of the RIA’s attractive growth prospects. More often, however, the higher risk of the privately held RIA dominates, and the justified multiple is lower than the guideline public company multiples. As a general rule, a smaller RIA means a smaller multiple.
Despite the less than perfect comparability between publicly traded companies and most privately held RIAs, publicly traded companies provide a useful indication of investor sentiment for the asset class and thus should be given at least some consideration. However, due to differences in risk and growth characteristics, adjustments to the multiples observed in the guideline companies may need to be made.
Guideline Transactions Method
Guideline transactions of private companies in the wealth management space provide additional perspective on current market pricing of RIAs. The guideline transactions method uses these multiples to derive an indication of value for a subject firm.
The transaction data is appealing because the issues of comparability are generally less pronounced than with the guideline public companies. There are caveats to the guideline transactions method, however. One unique consideration for the use of the guideline transactions method in the wealth management industry is that deals in the industry almost always include some form of (often substantial) contingent consideration (earn-out). The structure of such contingent consideration will be tailored to each deal based on the specific concerns and negotiations of the buyers and sellers. In any event, the details of the earn-out payments are often not publicly available. The lack of available information on deal terms can make it difficult to determine the actual value of the consideration paid, which translates into uncertainty in the guideline transaction multiples.
The lack of available information on deal terms can make it difficult to determine the actual value of the consideration paid, which translates into uncertainty in the guideline transaction multiples.
Another important consideration is that deals in the industry occur for unique reasons and often involve unique synergies. It’s not always reported what these are, and the specific factors that motivated a particular guideline transaction may not be relevant for the subject company. The type of buyer in a guideline transaction is another consideration. Private equity (financial buyers) will have different motivations and will be willing to pay a different multiple than strategic buyers.
Despite an uptick in sector deal activity over the last several years, there are still relatively few reported transactions that have enough disclosed detail to provide useful guideline transactions multiples. Looking at older transactions increases sample size, but it also adds transactions that occurred under different market conditions, corporate tax environments, and the like. Stale transaction data may not be relevant in today’s market.
Internal Transaction Method
The internal transactions method is a market approach that develops an indication of value based upon consideration of actual transactions in the stock of a subject company. Transactions are reviewed to determine if they have occurred at arms’ length, with a reasonable degree of frequency, and within a reasonable period of time relative to the valuation date. Inferences about current value can sometimes be drawn, even if there is only a limited market for the shares and relatively few transactions occur.
However, even arms’ length transactions in the subject company stock occur for unique reasons and often involve unique synergies which means even these implied multiples are not always a clear indicator of value.
Rules of Thumb: Where They Come From and Why They (Sometimes) Make No Sense
Observed market multiples are often condensed into “rules of thumb,” or general principals about what an investment firm is or should be worth. These rules provide a simple, back-of-the-envelope way of quickly computing an indicated value of a wealth management firm. However, rules of thumb are not one-size-fits-all. Consider the example below, which shows a “2% of AUM” rule of thumb applied to two firms, A and B:
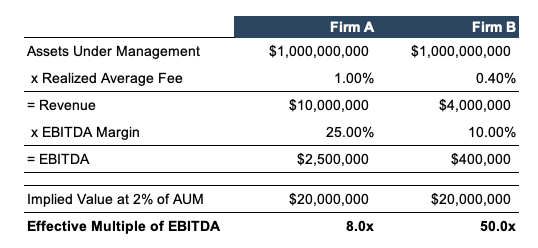
Both Firm A and Firm B have the same AUM. However, Firm A has a higher realized fee than Firm B (100 bps vs 40 bps) and also operates more efficiently (25% EBITDA margin vs 10% EBITDA margin). The result is that Firm A generates $2.5 million in EBITDA versus Firm B’s $400 thousand despite both firms having the same AUM. The “2% of AUM” rule of thumb implies an EBITDA multiple of 8.0x for Firm A—a multiple that may or may not be reasonable for Firm A given current market conditions and Firm A’s risk and growth profile, but which is nevertheless within the historical range of what might be considered reasonable. The same “2% of AUM” rule of thumb applied to Firm B implies an EBITDA multiple of 50.0x—a multiple which is unlikely to be considered reasonable in any market conditions.
We’ve seen rules of thumb like the one above appear in buy/sell agreements and operating agreements as methods for determining the price for future transactions among shareholders or between shareholders and the company. The issue, of course, is that rules of thumb—even if they made perfect sense at the time the document was drafted—do not have a long shelf life. A lot can change that can make a once sensible rule of thumb seem outlandish due to changes at the firm itself or in the broader market for wealth management firms.
Reconciliation of Value
The market approach provides useful information about the current market conditions and investor sentiment for wealth management firms, but the method also has limitations and important considerations that need to be made, many of which are specific to the wealth management industry. Any valuation is as of a specific date and should reflect the market and universe of alternative investments as of that valuation date—which ultimately is what market approach indications of value are informed by. On the other hand, the fundamentals of a subject company may suggest a valuation that differs from market-based indications. Whatever the concluded value—it should make sense in light of both the current market conditions and indications of value developed under the income approach.
1 Wealth management firms tend to have little “DA”, so EBITDA is typically approximately equal to EBIT and operating income.