In our annual update of core deposit trends published a year ago, we described an increasing trend in core deposit intangible asset values in light of rising interest rates. At the time several more short-term rate hikes by the Fed were expected during 2018 and 2019. However, the equity and high yield credit markets disagreed as both fell sharply during the fourth quarter in anticipation of the December rate hike that the Fed later implemented.
A year later the Fed has cut three times in 2019 and thereby erased three of the four hikes it implemented in 2018. As 2019 unfolded, intermediate- and long-term U.S. Treasury rates declined from what appears to be cycle highs reached in November 2018 through August 2019. As a result, the U.S. Treasury curve inverted with short-rates that are closely tied to the Fed’s policy rates exceeding intermediate- and long-term rates. By late August 3-month bills yielded about 50bps more than the 10-year bond. Also, the spread between 10-year and 2-year Treasuries, commonly cited as an indicator of impending recessions when negative, was nominally negative. During October intermediate- and long-term rates rose modestly in anticipation of the third Fed rate cut supporting economic growth and thereby flattened the curve.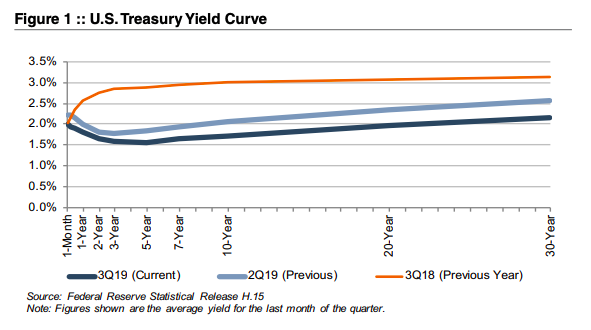
Alongside these fluctuations in the interest rate environment, the banking industry has seen increasing competition for deposits in recent years. Improved loan demand in the post-recession period has led to greater funding needs, while competition from traditional banking channels has been compounded by the increased prevalence of online deposit products, often offering higher rates. All of these trends have combined to make strong core deposit bases increasingly valuable in bank acquisitions in the post-recession years. One question to ponder, however, is how much the value attributable to core deposits may ease given the reduction in rates that has occurred recently.
Using data compiled by S&P Global Market Intelligence, we analyzed trends in core deposit intangible (CDI) assets recorded in whole bank acquisitions completed from 2000 through September 2019. CDI values represent the value of the depository customer relationships obtained in a bank acquisition. CDI values are driven by many factors, including the “stickiness” of a customer base, the types of deposit accounts assumed, and the cost of the acquired deposit base compared to alternative sources of funding.
For our analysis of industry trends in CDI values, we relied on S&P Global Market Intelligence’s definition of core deposits.1 In analyzing core deposit intangible assets for individual acquisitions, however, a more detailed analysis of the deposit base would consider the relative stability of various account types. In general, CDI assets derive most of their value from lower-cost demand deposit accounts, while often significantly less (if not zero) value is ascribed to more rate-sensitive time deposits and public funds, or to non-retail funding sources such as listing service or brokered deposits which are excluded from core deposits when determining the value of a CDI.
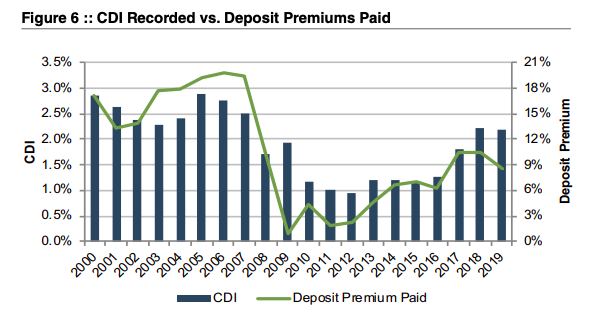
Figure 2 summarizes the trend in CDI values since the start of the 2008 recession, compared with rates on 5-year FHLB advances. Over the post-recession period, CDI values have largely followed the general trend in interest rates. As alternative funding became more costly during 2017 and 2018, CDI values generally ticked up as well, relative to post-recession average levels. During 2019, the trend reversed as CDI values have exhibited a declining trend in light of yield curve inversion and Fed rate cuts at its last three meetings.
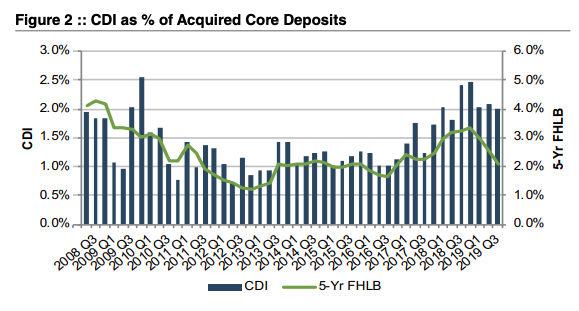
This decline in CDI values has been somewhat slower than the drop in benchmark interest rates, however, in part because deposit costs typically lag broader movements in market interest rates. In general, banks were slow to raise deposit rates in the period of contractionary monetary policy through 2018 and, as a result, rates remain below benchmark levels leaving banks less room to reduce rates further. For CDs, the lagging trend is even more pronounced given their nature as time deposits. Many banks attempted to “lock-in” rates by increasing reliance on CDs when expectations were for continued rate increases as late as year-end 2018. Now that rates are on the decline, banks have been stuck with CDs that cannot be repriced until their maturities even as benchmark rates fall. While time deposits typically are not considered “core deposits” in an acquisition and thus would not directly influence CDI values, they do significantly influence a bank’s overall cost of funds, and while funding costs remain high a strong core deposit base remains a valuable asset to acquirers.

Even as CDI assets remain above post-recession average levels at approximately 2.0- 2.5%, they are still below long-term historical levels which averaged closer to 2.5-3.0% in the early 2000s.
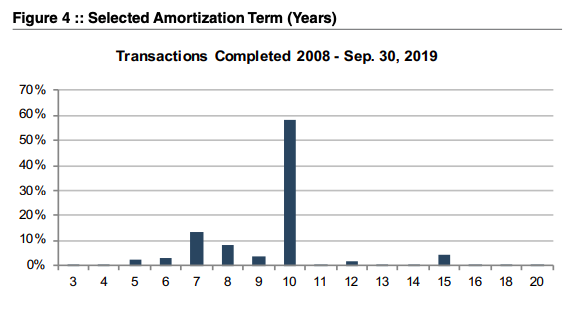
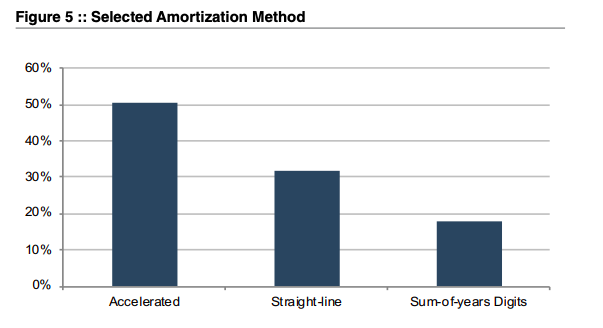
Based on the data for acquisitions for which core deposit intangible detail was reported, a majority of banks selected a ten-year amortization term for the CDI values booked. Less than 10% of transactions for which data was available selected amortization terms longer than ten years. Amortization methods were somewhat more varied, but an accelerated amortization method was selected in more than half of these transactions.
Core deposit intangible assets are related to, but not identical to, deposit premiums paid in acquisitions. While CDI assets are an intangible asset recorded in acquisitions to capture the value of the customer relationships the deposits represent, deposit premiums paid are a function of the purchase price of an acquisition. Deposit premiums in whole bank acquisitions are computed based on the excess of the purchase price over the target’s tangible book value, as a percentage of the core deposit base. While deposit premiums often capture the value to the acquirer of assuming the established funding source of the core deposit base (that is, the value of the deposit franchise), the purchase price also reflects factors unrelated to the deposit base, such as asset quality in the acquired loan base, unique synergy opportunities anticipated by the acquirer, etc. Any additional factors may influence the purchase price to an extent that the calculated deposit premium doesn’t necessarily bear a strong relationship to the value of the core deposit base to the acquirer. This influence is often less relevant in branch transactions where the deposit base is the primary driver of the transaction and the relationship between the purchase and the deposit base is more direct.
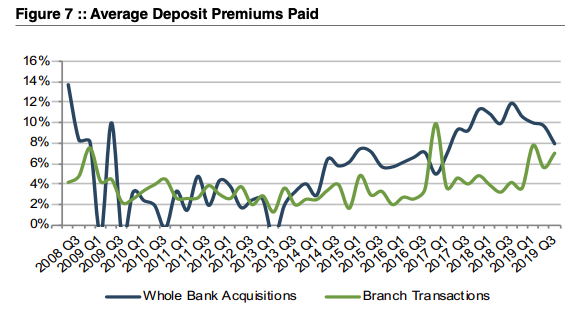
Deposit premiums paid in whole bank acquisitions have shown more volatility than CDI values. Despite improved deal values in recent years, current deposit premiums in the high single digits remain well below the pre-financial crisis levels when premiums for whole bank acquisitions averaged closer to 20%.
Deposit premiums paid in branch transactions have generally been less volatile than tangible book value premiums paid in whole bank acquisitions. Branch transaction deposit premiums have averaged in the 5.5%-7.5% range during 2019, up from the 2.0-4.0% range observed in the financial crisis, and have continued to rise in recent quarters in light of increasing deposit competition.
For more information about Mercer Capital’s core deposit valuation services, please contact us.
Originally published in Bank Watch, October 2019.


