Permian Production Growth Stands Alone


The economics of Oil & Gas production vary by region. Mercer Capital focuses on trends in the Permian, Eagle Ford, Haynesville, and Marcellus and Utica plays. The cost of producing oil and gas depends on the geological makeup of the reserve, the depth of the reserve, and the cost of transporting the raw crude to market. We can observe different costs in different regions depending on these factors. In this post, we take a closer look at the Permian.
Production and Activity Levels
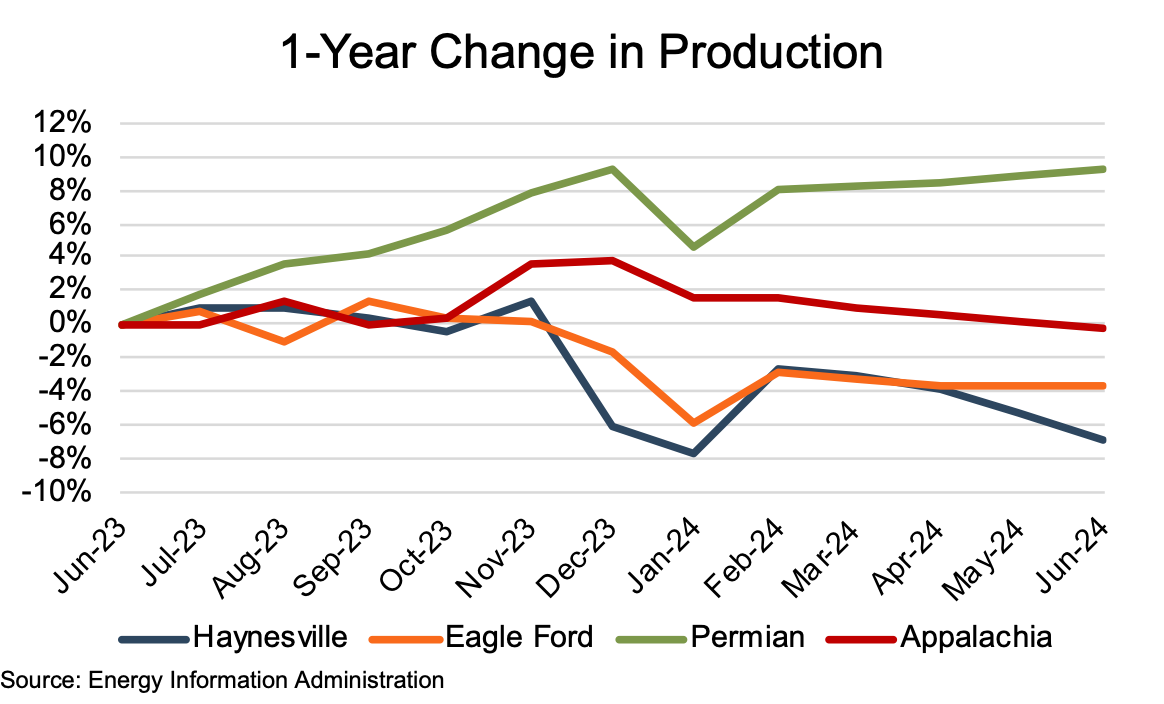
Permian production (on a barrels of oil equivalent, or “boe” basis) climbed 9.2% year-over-year (YoY) through May. Production in the US’s most prolific basin had climbed steadily since mid-2023, reaching 10.4 mboe/d in December 2023 before dipping to 10.0 mboe/d in January. Production recovered over the next five months, returning to 10.4 mboe/d in May. None of the other three basins posted a YoY production increase, although Appalachia’s June 2024 production was only 0.3% shy of the prior year level. Eagle Ford and Haynesville posted YoY declines of 3.7% and 6.8%, respectively.
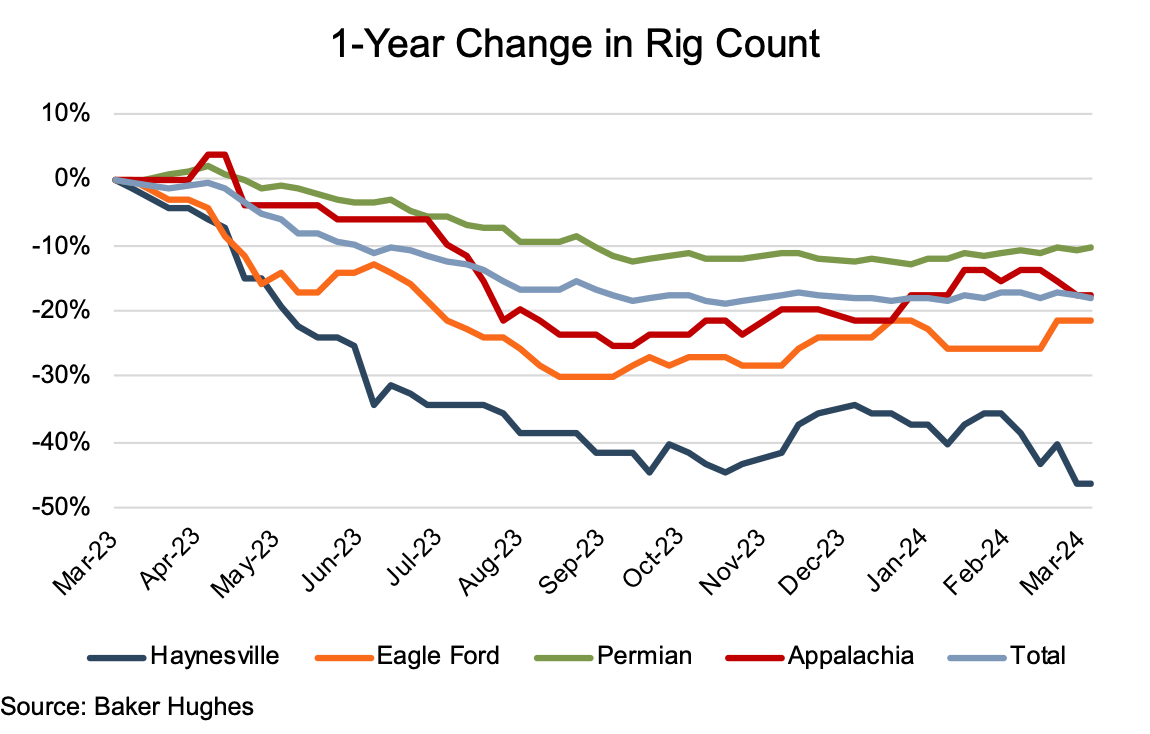
Rig counts fell across the board over the year ending March 2024. Starting with 758 rigs across the four basins, the total declined in 26 out of the 33 weekly reporting periods through early November 2023, reaching 616. Thereafter, the four-basin rig count held steady between 618 and 629, ending the review period at 621. The Permian and Appalachian basins posted early period rig count increases that peaked at 1% and 4%, respectively, in early May 2023 – only 6-weeks into the review period. Those basins ended the review period with YoY rig count reductions of 10% (Permian) and 18% (Appalachia). The Permian’s decline was largely steady through mid-January 2024, after which it reversed course to a steady increase through the remainder of the review period.
The other three basins were not nearly as resilient as the Permian, posting rapid rig count declines during the review period: Appalachia with a 21% mid-July to September drop, and Eagle Ford with a slightly more gradual 20% decline from late June to early September. The rig count decline for Haynesville, while stretching over a longer period of time – late March to mid-October, marked a whopping 45% reduction. Eagle Ford’s YoY decline came in close to Appalachia’s at 21%, having posted fairly regular rig count increases over the latter half of the review period. Haynesville posted a modest comeback during the last two months of 2023 but generally declined again in Q1 2024, ending the review period with a 46% decline.
Commodity Prices Edge Upward
Oil prices rose 11% (WTI) and 9% (Brent) over the review period, generally rising from June to September 2023 and mid-December to early March 2024. Period highs of $90.79 (WTI) and $92.20 (Brent) were reached in late September, with a second peak in early April at $85.44 (WTI) and $90.48 (Brent). According to Reuters, the summer 2023 price run-up resulted in anticipation of tighter supplies weighing more heavily than worries concerning weaker economic growth and rising U.S. crude inventories. The International Energy Agency (IEA) noted that Saudi Arabia and Russia’s protracted oil production cuts were expected to result in a market deficit through the fourth quarter.
Oil prices generally declined during Q4 2023, reaching a review period low of $68.85/WTI and $73.24/Brent in mid-December. The late 2023 run marked the first time in over five years that oil prices declined for seven straight weeks. Of the decline, CNN’s Before The Bell (BTB) noted that the extended decline came as analysts worried about increased production around the globe and seemingly cast-off concerns regarding OPEC’s promises to limit supply by cutting oil output by 2.2 million barrels per day through the first quarter of 2024. Oil markets seemed to think that not all OPEC members would adhere to the promised production cut. BTB also noted that the markets were concerned over an expected decline in demand, particularly in China, where there were continued signs of a slowing economy.
WTI and Brent prices moved upward from late December 2023 to early April 2024, reaching the second peak. Regarding the early 2024 price recovery, the IEA attributed the price increase to the higher-than-expected 1.7 mb/d global oil demand and reduced Q1 production due to heavy weather-related shut-ins and new production curbs announced by the OPEC+ bloc.
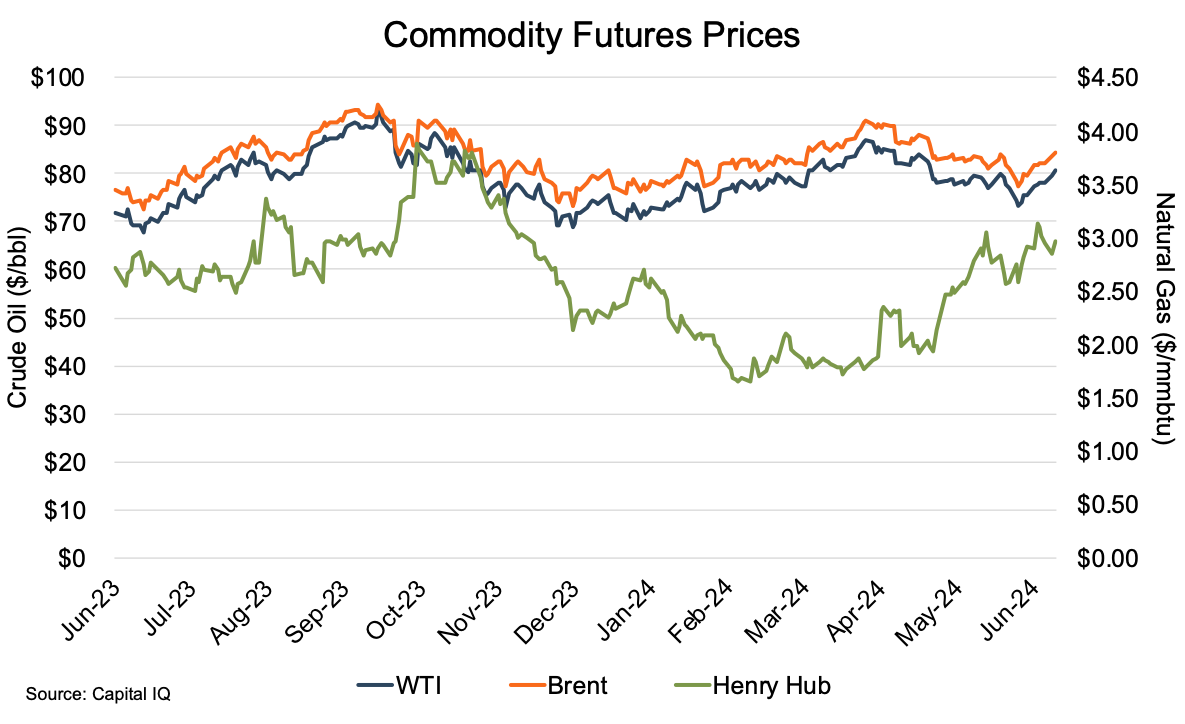
Gas prices also posted a YoY increase, albeit a more modest 5% improvement from $2.72 mmbtu to $2.85. While showing its traditionally higher volatility compared to oil prices – high/low of $3.88/$1.65 compared to $90.79/$68.85 (WTI) and $92.20/$73.24 (Brent) – the Henry Hub tended to move in the same general direction as oil prices over the first half of the review period, while generally moving opposite of oil prices during portions of the second half. Gas prices reached the review period high just weeks following WTI, and Brent hit their review period high in late September after a 20-day Henry Hub run from $2.84 to $3.88. The increase was attributed to unusually low temperatures across much of the U.S., pushing residential and commercial consumption up 51% in early October. Gas prices subsequently fell to the review period low ($1.65) in mid-February, marking a 57% drop, partly due to excess supply. While gas producers have intentionally cut drilling and production in the face of inflation-adjusted 30-year low prices, gas production from oil producers that produce gas as a byproduct of their oil production operations continued to buoy supplies.
The Biden Administration’s “temporary pause” in LNG export project approvals in late January, widely viewed as politically motivated, precipitated the last leg of the price slide from $2.18 at the time of the pause’s announcement to the review period low of $1.65 just 20 days later. Since the Biden LNG Pause induced lows, gas prices generally increased over the remainder of the review period, largely on expectations for warming temperatures, spurring increased cooling demand.
Financial Performance
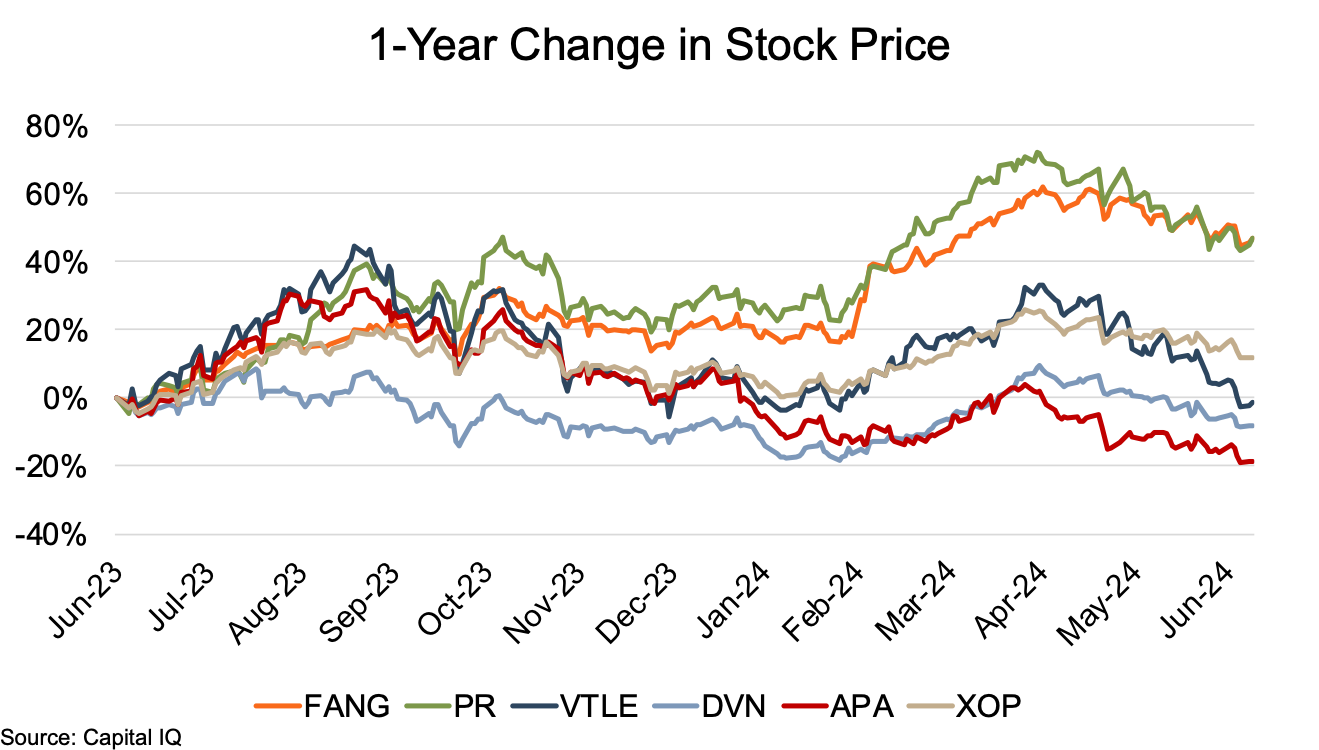
The Permian public comp group showed a distinct split in stock price performance over the year ending June 18, with Diamond Back (FANG) and Permian Resources (PR) posting significant increases, while Vital (VTLE), Devon Energy (DVN), and APA Corp. (APA) posted much lower increases, or a marginal decline. FANG and PR followed similar paths over the review period, although PR’s stock price showed significantly greater volatility than FANG in the first half of the period. Both ended the period with YoY increases of 47%. Other than a late 2023 price run-up and subsequent decline, VTLE’s stock performance tended to run in line with XOP. VTLE ended the period with a 1% decline, while XOP posted a 12% increase. DVN and APA experienced stock price declines of 8% and 19%, respectively. Devon has struggled to increase its scale after losing out on recent acquisition opportunities amid higher drilling and production costs. APA’s stock price suffered even more amid challenges as it reshuffled its management team and operational structure of an existing asset base that included significant foreign reserves, with new core acreage in the Permian since its acquisition of Callon Petroleum (CPE). The Permian will now account for two-thirds of APA’s total production with the additional 103 mboe/d of production from Delaware and Midland basins.
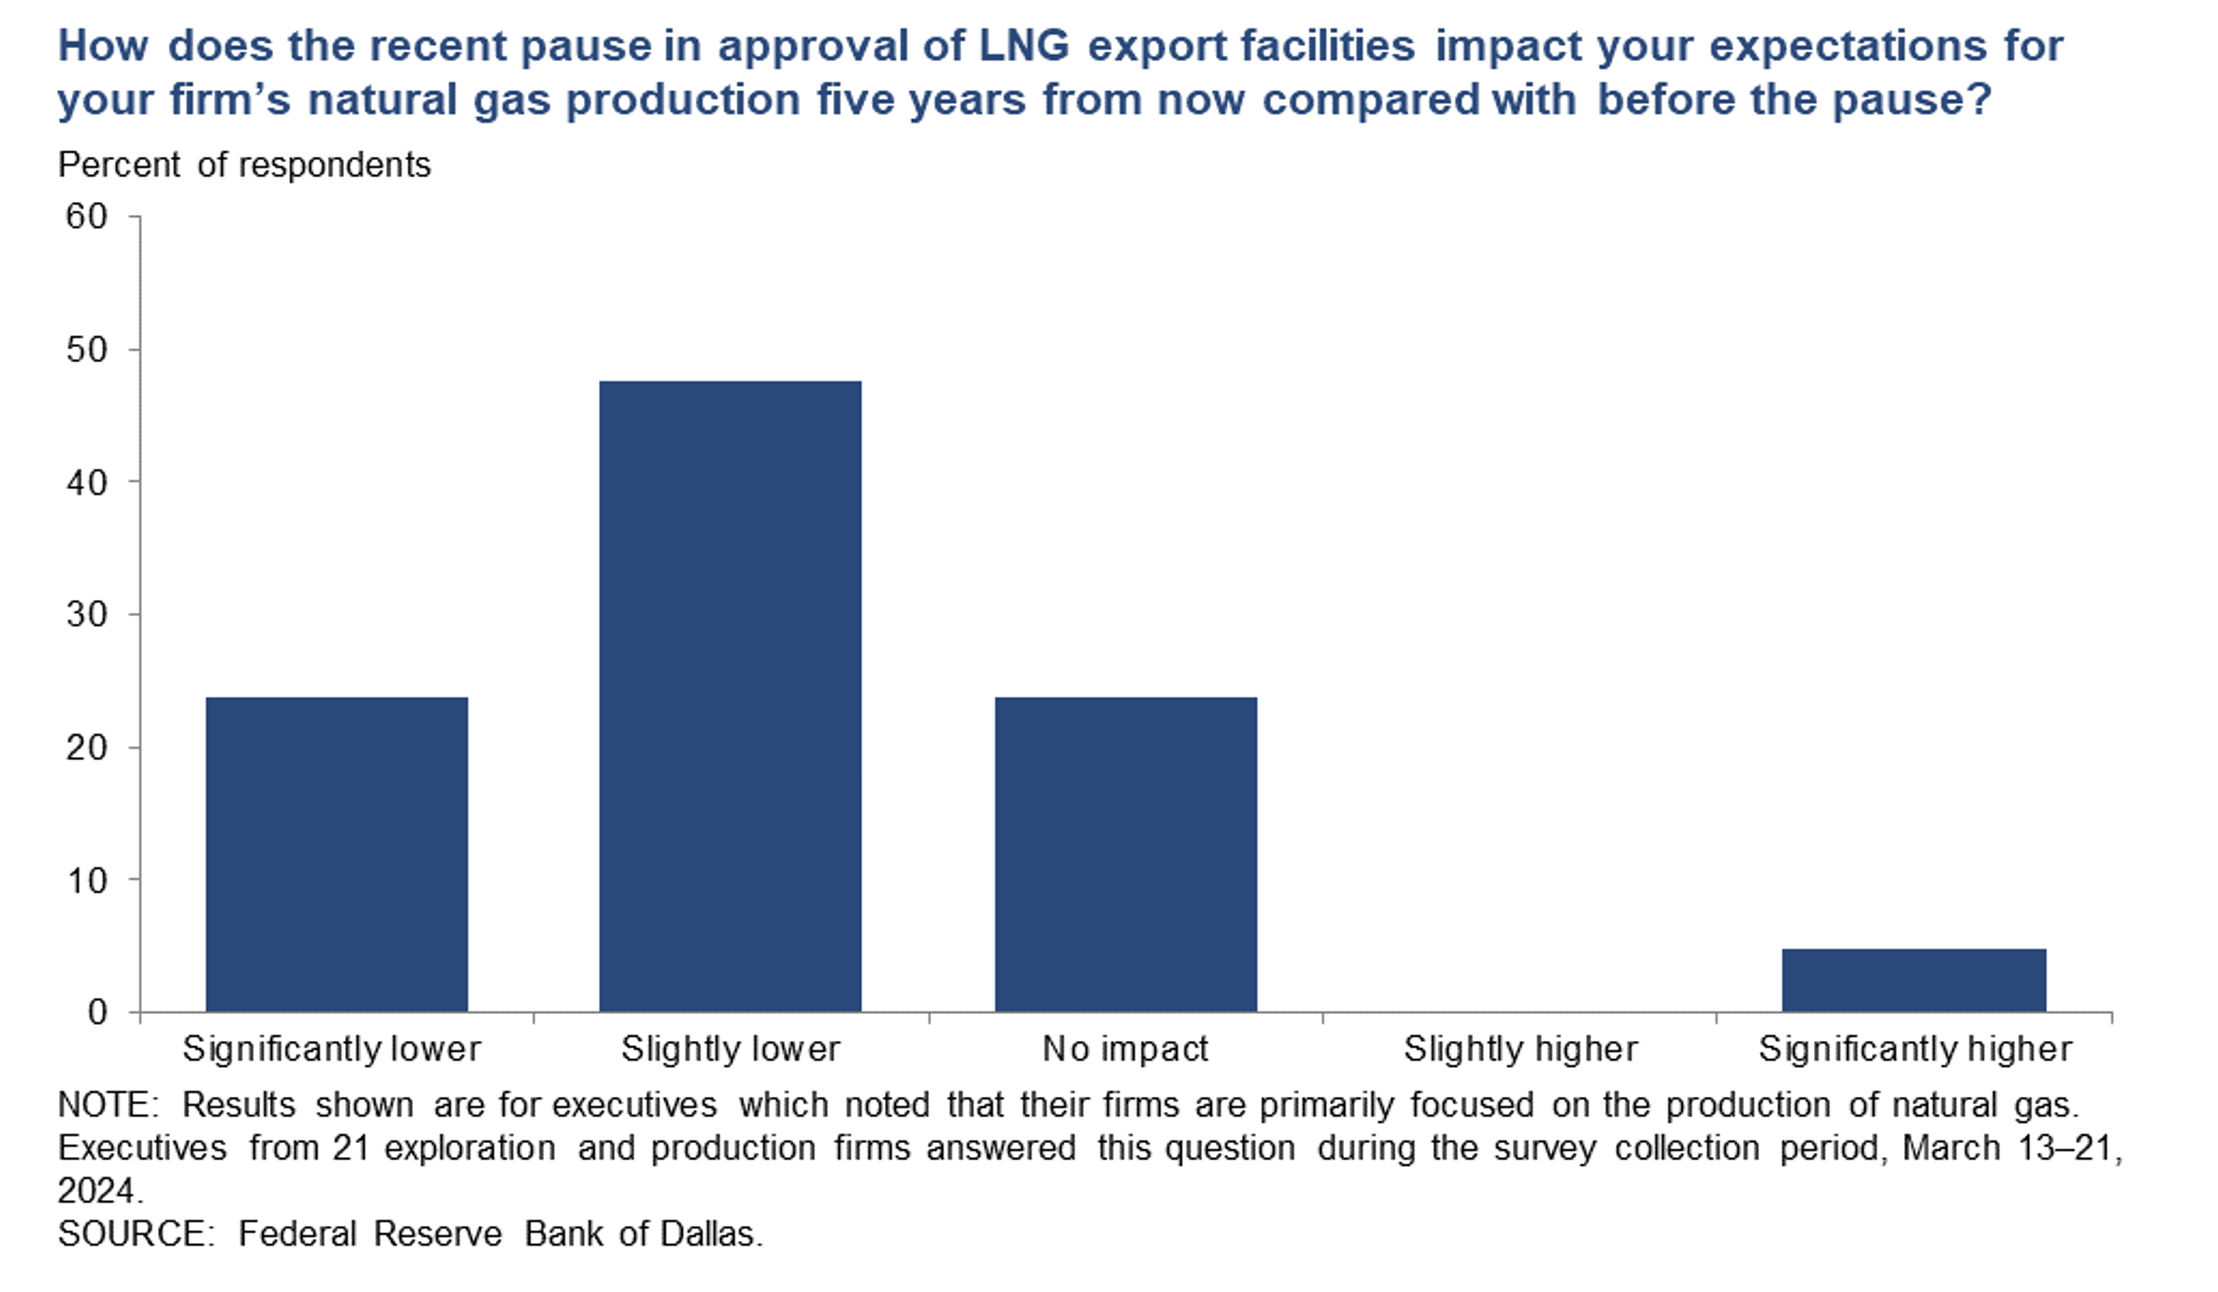
Fed Survey Points to Lower Gas Production from Biden LNG Pause
The Dallas Fed’s First Quarter 2024 Energy Survey posed a question to E&P executives regarding the Biden LNG Pause. The question was, “How does the recent pause in approval of LNG export facilities impact your expectations for your firm’s natural gas production five years from now compared with before the pause?” Among the responses from executives at E&P firms that focus on natural gas production, 48% indicated that their future production would be slightly lower, and 24% indicated production would be significantly lower. No impact was indicated by 24% of the respondents, with only 5% indicating expectations for higher production related to the Biden Pause.
Conclusion
Permian production growth over the past year was a positive outlier among the four basins covered in our analysis, with Eagle Ford, Appalachia, and Haynesville all posting production declines (albeit Appalachia’s decline being insignificant at 0.3%). While showing typical reactions to global and national energy economic forces, commodity prices ended the period modestly improved. Rig count declines were greater than production declines, partly due to the continuation of the recent trend in DUC count declines – particularly in the Eagle Ford.
We have assisted many clients with various valuation needs in the upstream oil and gas space for both conventional and unconventional plays in North America and around the world. Contact a Mercer Capital professional to discuss your needs in confidence.