The first six months of 2016 were eventful for U.S. markets. Worldwide, markets dealt with the continued blight within the oil industry and the shockwave of United Kingdom’s decision to leave the European Union. In the U.S., investors worried over potential Fed interest rate hikes and the inflated unicorn valuations. It appears that no market was safe from turbulence. At the halfway mark of 2016, we review the state of public and private equity markets.
Public Markets
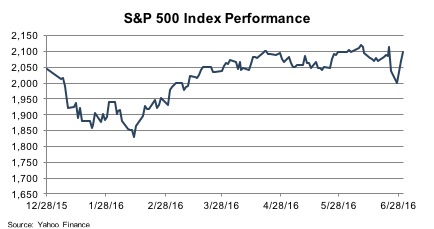
Equity market performance in the first half of 2016 may be best described as volatile. The year began with large movements in the S&P 500 during the first quarter. The index dove 10% to a low of 1,829 in mid-February as the price of oil reached its lowest level in 10 years. Gains appeared likely during 2Q16 until the index took yet another downturn following the results of the Brexit vote. The S&P 500 fell 4.1% in the week after the plebiscite as the potential ramifications spurred global market uncertainty.
Although overall stock market returns were modest during 1H16, the energy sector began showing improvement. The S&P Energy Select Sector Index was up 16% at mid-year, as the prices of oil and natural gas increased more than 25% over prices at the beginning of the year. Industrials and consumer staples also showed steady gains, while financial services and healthcare posted negative returns.
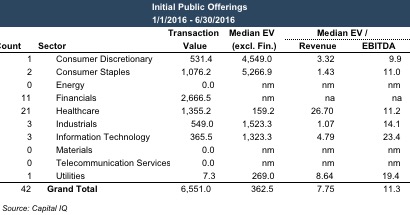
Uncertainty in the public equity markets makes initial public offering (IPO) potentially less attractive to a private company seeking to raise capital. The number of private companies going public began slowing in 2015, ending the year at just 162 IPOs compared to 245 in 2014. Continuing this trend, the 42 IPOs completed in the first half of 2016 were less than half of the number of IPOs during 1H15. Healthcare remained the most active sector, accounting for half of the companies that went public this year. Companies in the financial sector accounted for approximately 26% of total IPOs, while information technology and industrials accounted for 7% each.
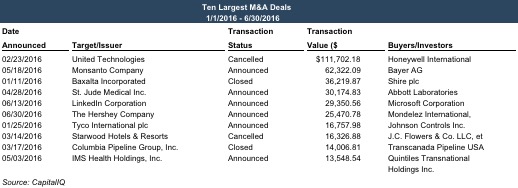
Merger and acquisition activity during the first half of the year was marked by announcements – and cancellations – of deals between large industry players. According to data compiled by S&P Capital IQ, approximately 5,200 transactions with U.S.-based targets have been announced so far this year, with consumer discretionary and information technology companies accounting for nearly 40% of the deals. Total deal value is estimated at $751 billion, with an average deal size of just over $600 million. We have also seen the dissolution of large deals announced during the prior year, including the $160 billion merger between Pfizer and Allergan. Cancellations have also spilled over to the new deals. The largest potential transaction of 2016, Honeywell International’s $112 billion offer for United Technologies Corporation, was cancelled just a month after the announcement due to anticipated regulatory scrutiny.
Private Equity
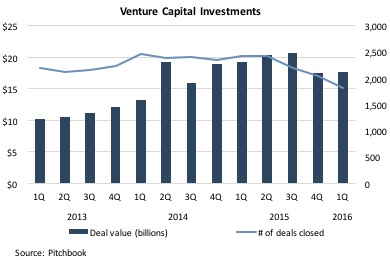
Private capital markets (venture and private equity) saw an influx of investor funding in the first half of 2016. Over $12 billion of newly raised capital in the first quarter has 2016 on track to be the third consecutive year in which more than $10 billion in venture capital were raised each quarter. The National Venture Capital Association attributes part of this increase to the healthy state of the venture capital environment. With the Federal Reserve delaying another interest rate increase, higher potential risk-adjusted returns from the asset class could continue to appeal to investors.
The increase in venture capital fundraising activity during the year has not necessarily trickled down to the investments into the average startup company, however. According to Pitchbook, although $22.3 billion was invested in the second quarter of 2016, a large funding round for rideshare company Uber accounted for 28% of the total. Pitchbook also noted that although venture capital investments appear to be rising annually, large fundraising rounds by unicorn companies have accounted for the majority of the increase. In fact, the amount of capital invested in non-unicorn companies has actually declined since 4Q 14.
Investors appear to be losing interest even faster in earlier-stage startups. The number of seed deals grew rapidly from 2007 to 2014 before making a large downward turn in 2015. At mid-year, 2016 is positioned to continue the downslide—as the number of seed deals and follow-on investments remain at a quarter of the comparable number from 2014. The 7.4% follow-on rate for seed deals in 2015 was the lowest point in the prior decade. With just 1.2% of seed deals receiving follow-on investments in the first half of 2016, startup funding this year appears even bleaker.
Private equity has slowed in general, with both deal count and aggregate value falling in the first half of the year. However, capital raises and average fund size have increased, indicating that investors may have plans for more investment in the near future. According to Pitchbook, private equity-backed exits in the first quarter totaled $59 billion, with the most exits occurring in the healthcare, information technology, and financial services sectors. The materials & resources and energy industries showed the smallest success in private equity exits as natural resources businesses continue to struggle.
Conclusion
As we enter the second half of the year, as always, it is difficult to predict how markets will continue to perform. The outcome will likely depend greatly on the outcomes of various political and economic uncertainties faced in the U.S. and globally. How industries/sectors perform will also affect the activity and financial reporting needs of individual companies. For industries that demonstrate continued growth and attractiveness, we could see an increase in acquisition and investment activity. For those that continue to be challenged, the potential for goodwill impairment charges and restructurings loom. At Mercer Capital we work with companies on both ends of the spectrum, and it will be interesting to see what the next six months have in store.
Related Links
- M&A Breakups Have Cost Wall Street $1.2 Billion in 2016 Alone
- Interest Rates, Unicorns And What The Fed Means To Silicon Valley
Mercer Capital’s Financial Reporting Blog
Mercer Capital monitors the latest financial reporting news relevant to CFOs and financial managers. The Financial Reporting Blog is updated weekly. Follow us on Twitter @MercerFairValue.


