With the second quarter drawing to a close, private equity managers can look forward to a fresh round of portfolio valuation marks. We recently pulled some historical gains and losses reported by publicly-traded BDCs to help provide some context as we look to the upcoming valuation marks.
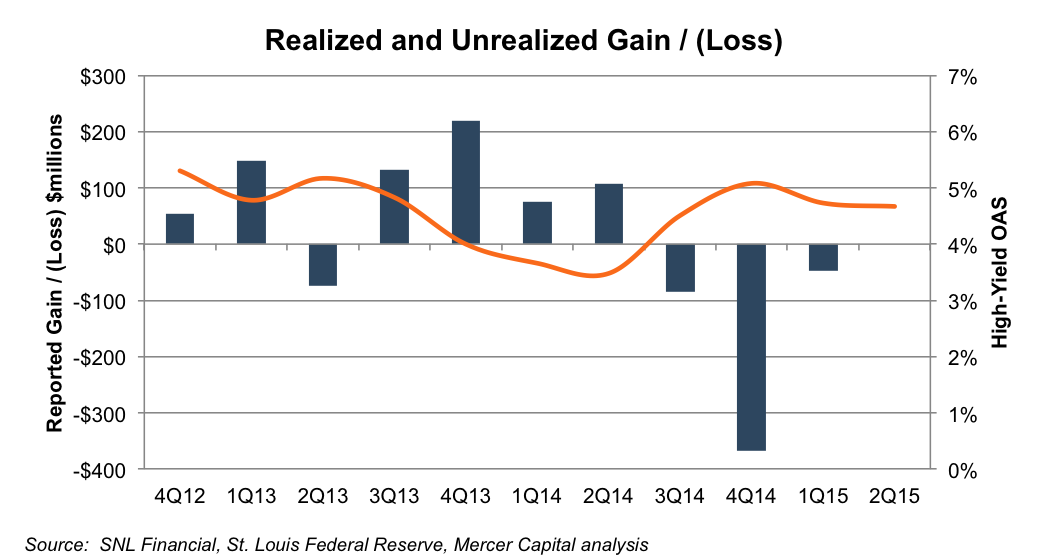
The following chart confirms what one would expect for the fixed-income focused BDCs – gains and losses are highly correlated to changes in credit spreads. The dramatic compression in credit spreads during the second half of 2013 and the first half of 2014 was accompanied by a string of substantial gains. These gains supported growth in net asset value per share, a key performance metric for BDCs.
So far, so good. Digging a bit deeper into the data, however, we were surprised by the degree of variability around reported gains and losses among individual BDCs. Our universe for this analysis consisted of 19 of the largest publicly traded BDCs. The next chart tracks the “breadth” of reported gains and losses by measuring the number of BDCs reporting net gains versus net losses in a given quarter.
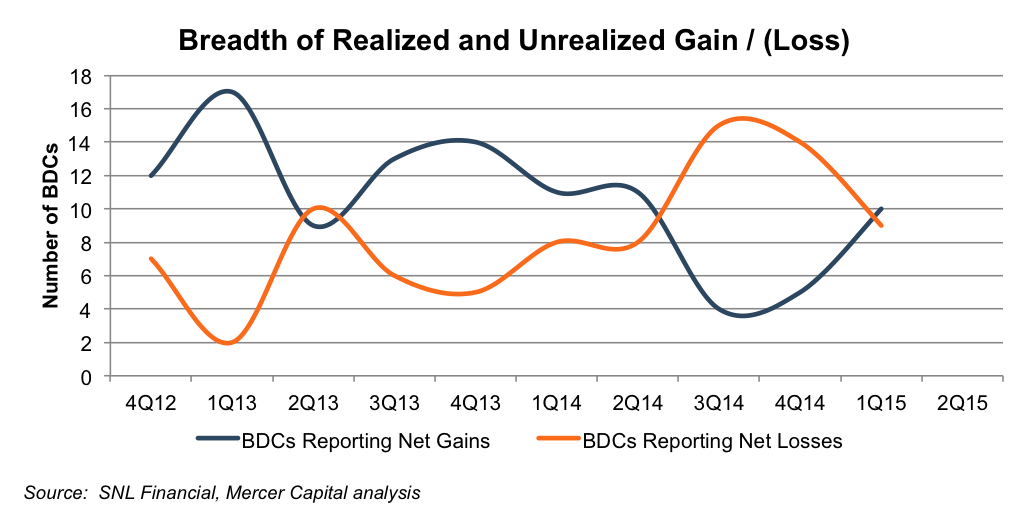
In general, there is less “unanimity” among the BDCs than we expected. For example, in 1Q14 credit spreads fell from 34 bps, a fairly strong bullish trend; yet during the quarter, eight of the BDCs reported net losses, compared to eleven posting gains. The divergence of quarterly results among the BDCs may be traced to a few different factors:
- Sector concentrations matter. The high-yield OAS figures in the first chart are aggregate measures for the whole high-yield market. Not all sectors of the high-yield market move in concert. The second half of 2014 was a great example: the dramatic spread widening in the oil & gas sector had a material impact on the overall high-yield market numbers.
- Credit–specific factors play a big role in fair value marks. There is no one-size-fits-all formula to measure fair value. The unit of account for fair value measurement is the investment, not the portfolio. The operating performance of individual investments will only be imperfectly correlated to overall economic indicators. If this has been true during the relatively benign credit environment of the past three years, it will be even more evident when the credit cycle inevitably turns.
- Valuation is not easy or automatic. Even in ideal market conditions, estimating appropriate market participant assumptions requires a healthy dose of judgment, which highlights the need for a robust process and documentation of assumptions. Valuation is always easier in hindsight; unfortunately, portfolio marks have to be made in “real time.”
So, what can we expect in terms of portfolio marks as of June 30? Credit spreads were generally flat during 2Q15, which has historically been a recipe for greater variability of reported results among BDCs. Absent a decisive move in spreads, fair value measurement this quarter will likely be driven by investment-specific factors.
Related Links
- A Capital Raise in Acquisition Clothing?
- Credit Spread Blues & Portfolio Valuation Marks
- If Valuation Were An Olympic Sport
- How to Value Venture Capital Portfolio Investments
Mercer Capital’s Financial Reporting Blog
Mercer Capital monitors the latest financial reporting news relevant to CFOs and financial managers. The Financial Reporting Blog is updated weekly. Follow us on Twitter at @MercerFairValue.