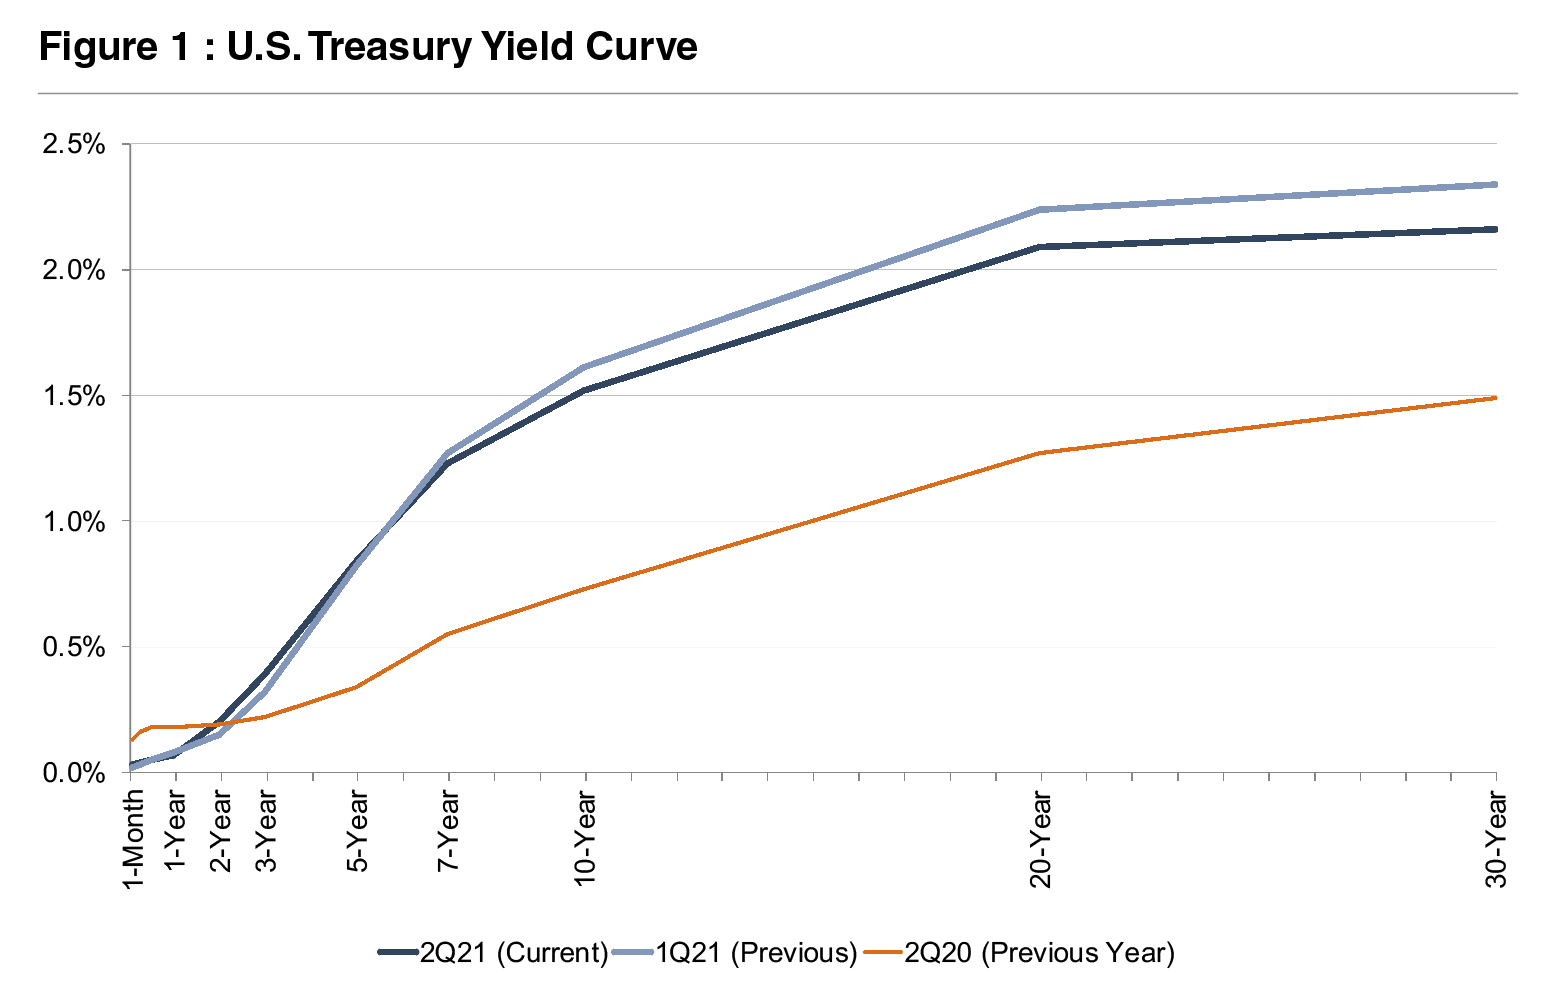
In our last update regarding core deposit trends published in August 2020, we described a decreasing trend in core deposit intangible asset values in light of the pandemic. In response to the pandemic, the Fed cut rates to effectively zero, and the yield on the benchmark 10-year Treasury reached a record low. While many factors are pertinent to analyzing a deposit base, a significant driver of value is market interest rates. Although there has been some recovery in longer-term treasury rates since this time last year, shorter-term treasury rates (maturities of two years or less) have eased as investors concluded the Fed will not raise short-term policy rates in the near-term.
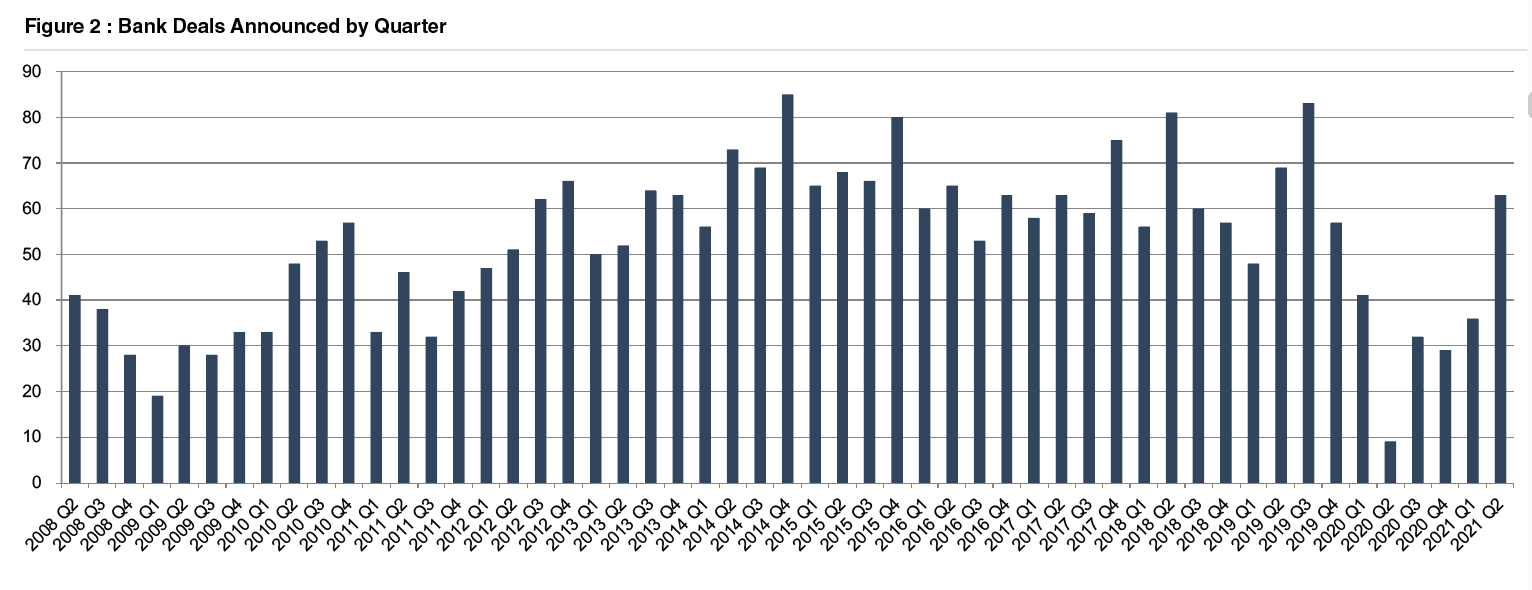
For the full year of 2020, bank M&A activity fell sharply to 111 announced transactions from approximately 250 to 300 transactions per year during 2014 to 2019. More deals have been announced in the first eight months of 2021 than were announced in all of 2020. As shown in Figure 2, on the next page, the majority of the 2021 announcements occurred in the second quarter.
With 63 announced deals, the second quarter of 2021 represented the highest level of quarterly deal announcements since the third quarter of 2019 (83 deals). For comparison, only nine whole-bank transactions were announced in the second quarter of 2020, representing the fewest deals announced during a quarter over the time period analyzed. At this time last year, there were several factors hindering deal activity. Unknowns surrounding credit quality and the severity of loan deferrals in the midst of the pandemic gave pause to many deal talks in progress prior to the pandemic. Constraints surrounding travel and due diligence also hampered activity.
Ultimately, credit losses were not as significant as were feared initially, and travel has begun to normalize in the wake of widespread vaccine distribution. As a result, there appears to be a degree of pent-up demand in the bank M&A market. Moreover, many of the factors driving acquisitions have intensified over the past year.
Revenue pressure is causing institutions to seek operational efficiencies via synergies, as loan growth (excluding PPP loans) has been exceptionally weak over the past year, deposit growth has been unprecedented, and interest rates remain near historic lows. Additionally, as more consumers adopted digital banking in a socially-distancing society, banks lacking capability in this arena saw a more acute need to seek partnerships with more technologically advanced institutions.
Click here to expand the chart above
Using data compiled by S&P Capital IQ Pro, we analyzed trends in core deposit intangible (CDI) assets recorded in whole bank acquisitions completed from 2000 through June 30, 2021. CDI values represent the value of the depository customer relationships obtained in a bank acquisition. CDI values are driven by many factors, including the “stickiness” of a customer base, the types of deposit accounts assumed, and the cost of the acquired deposit base compared to alternative sources of funding. For our analysis of industry trends in CDI values, we relied on S&P Capital IQ Pro’s definition of core deposits.1 In analyzing core deposit intangible assets for individual acquisitions, however, a more detailed analysis of the deposit base would consider the relative stability of various account types.
In general, CDI assets derive most of their value from lower-cost demand deposit accounts, while often significantly less (if not zero) value is ascribed to more rate-sensitive time deposits and public funds, or to non-retail funding sources such as listing service or brokered deposits which are excluded from core deposits when determining the value of a CDI.
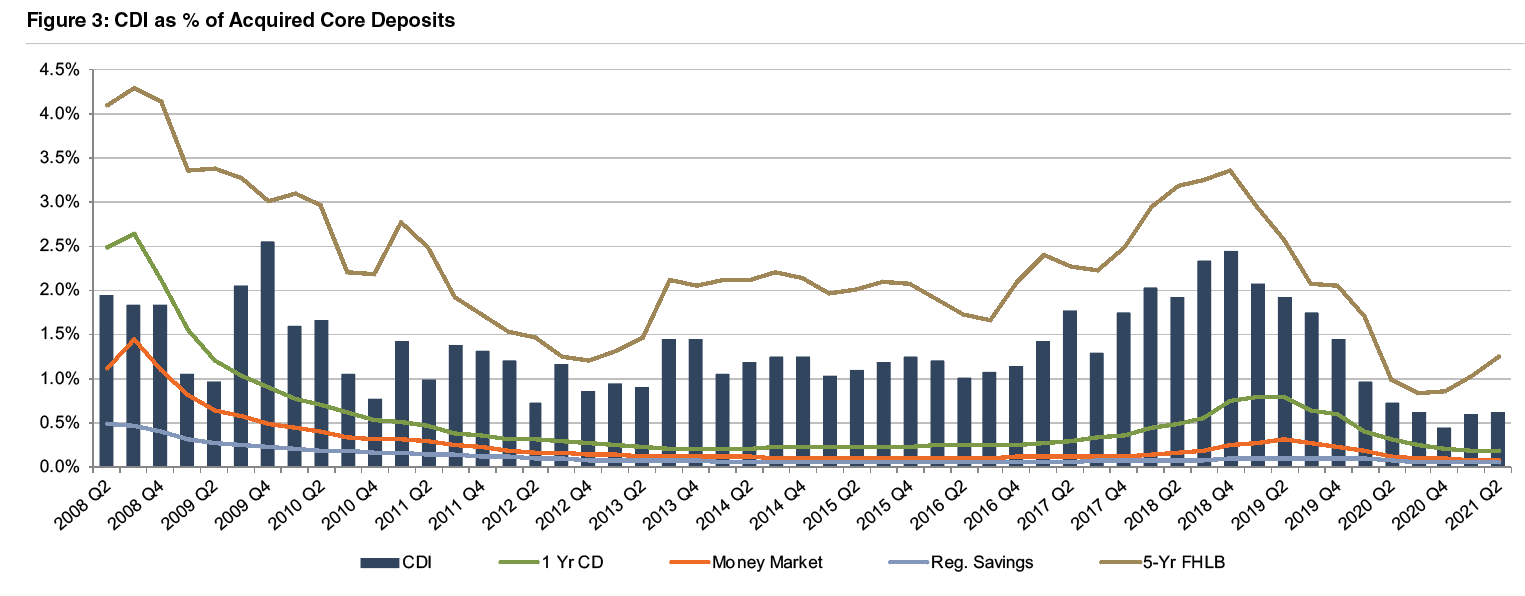
Figure 3, below, summarizes the trend in CDI values since the start of the 2008 recession, compared with rates on 5-year FHLB advances. Over the post-recession period, CDI values have largely followed the general trend in interest rates—as alternative funding became more costly in 2017 and 2018, CDI values generally ticked up as well, relative to post-recession average levels.
Click here to expand the chart above
Throughout 2019, CDI values exhibited a declining trend in light of yield curve inversion and Fed cuts to the target federal funds rate during the back half of 2019. This trend accelerated in March 2020 when rates were effectively cut to zero. CDI values have shown some recovery in the past two quarters (average of 60 basis points for the first half of 2021 as compared to 50 basis points in the second half of 2020). Despite the recent uptick, CDI values remain below the post-recession average of 1.33% in the period presented in the chart and meaningfully lower than long-term historical levels which averaged closer to 2.5-3.0% in the early 2000s.
The average CDI value declined 11 basis points from June 2020 to June 2021, while the five year FHLB advance increased 25 basis points over the same period. Although the five year FHLB advance rate has increased year-over-year, rates on FHLB advances with terms of less than two years have declined an average of 11 basis points since this time last year.
Since the beginning of the pandemic, banks have been burdened with an excess of deposits. It was initially expected that the increase in deposits would be transient in nature as the economy re-opened, PPP funds were spent or invested, and consumer confidence improved. However, the glut of deposits has endured, and deposits at US commercial banks were at a record level of $17.3 trillion at the end of July despite earning historically low deposit rates. Weak loan demand has aggravated the issue for banks, and margin pressure remains a very real concern for financial institutions.
In past cycles, when interest rates declined, the change in the CDI/core deposit ratio was mostly caused by lower CDI values (the numerator in the ratio). In the pandemic, though, CDI values declined (due to lower rates) while core deposits increased (due to the governmental response to the pandemic among other factors). With market participants unwilling to pay a premium for potentially transient deposits, the CDI/core deposit ratio was squeezed by both lower CDI values (the numerator) and higher core deposits (the denominator). Time will tell how stable deposits will be after the deposit influx experienced in 2020 and the first half of 2021, which will affect CDI values going forward.
Core deposit intangible assets are related to, but not identical to, deposit premiums paid in acquisitions. While CDI assets are an intangible asset recorded in acquisitions to capture the value of the customer relationships the deposits represent, deposit premiums paid are a function of the purchase price of an acquisition. Deposit premiums in whole bank acquisitions are computed based on the excess of the purchase price over the target’s tangible book value, as a percentage of the core deposit base.
While deposit premiums often capture the value to the acquirer of assuming the established funding source of the core deposit base (that is, the value of the deposit franchise), the purchase price also reflects factors unrelated to the deposit base, such as the quality of the acquired loan portfolio, unique synergy opportunities anticipated by the acquirer, etc.
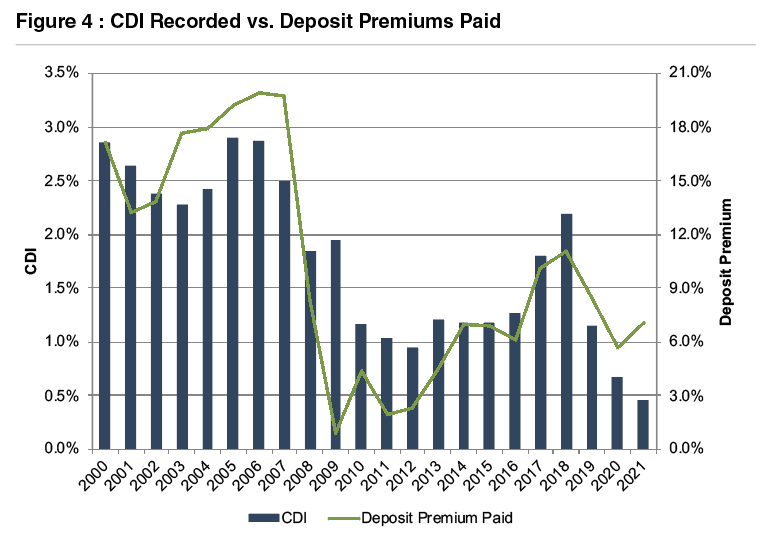
Additional factors may influence the purchase price to an extent that the calculated deposit premium doesn’t necessarily bear a strong relationship to the value of the core deposit base to the acquirer. This influence is often less relevant in branch transactions where the deposit base is the primary driver of the transaction and the relationship between the purchase price and the deposit base is more direct. Figure 4 presents deposit premiums paid in whole bank acquisitions as compared to premiums paid in branch transactions.
As shown in Figure 4, deposit premiums paid in whole bank acquisitions have shown more volatility than CDI values. Deposit premiums in the rangeof 6% to 10% remain well below the pre-Great Recession levels when premiums for whole bank acquisitions averaged closer to 20%.
Deposit premiums paid in branch transactions have generally been less volatile than tangible book value premiums paid in whole bank acquisitions. Branch transaction deposit premiums averaged in the 4.5% to 7.5% range during 2019 and 3.0% to 7.5% during 2020, up from the 2.0% to 4.0% range observed in the financial crisis. Only eight branch transactions were completed in the first half of 2021, but the range of their implied premiums is in line with 2019 and 2020 levels.
Some disconnect appears to exist between the prices paid in branch transactions and the CDI values recorded in bank M&A transactions. Beyond the relatively small sample size of branch transactions, one explanation might be the excess capital that continues to accumulate in the banking industry, resulting in strong bidding activity for the M&A opportunities that arise–even in situations where the potential buyers have ample deposits.

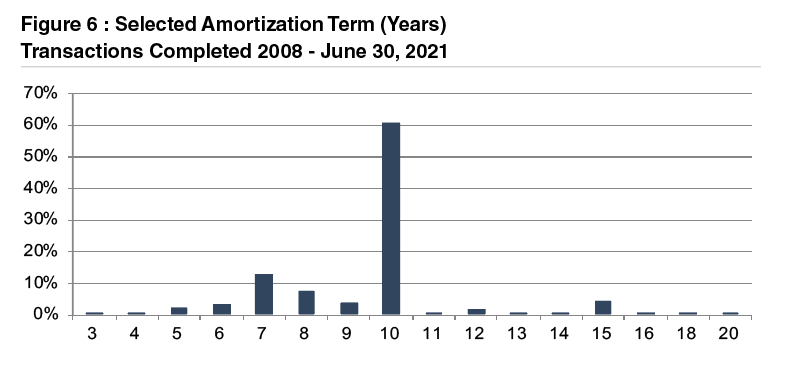
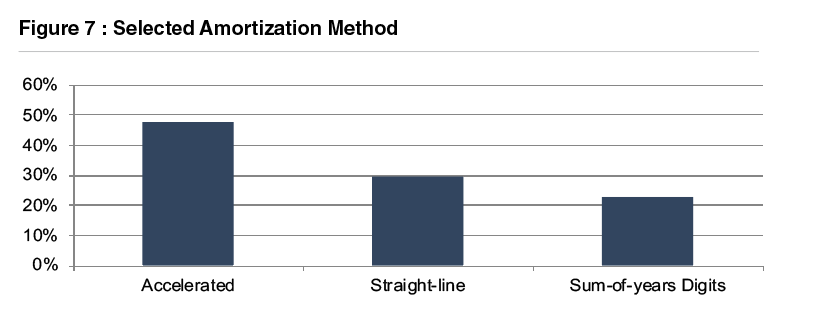
Based on the data for acquisitions for which core deposit intangible detail was reported, a majority of banks selected a ten-year amortization term for the CDI values booked. Less than 10% of transactions for which data was available selected amortization terms longer than ten years. Amortization methods were somewhat more varied, but an accelerated amortization method was selected in approximately half of these transactions.
For more information about Mercer Capital’s core deposit valuation services, please contact one of our professionals.