Subdued But Potentially Explosive
M&A activity was depressed for a second consecutive year in 2023 as M&A pricing fell to multi-decade lows excluding the Great Financial Crisis (GFC) years. At some point, we expect an explosive rebound though a recession – especially a deep one – would delay the liftoff. In the interim, recap transactions may increase as seen with the recently announced $150 million recapitalization of Blue Ridge Bancshares Inc. (NYSEAM: BRBS).
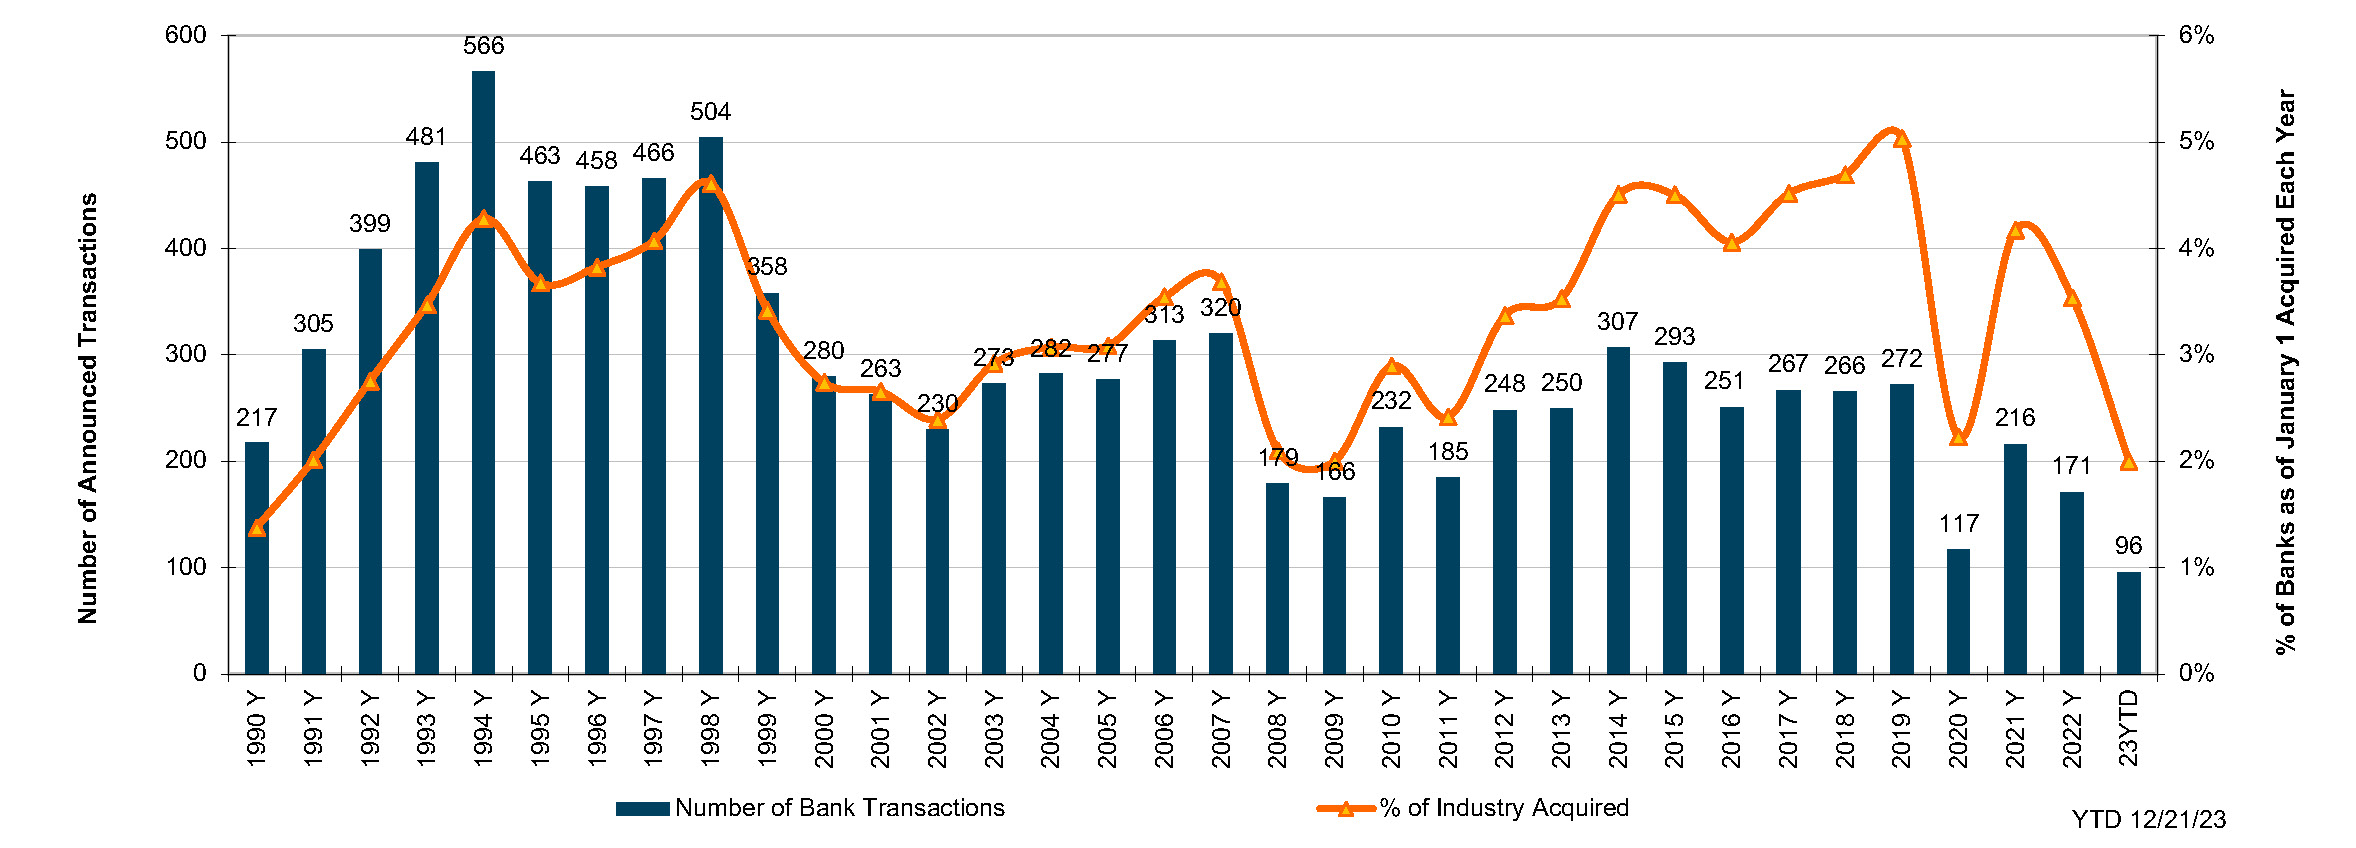
As of December 21, only 96 bank and thrift deals had been announced, which equated to about 2.0% of the number of charters as of January 1 – a level that is equivalent to the recession years of 1991 and 2009. The aggregate deal value for transactions that included disclosed pricing was only $4.6 billion, by far the lowest deal value since 1990 when an equivalent amount of non-assisted deals was announced. Adjusted for inflation, deal value was ~40% of 1990.
Figure 1
 Source: S&P Global Market Intelligence
Click here to expand the image above
Emblematic of the tough M&A environment was the terminated merger agreement between Toronto-Dominion Bank (NYSE: TD) and First Horizon (NYSE: FHN) in May 2023. The failed deal represented another negative datapoint for bank investors following the failures of Silicon Valley Bank and Signature Bank in March and First Republic Bank on May 1. All three banks were members of the S&P 500, and the CEO of SVB was a director of the Federal Reserve Bank of San Francisco.
TD was unable to secure regulatory approval for the merger that was announced in February 2022 that would have entailed $13.5 billion of cash consideration, or $25.00 per share for First Horizon. Pricing equated to 227% of year-end 2021 TBVPS and ~17x the 2022 EPS consensus estimate.
At announcement, the Fed was expected to gradually lift rates in 2022 to the benefit of bank earnings. When the deal was called off, FHN’s shares fell to ~$11 per share because there would be no cover bidder to step forward and because banks had been revalued to 7-9x earnings as rapidly rising rates created a myriad of problems, including declining NIMs and EPS estimates. Additional perspective on the deal can be found here.
Roller Coaster Markets
The bear markets that developed for bank stocks and fixed income in 2022 continued until 2023 when a November rally in the bond market, confirmed by a Fed pivot on December 13, lessened the pain. Among the data points:
The NASDAQ Bank Index declined 7% year-to-date through December 21 following an 18% reduction in 2022;
The NASDAQ Bank Index declined 35% year-to-date as of May 4, rebounded during the summer then fell to near the May lows by mid-October when the 10-year UST yield hit 5%;
By December 21, the NASDAQ Bank Index rallied 28% from October 31, 7% of which occurred the week that Jerome Powell appeared to pivot to rate cuts for 2024;
After raising the Fed Funds target rate 425bps in 2022, the Fed boosted the rate 100bps in 2023 to 5.25% to 5.50% - the highest rate since 1H07;
Although the yield on the 10-year UST rose to 5% in October, it ended the year where it began near 3.9%;
The Treasury yield curve remained inverted for a record period since July 2022 for the 10/2 spread and October 2022 for the 10/3M Bill spread with the curve deeply inverted most of this time (-50bps and -150bps as of late-December); and
Recession forecasts notwithstanding, credit spreads narrowed, including the ICE BofA High Yield Index to 3.41% at December 21, 2023 from 4.81% at year-end 2022.
The favorable movement in bank stock prices, rates and credit spreads — if sustained, which could require the Fed to follow through with cuts — portend a material pickup in M&A activity in 2024.
Nonetheless, any increased probability for a recession to develop (inverted yield curves tend to precede them) may impede deal activity, as this would introduce uncertainty around asset quality metrics.The recent rally in the bond market notwithstanding, fair value marks to underwater bond portfolios and fixed rate loan portfolios are still a stumbling block given investor preference for acquirers to recoup day-one dilution to TBVPS within 2+ years. For larger deals, an additional headwind is the significant amount of time required to obtain regulatory approval.
Multi-Decade Low Pricing (x-GFC Years)
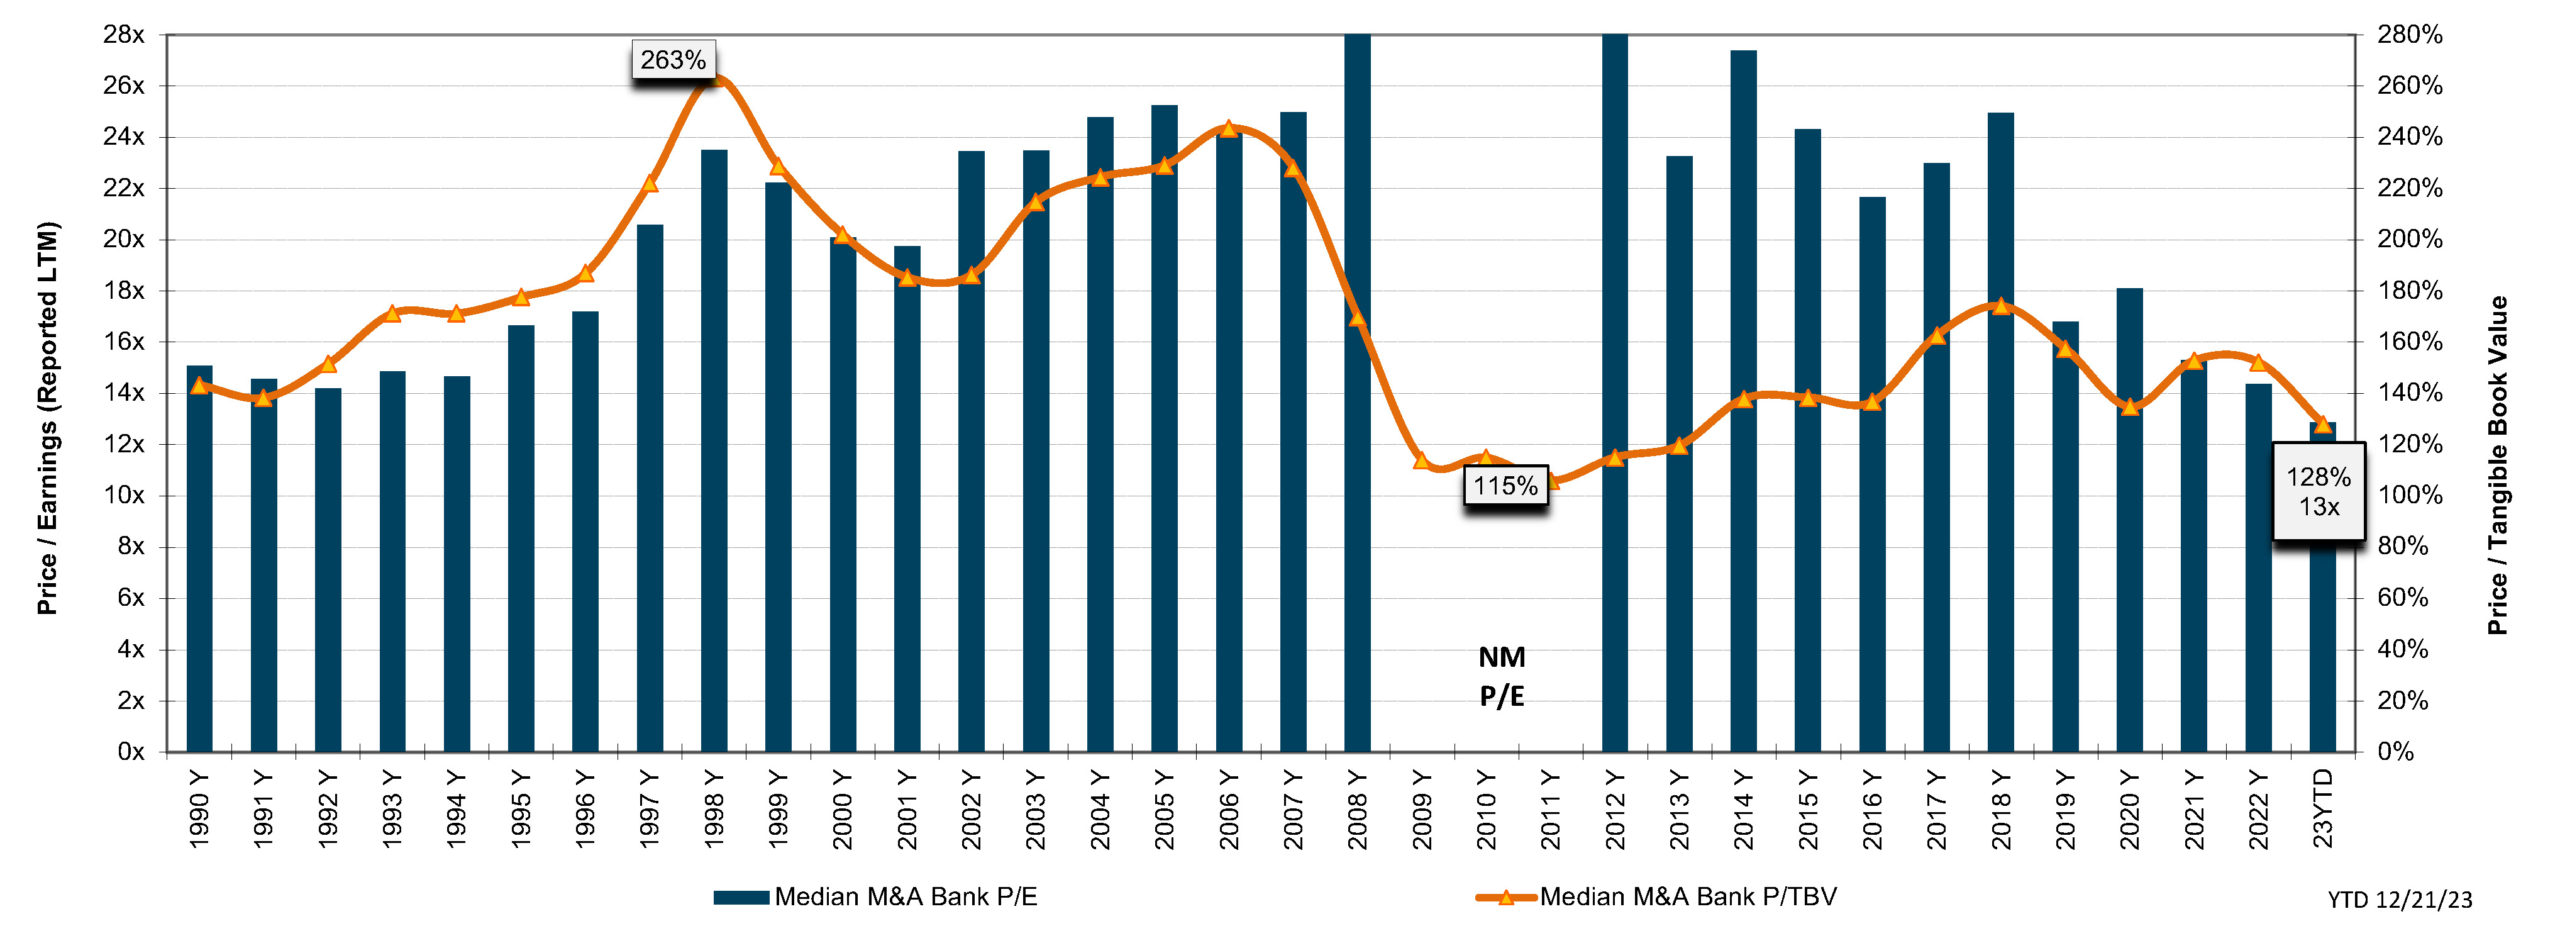
The average P/TBV multiple was 128% in 2023. As shown in Figure 2, the average transaction multiple since the GFC peaked in 2018 at 174% then declined to 134% in 2020 due to the impact of the short but deep recession on economic activity and markets, rebounded to about 150% in 2021 and 2022 before slumping in the rising rate, inverted yield curve environment of 2023.
The median P/E declined to 12.9x in 2023 from about 15x in 2021 and 2022; however, buyers focus on pro forma earnings with fully phased-in after-tax expense saves that often are on the order of 6x to 9x unless there are unusual circumstances.
Modest multiples inclusive of expense saves are necessary to generate EPS accretion. And EPS accretion is necessary to recoup day one dilution to TBVPS. Since the GFC, investors have become intensely focused on the time to recover TBVPS dilution as a means to limit buyers’ pricing flexibility. About ten years ago, 3-5 years was considered acceptable. Our take on current pricing is that investors want recovery in 2-3 years, in part because there is too much uncertainty re future EPS accretion vis-à-vis certainty about day one dilution.
Figure 2
 Source: S&P Global Market Intelligence
Click here to expand the image above
Figure 3
 Source: S&P Global Market Intelligence
Click here to expand the image above
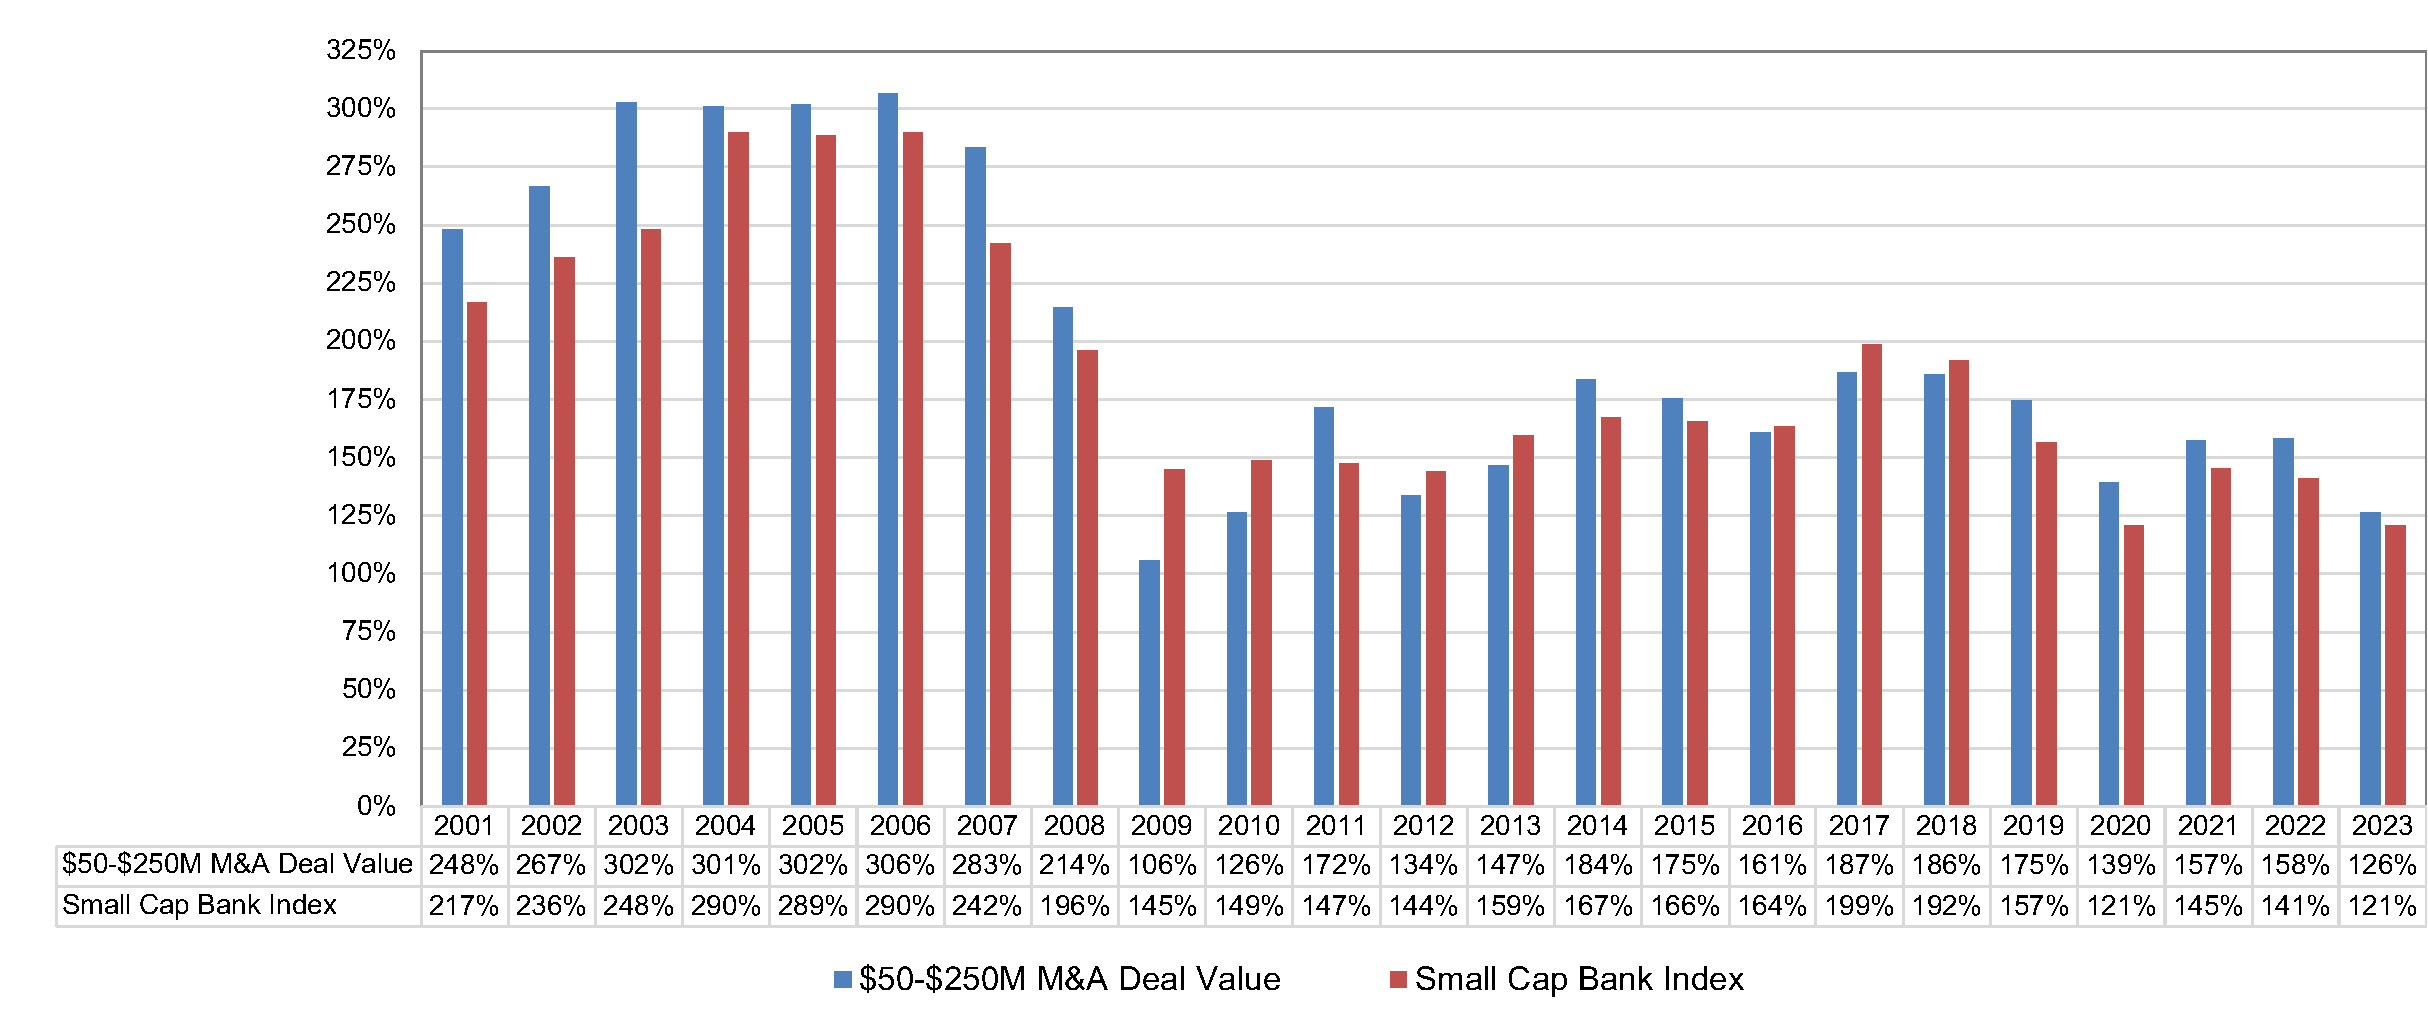
Public Market Multiples vs Acquisition Multiples
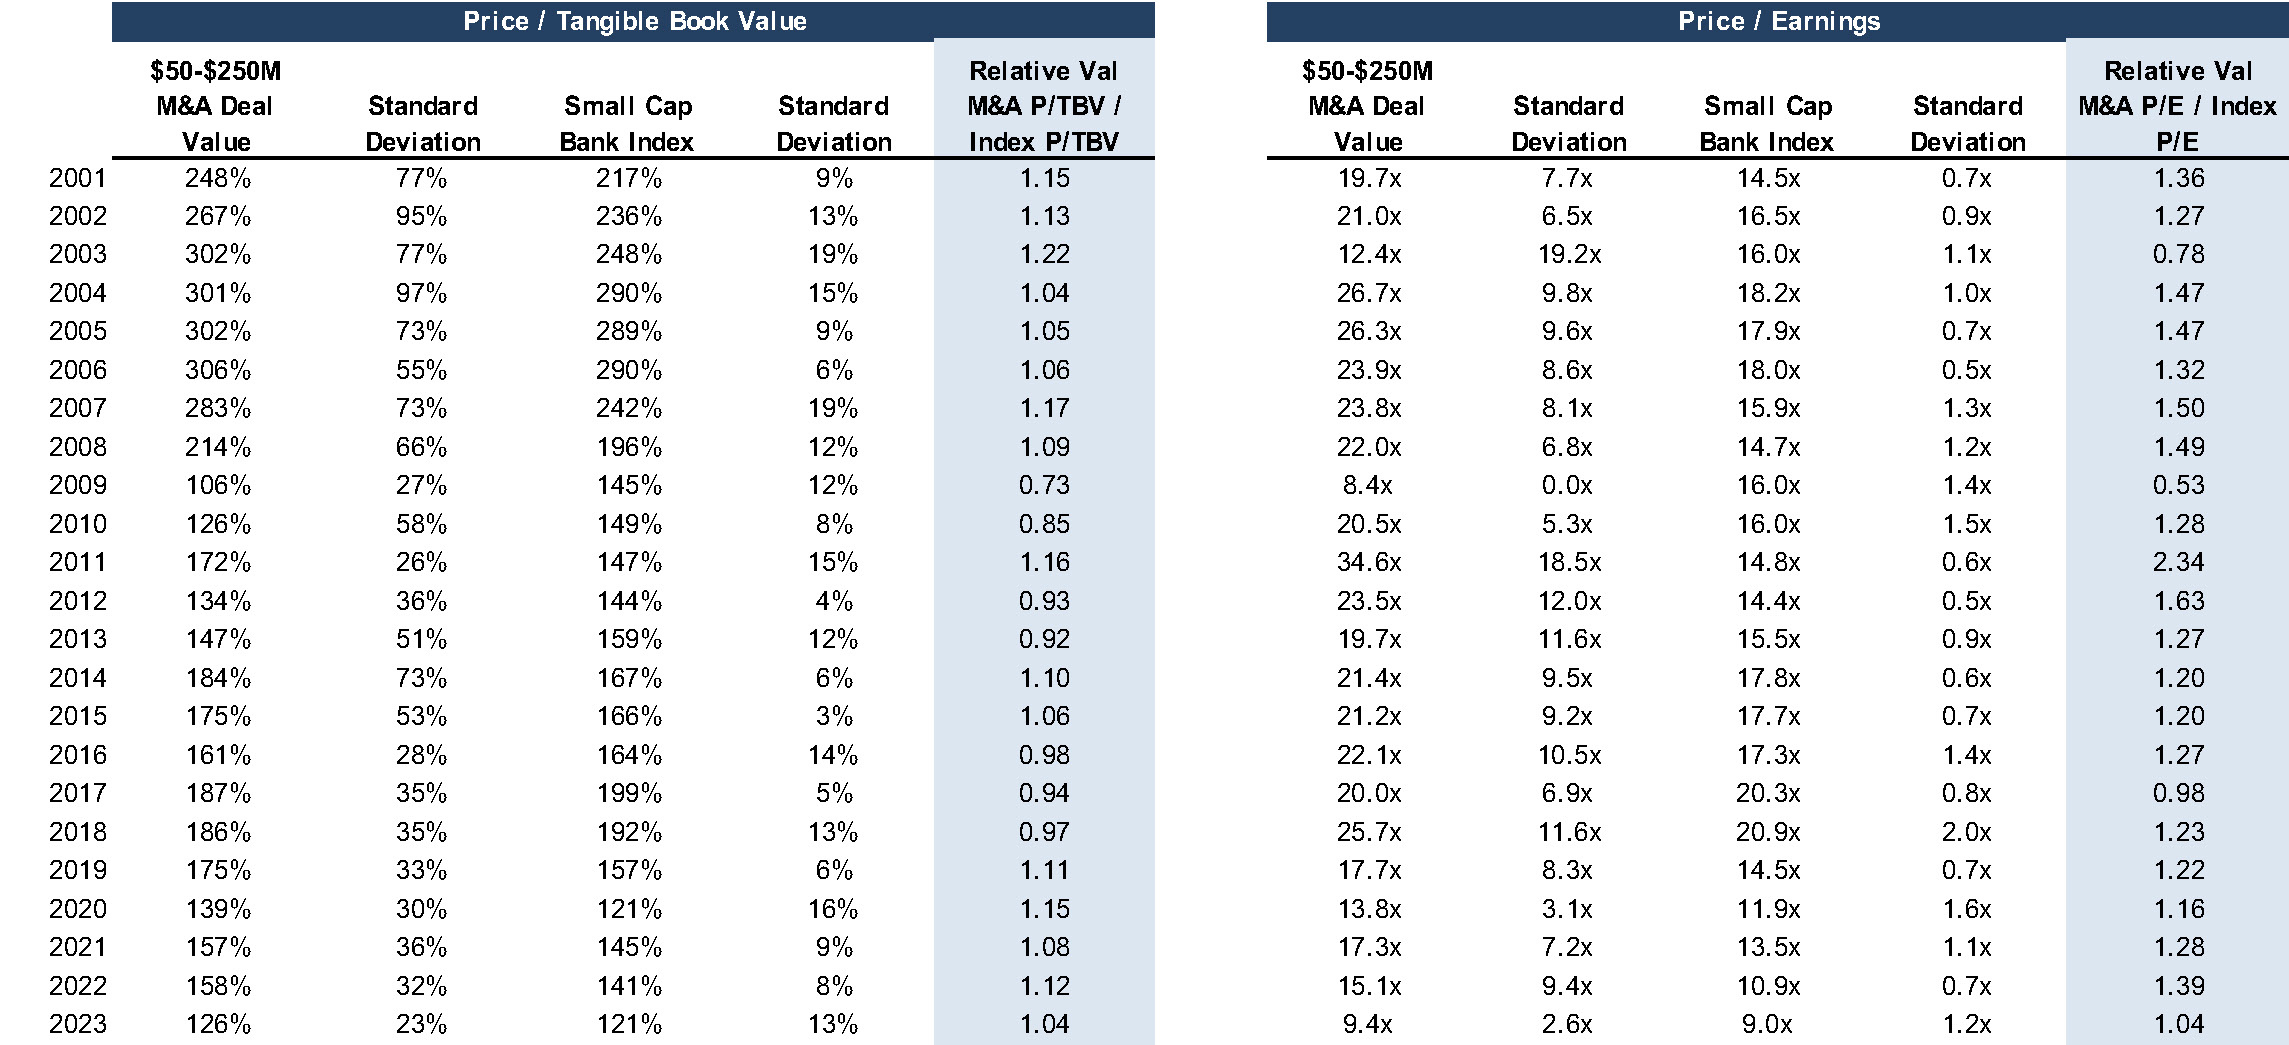
Figure 3 compares the annual average P/TBV and P/E for banks that were acquired for $50 million to $250 million since 2001 with the average daily public market multiple each year for the SNL Small Cap Bank Index. Among the takeaways are the following:
Acquisition pricing in the pre-GFC years, as measured by P/TBV multiples, was comfortably above 250%.
Since 2013, average P/TBV multiples approximated 160% to 180% until COVID struck in 2020.
The reduction in both the public and acquisition P/TBV multiples since the GFC reflects a reduction in ROEs for the industry since the Fed adopted a zero-interest rate policy (ZIRP) other than 2017-2019 and 2022-2023.
Since pooling of interest accounting ended in 2001, the “pay-to-trade” multiple as measured by the average acquisition multiple relative to the average index multiple has remained in a relatively narrow range of roughly 0.9 to 1.15 other than during 2009 and 2010.
P/E multiples based upon unadjusted LTM earnings approximated 20x prior to 2019 but have trended lower since.
Acquisition P/Es have tended to reflect a pay-to-trade multiple of 1.25 since the GFC but the pay-to-trade multiples are comfortably below 1.0x to the extent the pro forma earnings multiple is 6-9x, the result being EPS accretion for the buyer.
Premium Trends Subdued
Investors often focus on what can be referred to as icing vs the cake in the form of acquisition premiums relative to public market prices. Investors tend to talk about acquisition premiums as an alpha generator, but long-term performance (or lack thereof) of the target is what drives shareholder returns.
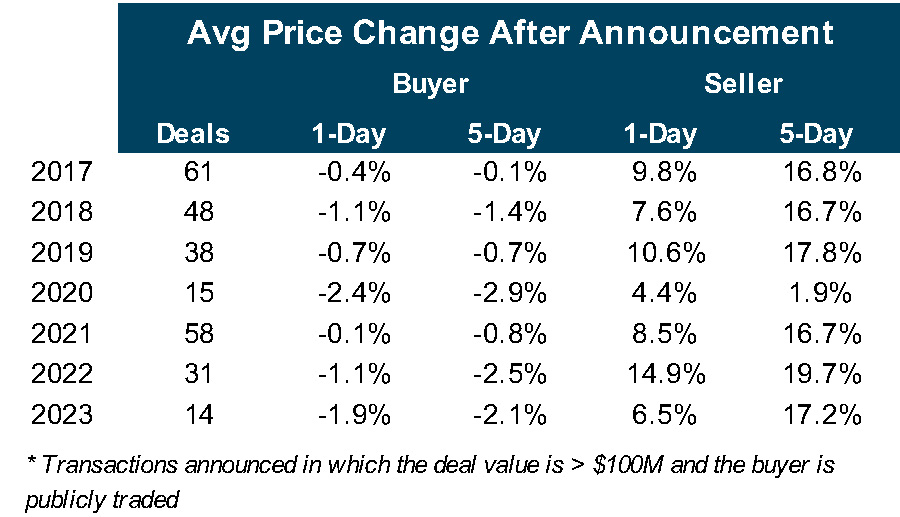
Figure 4
Source: S&P Global Market Intelligence
As shown in Figure 4, the average five-day premium for transactions announced in 2023 that exceeded $100 million in which the buyer and seller were publicly traded was about 17%, a level that is comparable to recent years other than 2020. For buyers, the average reduction in price compared to five days prior to announcement was 2.1%. There are exceptions, of course, when investors question the pricing (actually, the exchange ratio), day one dilution to TBVPS and earn-back period.
About Mercer Capital
M&A entails a lot of moving parts of which “price” is only one. It is especially important for would be sellers to have a level-headed assessment of the investment attributes of the acquirer’s shares to the extent merger consideration will include the buyer’s common shares. Mercer Capital has 40 years of experience in assessing mergers, the investment merits of the buyer’s shares and the like. Please call if we can help your board in 2024 assess a potential strategic transaction.
Figure 5
 Source: S&P Global Market Intelligence
Click here to expand the image above
Originally appeared in the December 2023 issue of Bank Watch.