The June BankWatch featured the first part of a series describing key considerations in the valuation of banks and bank holding companies. While that installment provided a general overview of key concepts, this month we pivot to the analysis of bank financial statements and performance.1 Unlike many privately held, less regulated companies, banks produce reams of financial reports covering every minutia of their operations. For analytical personality types, it’s a dream.

The approach taken to analyze a bank’s performance, though, must recognize depositories’ unique nature, relative to non-financial companies. Differences between banks and non-financial companies include:

  1. Close interactions between the balance sheet and income statement. Banking revenues are connected tightly to the balance sheet, unlike for nonfinancial companies. In fact, you often can estimate a bank’s net income or the growth therein solely by reviewing several years of balance sheets. Banks have an “inventory” of assets that earn interest, referred to as “earning assets,” which drive most of their revenues. Earning assets include loans, securities (usually highly-rated bonds like Treasuries or municipal securities), and short-term liquid assets. Changes in the volume of assets and the mix of these assets, such as the relative proportions of lower yielding securities and higher yielding loans, significantly influence revenues.
  2. The value of liabilities. For non-financial companies, acquisition motivations seldom revolve around obtaining the target entity’s liabilities. The effective management of working capital and debt certainly influences shareholder value for non-financial companies, but few attempt to stockpile low-cost liabilities absent other business objectives. Banks, though, periodically buy and sell branches and their related deposits. The prices (or “premiums”) paid in these transactions reveal that bank deposits, the predominate funding source for banks, have discrete value. That is, banks actually pay for the right to assume another bank’s liabilities.

Why do banks seek to acquire deposits? First, all earning assets must be funded; otherwise, the balance sheet would fail to balance. Ergo, more deposits allow for more earning assets. Second, retail deposits tend to cost less than other alternative sources of funds. Banks have access to wholesale funding sources, such as brokered deposits and Federal Home Loan Bank advances, but these generally have higher interest rates than retail deposits. Third, retail deposits are stable, due to the relationship existing between the bank and customer. This provides assurance to bank managers, investors, and regulators that a disruption to a wholesale funding source will not trigger a liquidity shortfall. Fourth, deposits provide a vehicle to generate noninterest income, such as service charges or interchange. The strength of a bank’s deposit portfolio, such as the proportion of noninterest-bearing deposits, therefore influences its overall profitability and franchise value.

  1. Capital Adequacy. In addition to board and shareholder preferences, nonfinancial companies often have debt covenants that constrain leverage. Banks, though, have an entire multi-pronged regulatory structure governing their allowable leverage. Shareholders’ equity and regulatory capital are not the same; however, the computation of regulatory capital begins with shareholders’ equity. Two types of capital metrics exist – leverage metrics and risk-based metrics. The leverage metric simply divides a measure of regulatory capital by the bank’s total assets, while risk-based metrics adjust the bank’s assets for their relative risk. For example, some government agency securities have a risk weight equal to 20% of their balance, while many loans receive a risk weight equal to 100% of their balance.

Capital adequacy requirements have several influences on banks. Most importantly, failing to meet minimum capital ratios leads to severe repercussions, such as limitations on dividends and stricter regulatory oversight, and is (as you may imagine) deleterious to shareholder value. More subtly, capital requirements influence asset pricing decisions and balance sheet structure. That is, if two assets have the same interest rate but different risk weights, the value maximizing bank would seek to hold the asset with the lower risk weight. Stated differently, if a bank targets a specific return on equity, then the bank can accept a lower interest rate on an asset with a smaller risk weight and still achieve its overall return on equity objectives.

  1. Regulatory structure. In exchange for receiving a bank charter and deposit insurance, all facets of a bank’s operations are tightly regulated to protect the integrity of the banking system and, ultimately, the FDIC’s Deposit Insurance Fund that covers depositors of failed banks. Banks are rated under the CAMELS system, which contains categories for Capital, Asset Quality, Management, Earnings, Liquidity, and Sensitivity to Market Risk. Separately, banks receive ratings on information technology and trust activities. While a bank’s CAMELS score is confidential, these six categories provide a useful analytical framework for both regulators and investors.

Understanding the Balance Sheet

We now cover several components of a bank’s balance sheet.

Short-Term Liquid Assets and Securities

Banks are, by their nature, engaged in liquidity transformation, whereby funds that can be withdrawn on demand (deposits) are converted into illiquid assets (loans). Several alternatives exist to mitigate the risk associated with this liquidity transformation, but one universal approach is maintaining a portfolio of on-balance sheet liquid assets. Additionally, banks maintain securities as a source of earning assets, particularly when loan demand is relatively limited.

Liquid assets generally consist of highly-rated securities issued by the U.S. Treasury, various governmental agencies, and state and local governments, as well as various types of mortgage-backed securities. Relative to loans, banks trade off some yield for the liquidity and credit quality of securities. Key analytical considerations include:

  • Portfolio Size. While there certainly are exceptions, most high performing banks seek to limit the size of the securities portfolio; that is, they emphasize the liquidity features of the securities portfolio, while generating earnings primarily from the loan portfolio.
  • Portfolio Composition. The portfolio mix affects yield and risk. For example, mortgage-backed securities may provide higher yields than Treasuries, but more uncertainty exists as to the timing of cash flows. Also, the credit risk associated with any non-governmental securities, such as corporate bonds, should be identified.
  • Portfolio “Duration.” Duration measures the impact of different interest rate environments on the value of securities; it may also be viewed as a measure of the life of the securities. One way to enhance yield often is to purchase securities with longer durations; however, this increases exposure to adverse price movements if interest rates increase.

Loans

A typical bank generates most of its revenue from interest income generated by the loan portfolio; further, the lending function presents significant risk in the event borrowers fail to perform under the contractual loan terms. While loans are more lucrative than securities from a yield standpoint, the cost of originating and servicing a loan portfolio – such as lender compensation – can be significant. Key analytical considerations include:

  • Portfolio Composition. Bank financial statements include several loan portfolio categories, based on the collateral or purpose of each loan. Investors should consider changes in the portfolio over time and compare the portfolio mix to peer averages. Significant growth in a portfolio segment raises risk management questions, and regulatory guidance provides thresholds for certain types of real estate lending. Departures from peer averages may provide a sense of the subject bank’s credit risk, as well as the portfolio’s yield. Analysts may also wish to evaluate whether any concentrations exist, such as to certain industry niches or customer segments.
  • Portfolio Duration. Banks compete with other banks (and non-banks in some cases) on interest rate, loan structure, and underwriting requirements. Most banks will say they do not compete on underwriting requirements, such as offering higher loan/value ratios, which leaves rate and structure. To attract borrowers, banks may offer more favorable loan structures, such as longer-term fixed rate loans. Viewed in isolation, this exposes banks to greater interest rate risk; however, this loan structure may be entirely justified in light of the interest rate risk of the entire balance sheet.

Allowance for Loan & Lease Losses (“ALLL”)

Banks maintain reserves against loans that have defaulted or may default in the future. While a new regime for determining the ALLL will be implemented beginning for some banks in 2020, the size of the ALLL under current and future accounting standards generally varies between banks based on (a) portfolio size, (b) portfolio composition, as certain loan types inherently possess greater risk of credit loss, (c) the level of problem or impaired loans, and (d) management’s judgment as to an appropriate ALLL level. Calculating the ALLL necessarily includes some qualitative inputs, such as regarding the outlook for the economy and business conditions, and reasonable bankers can disagree about an appropriate ALLL level. Key analytical considerations regarding the ALLL and overall asset quality include:

  • ALLL Metrics. The ALLL – as a percentage of total loans, nonperforming loans, or loan charge-offs – can be benchmarked against the bank’s historical levels and peer averages. One shortcoming of the traditional ALLL methodology, which may or may not be remediated by the new ALLL methodology, is that reserves tend to be procyclical, meaning that reserves tend to decline leading into a recession (thereby enhancing earnings) but must be augmented during periods of economic stress when banks have less financial capacity to bolster reserves.
  • Charge-Off Metrics. The ALLL decreases by charge-offs on defaulted loans, while recoveries on previously defaulted loans serve to increase the ALLL. One of the most important financial ratios compares loan charge-offs, net of recoveries, to total loans. Deviations from the bank’s historical performance should be investigated. For example, are the losses concentrated in one type of lending or widespread across the portfolio? Is the change due to general economic conditions or idiosyncratic factors unique to the bank’s portfolio? Is a new lending product performing as expected?Charge-off ratios also provide insight into the amount of credit risk accepted by a bank, relative to its peer group. However, credit losses should not be viewed in isolation – yields matter as well. It is safe to assume, though, that higher than peer charge-offs, coupled with lower than peer loan yields, is a poor combination. While banks strive to avoid credit losses, a lengthy period marked by virtually nil credit losses could suggest that the bank’s underwriting is too restrictive, sacrificing earnings for pristine credit quality.
  • Loan Loss Provision. The loan loss provision increases the ALLL. A provision generally is necessary to offset periodic loan charge-offs, cover loan portfolio growth, and address risk migration as loans enter and exit impaired or nonperforming status.

Deposits

As for loans, bank financial statements distinguish several deposit types, such as demand deposits and CDs. It is useful to decompose deposits further into retail (local customers) and wholesale (institutional) deposits. Key analytical considerations include:

  • Portfolio Size. Deposit market share tends to shift relatively slowly; therefore, quickly raising substantial retail deposits is a difficult proposition. Banks with more rapid loan growth face this challenge acutely. Often these banks rely more significantly on rate sensitive deposits, such as CDs, or more costly wholesale funds. Therefore, analysts should consider the interaction between loan growth objectives and the availability and pricing of incremental deposits.
  • Composition. Investors generally prefer a high ratio of demand deposits, because these accounts usually possess the lowest interest rates, the lowest attrition rates and interest rate sensitivity, and the highest noninterest income. Of course, these accounts also are the most expensive to gather and service, requiring significant investments in branch facilities and personnel. With that said, other successful models exist. Some banks minimize operating costs, but offer higher interest rates to depositors.
  • Rate. Banks generally obtain rate surveys of their local market area, which provide insight into competitive conditions and the bank’s relative position. Also, it is useful to benchmark the bank’s cost of deposits against its peer group. Deposit portfolio composition plays a part in disparities between the subject bank and the peer group, as do regional differences in deposit competition.

Shareholders’ Equity and Regulatory Capital

Historical changes in equity cannot be understood without an equity roll-forward showing changes due to retained earnings, share sales and redemptions, dividends, and other factors. In our opinion, it is crucial to analyze the bank’s current equity position by reference to management’s business plan, as this will reveal amounts available for use proactively to generate shareholder returns (such as dividends, share repurchases, or acquisitions). Alternatively, the analysis may reveal the necessity of either augmenting equity through a stock offering or curtailing growth objectives.

The computation of regulatory capital metrics can be obtained from a bank’s regulatory filings. Relative to shareholders’ equity, regulatory capital calculations: (a) exclude most intangible assets and certain deferred tax assets, and (b) include certain types of preferred stock and debt, as well as the ALLL, up to certain limits.

Understanding the Income Statement

There are six primary components of the bank’s income statement:

  1. Net interest income, or the difference between the income generated by earning assets and the cost of funding.
  2. Noninterest income, which includes revenue from other services provided by the bank such as debit cards, trust accounts, or loans intended for sale in the secondary market. The sum of net interest income and noninterest income represents the bank’s total revenues.
  3. Noninterest expenses, which principally include employee compensation, occupancy costs, data processing fees, and the like. Income after noninterest expenses commonly is referred to by investors, but not by accountants, as “pre-tax, pre-provision operating income” (or “PPOI”).
  4. Loan loss provision
  5. Security gains and losses
  6. Taxes

Net Interest Income

The previous analysis of the balance sheet foreshadowed this net interest income discussion with one important omission – the external interest rate environment. While banks attempt to mitigate the effect on performance of uncontrollable factors like market interest rates, some influence is unavoidable. For example, steeper yield curves generally are more accommodative to net interest income, while banks struggle with flat or inverted yield curves.

Another critical financial metric is the net interest margin (“NIM”), measured as the yield on all earning assets minus the cost of funding those assets (or net interest income divided by earning assets). The NIM and net interest income are influenced by the following:

  • The earning asset mix (higher yielding loans, versus lower yielding securities)
  • Asset duration (longer duration earning assets usually receive higher yields)
  • Credit risk (accepting more credit risk should enhance asset yields and NIM)
  • Liability composition (retail versus wholesale deposits, or demand deposits versus CDs)
  • Liability duration (longer duration liabilities usually have higher interest rates)

Noninterest Income

The sensitivity of net interest income to uncontrollable forces – i.e., market interest rates – makes noninterest income attractive to bankers and investors. Banks generate noninterest income from a panoply of sources, including:

  • Fees on deposit accounts, such as service charges, overdraft income, and debit card interchange
  • Gains on the sale of loans, such as residential mortgage loans or government guaranteed small business loans
  • Trust and wealth management income
  • Insurance commissions on policies sold
  • Bank owned life insurance where the bank holds policies on employees

Some sources of revenue can be even more sensitive to the interest rate environment than net interest income, such as income from residential mortgage originations. Yet other sources have their own linkages to uncontrollable market factors, such as revenues from wealth management activities tied to the market value of account assets.

Expanding noninterest income is a holy grail in the banking industry, given limited capital requirements, revenue diversification benefits, and its ability to mitigate interest rate risk while avoiding credit risk. However, many banks’ fee income dreams have foundered on the rocks of reality for several reasons. First, achieving scale is difficult. Second, cross-sales of fee income products to banking customers are challenging. Third, significant cultural differences exist between, say, wealth management and banking operations. A fulsome financial analysis considers the opportunities, challenges, and risks presented by noninterest income.

Noninterest Expenses

In a mature business like banking, expense control always remains a priority.

  • Personnel expenses. Personnel expenses account for 50-60% of total expenses. Significant changes in personnel expenses generally are tied to expansion initiatives, such as adding branches or hiring a lending team from a competitor. Regulatory filings include each bank’s full-time equivalent employees, permitting productivity comparisons between banks.
  • Occupancy expenses. With the shift to digital delivery of banking services, occupancy expenses have remained relatively stable for many community banks, while larger banks have closed branches. Nevertheless, banks often conclude that entering a new market requires a beachhead in the form of a physical branch location.
  • Other expenses. Regulatory filings lump remaining expenses into an “other” category, although audited financial statements usually provide greater detail. More significant contributors to the “other” category include data processing and information technology spending, marketing costs, and regulatory assessments.

Loan Loss Provision

We covered this income statement component previously with respect to the ALLL.

Income Taxes

Banks generally report effective tax rates (or actual income tax expense divided by pre-tax income) below their marginal tax rates. This primarily reflects banks’ tax-exempt investments, such as municipal bonds; bank-owned life insurance income; and vehicles that provide for tax credits, like New Market Tax Credits. It is important to note that state tax regimes may differ for banks and non-banks. For example, some states assess taxes on deposits or equity, rather than income, and such taxes are not reported as income tax expense.

Return Decomposition

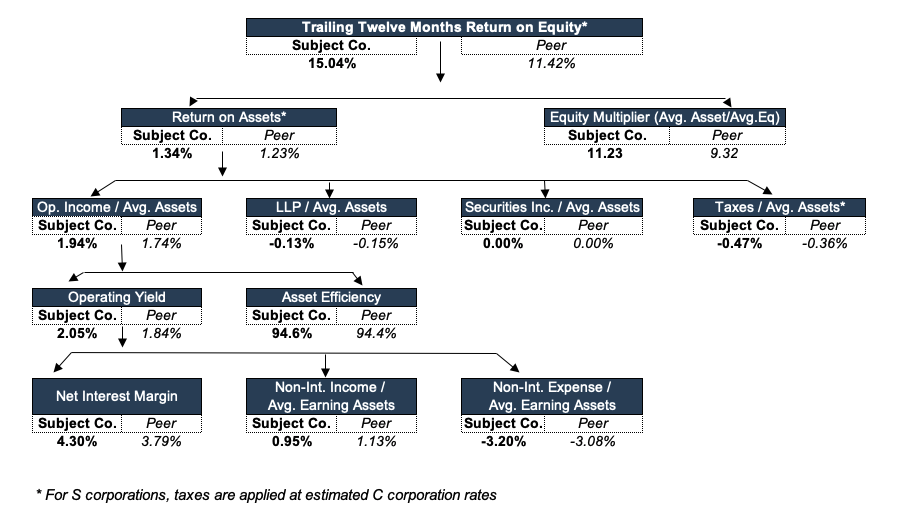
As the preceding discussion suggests, many levers exist to achieve shareholder returns. One bank can operate with lean expenses, but pay higher deposit interest rates (diminishing its NIM) and deemphasize noninterest income. Another bank may pursue a true retail banking model with low cost deposits and higher fee income, offset by the attendant operating costs. There is not necessarily a single correct strategy. Different market niches have divergent needs, and management teams have varying areas of expertise. However, we still can compare the returns on equity (or net income divided by shareholders’ equity) generated by different banks to assess their relative performance.

The figure below presents one way to decompose a bank’s return on equity relative to its peer group. This bank generates a higher return on equity than its peer group due to (a) a higher net interest margin, (b) a slightly lower loan loss provision, and (c) higher leverage (shown as the “equity multiplier” in the table).

Income Statement Metrics

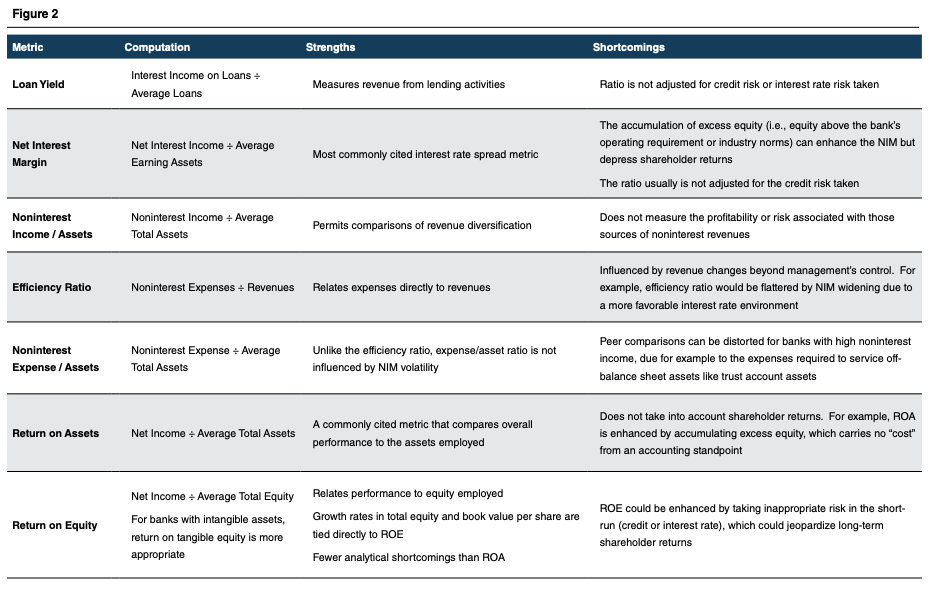
The figure below cites several common income statement metrics used by investors, as well as their strengths and shortcomings.

Sources of Information

Banks file quarterly Call Reports, which are the launching pad for our templated financial analyses. Depending on asset size, bank holding companies file consolidated financial statements with the Federal Reserve. All bank holding companies, small and large, file parent company only financial statements, although the frequency differs. Other potentially relevant sources of information include:

  1. Audited financial statements and internal financial data
  2. Board packets, which often are sufficiently extensive to cover our information requirements
  3. Budgets, projections, and capital plans
  4. Asset quality reports, such as criticized loan listings, delinquency reports, concentration analyses, documentation regarding ALLL adequacy, and special asset reports for problem loans
  5. Interest rate risk scenario analyses and inventories of the securities portfolio
  6. Federal Reserve form FR Y-6 provides the composition of the holding company’s board of directors and significant shareholders’ ownership

Conclusion

A rigorous examination of the bank’s financial performance, both relative to its history and a relevant peer group and with due consideration of appropriate risk factors, provides a solid foundation for a valuation analysis. As we observed in June’s BankWatch, value is dependent upon a given bank’s growth opportunities and risk factors, both of which can be revealed using the techniques described in this article.

Given the variety of business models employed by banks, this article is inherently general. Some factors described herein will be more or less relevant (or even not relevant) to a specific bank, while it is quite possible that, for the sake of brevity, we altogether avoided mention of other factors relevant to a specific bank. Readers should therefore conduct their own analysis of a specific bank, taking into account its specific characteristics.


Originally published in Bank Watch, August 2019.


About the Author