

In August 2025, the U.S. auto industry slowed as the SAAR of 16.1 million units represented a 2.9% decrease from the prior month. However, the trend of year-over-year increases continued, as eleven of the past twelve months have beat the prior year, with a 6.2% increase from August 2024. The August 2025 performance is particularly impressive given the inflated baseline from the previous year's CDK software outage that shifted sales into July and August 2024.
The industry continues to navigate a complex landscape marked by persistent tariff uncertainties and affordability challenges. The tariff environment has become a focal point in recent industry discussions and remains volatile, with ongoing negotiations and potential extensions creating uncertainty for both manufacturers and consumers, particularly as model year 2026 vehicles are set to hit dealership lots. Compounding this, manufacturers have reduced incentive spending, which has further slowed sales momentum, posing challenges for maintaining growth into the latter half of 2025.
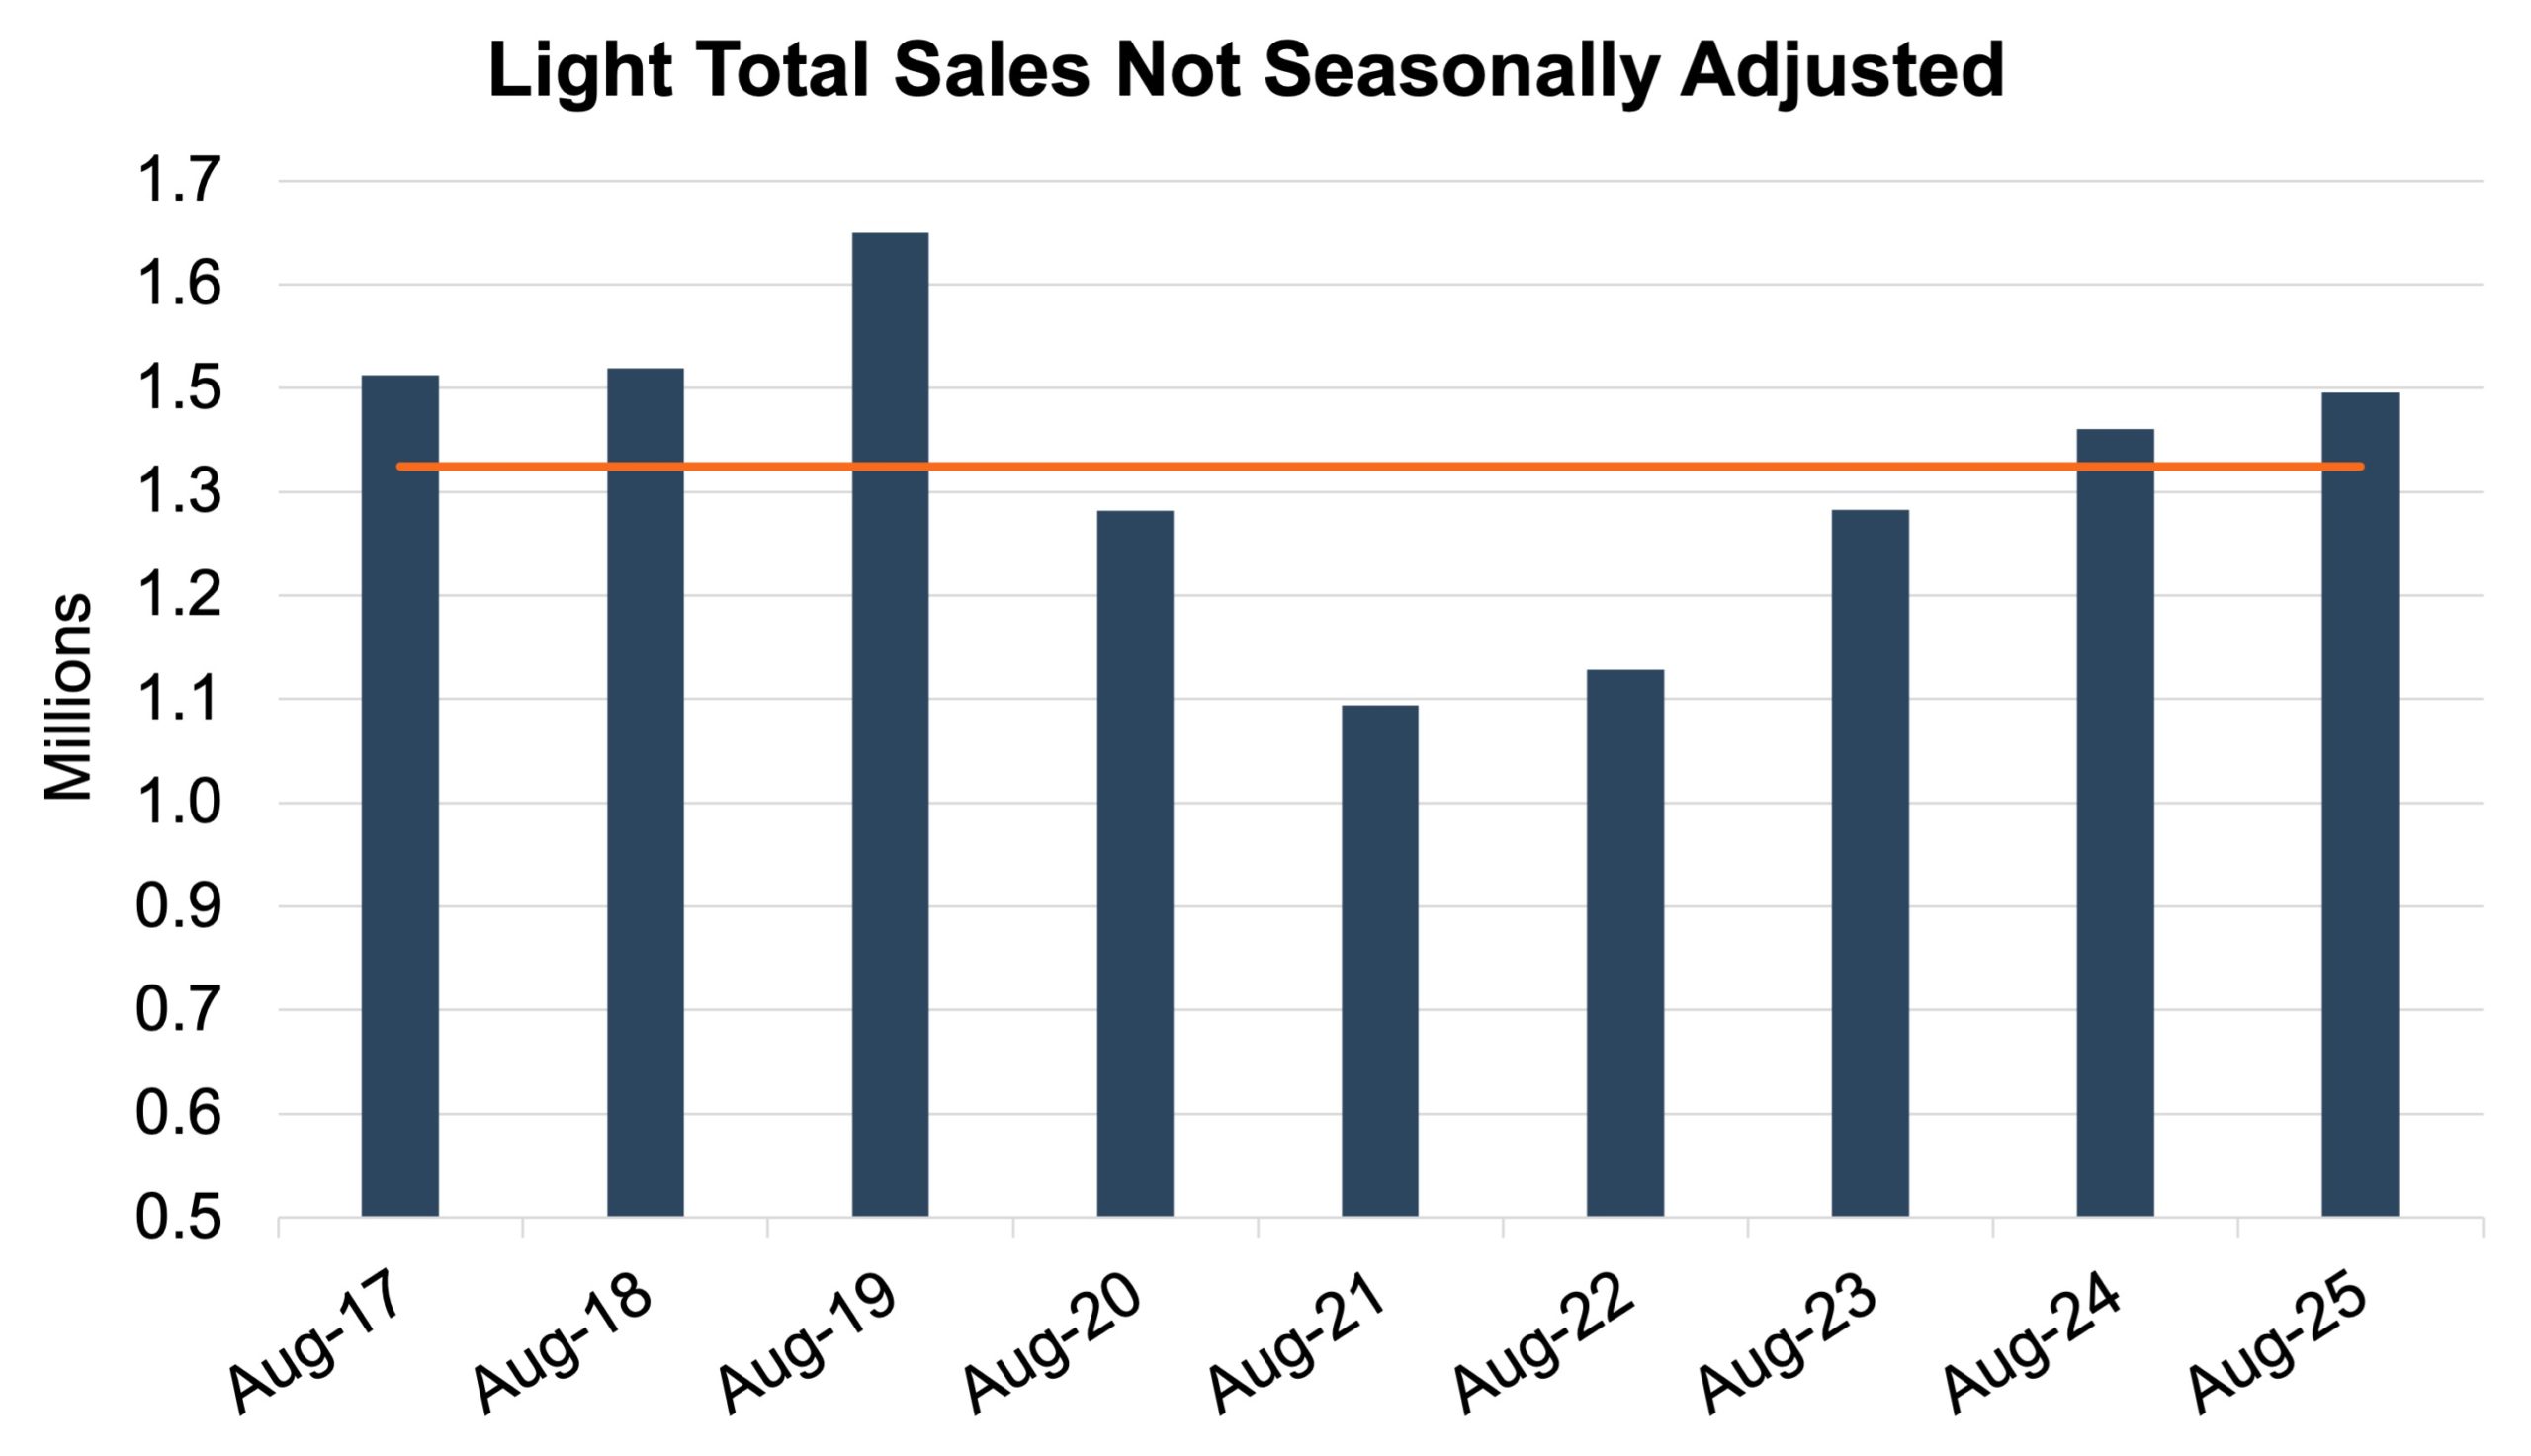
Unadjusted Sales Data
On an unadjusted basis, August 2025 industry sales finished at 1.45 million units, a 5.3% increase from last month and a 3.0% increase from August 2024. This growth was bolstered by the inclusion of Labor Day in the August reporting period, which typically boosts sales through promotions and plays a role in the difference between the unadjusted and adjusted performance. This month’s unadjusted sales exceeded the nine-year August average of 1.37 million units (2017 – 2025) by approximately 85 thousand units. See the chart below for a look at unadjusted sales over the last nine Augusts.
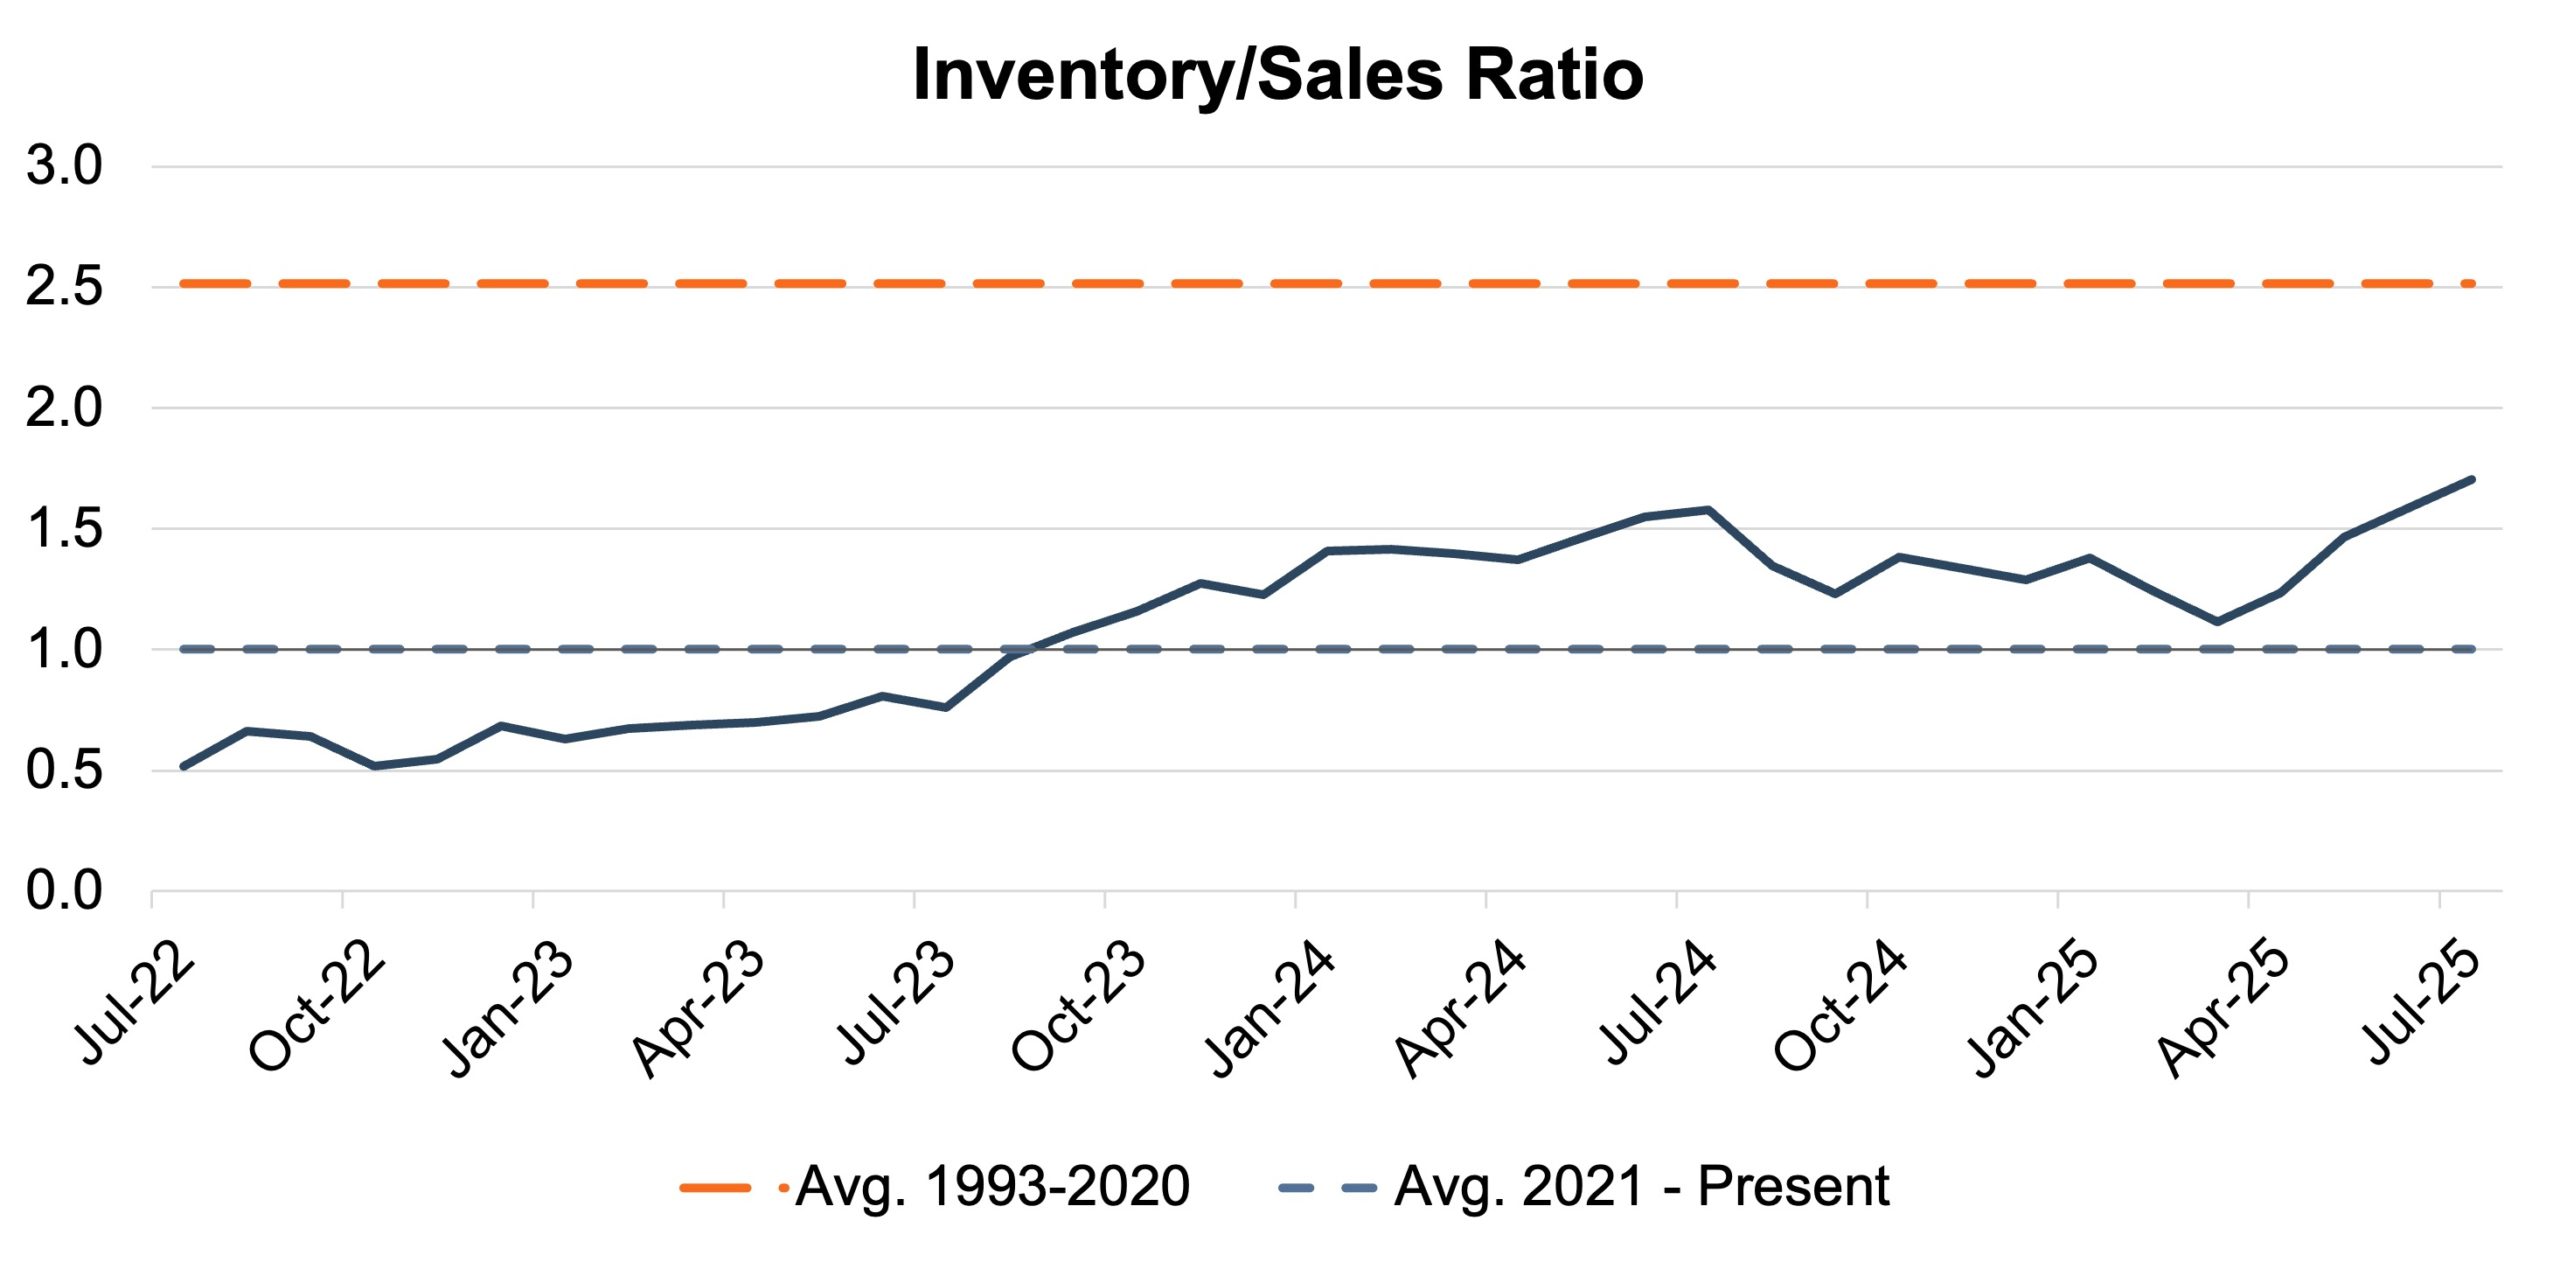
Inventory Metrics
In August 2025, the auto industry's inventory-to-sales ratio climbed to 1.70x from 1.59x in July, the highest since February 2021 (pre-chip shortage). Looking forward, we expect the ratio to hold above 1.0x, driven by the introduction of pricier inventory and pressure on consumer purchasing power. However, we find it unlikely that the industry fully reverts to pre-2020 averages. The chart below presents the industry’s inventory-to-sales ratio over the last three years.
 Brand-level days’ supply data from Cox Automotive offers a more granular perspective on how manufacturers are handling their supply chains, emphasizing that a dealer’s inventory situation is increasingly shaped by the specific OEM or brand rather than the industry-wide average. See the chart below for a look at days’ supply by brand in August 2025.
 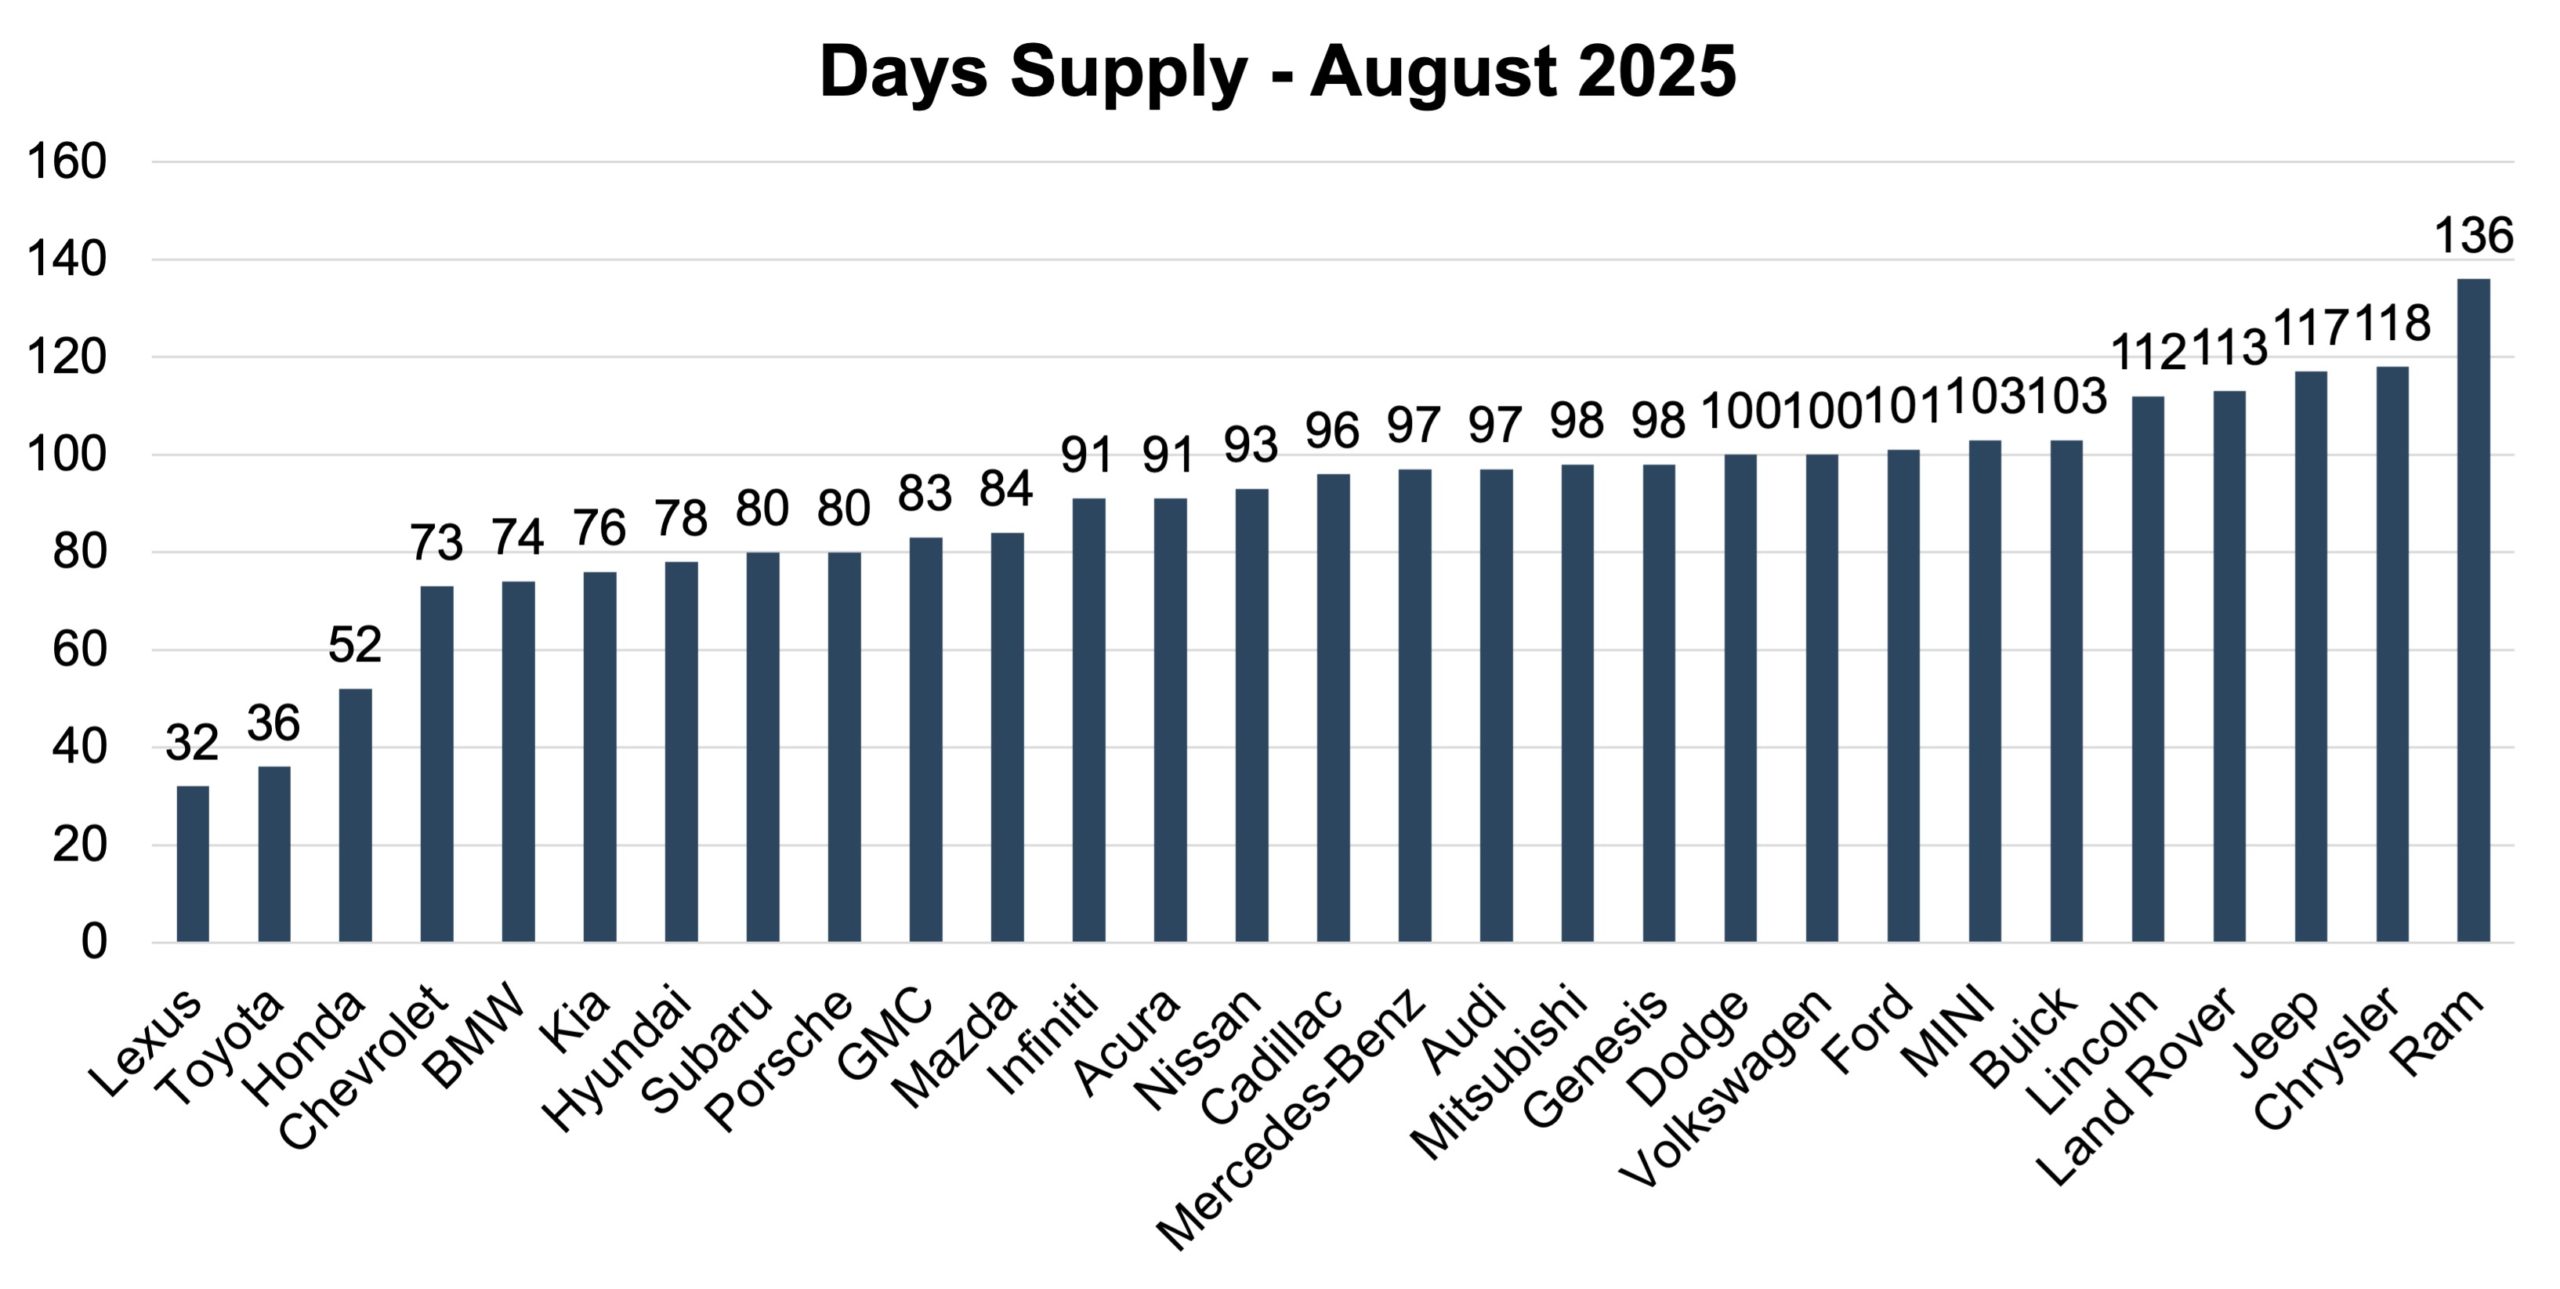 Inventory management continues to emerge as a key differentiator among OEMs. Evaluating franchise worth now requires a closer examination of how effectively a brand maintains operational steadiness. Lexus (32 days) and Toyota (36 days) remain notable for their effective inventory control strategies. Their low days’ supply figures indicate quicker retail turnover and a closer match between production and consumer demand. This lean supply approach is in contrast with the current trend where nearly all manufacturers have resumed production levels that may not optimize dealer profitability. Brands like Land Rover (113 days), Jeep (117 days), Chrysler (118 days), and Ram (136 days) are holding significantly larger inventory stocks. These high days’ supply numbers may stem from slower demand, overly ambitious production goals, or low incentive spending, potentially undermining dealership efficiency.
Transaction Prices
According to J.D. Power and GlobalData, the average new-vehicle retail transaction price in August 2025 is projected to be around $44,750, an increase of approximately 2.2% from August 2024. This rise is influenced by factors including relatively stable MSRPs, tariff pressures, and retailer profitability
Incentive Spending and Profitability
Thomas King, the president of data and analytics at J.D. Power, discussed the factors impacting incentive spending and profitability in August:
“This year, manufacturers have kept incentives restrained due to tariffs. Normally, incentives as a percentage of MSRP increase by about half a point from January through late summer, but this year they’ve slipped to 6.2% in August from 6.3% in January, underscoring the effect of tariff-related cost pressures.
With this in mind, total retailer profit per unit, encompassing vehicle gross and finance/insurance income, is projected at $2,202, a slight drop (-$7) from August 2024 but a $10 increase from July 2025. This change in per-unit profitability considers a mix of not only lower incentive spending, but also higher sales volumes, growing transaction prices, and other factors.
September 2025 outlook
After it felt like we reached the light at the end of the tunnel on supply chain issues, tariffs present a new wrinkle. Most auto executives indicated OEMs are actively seeking to optimize post-tariff pricing in their supply chain, which may have near-term ripple effects on supply. In the other direction, raising price points could cool demand. We anticipate the September 2025 SAAR to be in line with recent months, at or modestly above 16 million.
Mercer Capital provides business valuation and financial advisory services, and our auto team helps dealers, their partners, and family members understand the value of their business. Contact a member of the Mercer Capital auto dealership team today to learn more about the value of your dealership.