2022 Auto Dealer Industry Metrics Review
Has Profitability Peaked?


As we turn the calendar to March, 2022 is in the rearview mirror, and year-end statistics for the auto industry have been released. How did the industry perform, and what do the metrics tell us about the direction of the industry in 2023? In this post, we discuss the key metrics we track for the industry: new vehicle profitability, the supply of new vehicles, average trade-in equity values of used vehicles, the used-to-new vehicle retail unit sales ratio, fleet sales, and vehicle miles traveled.
New Vehicle Profitability
Total retailer profit per unit realized by auto dealers continues to remain strong despite a trio of trends: demand may be cooling, incentives offered by manufacturers have increased slightly, and vehicle supply continues to improve. But has this metric peaked? The graph below illustrates the current and historical estimates (provided by the JD Power and LMC Automotive forecasts) that have declined since the year-end high-water mark of $5,258 at December 2021. While these figures have cooled in recent months, the February 2023 figure of $3,820 per new vehicle unit is still almost double the margin that dealers were experiencing in December 2020 and more than three times the margin realized in December 2019.
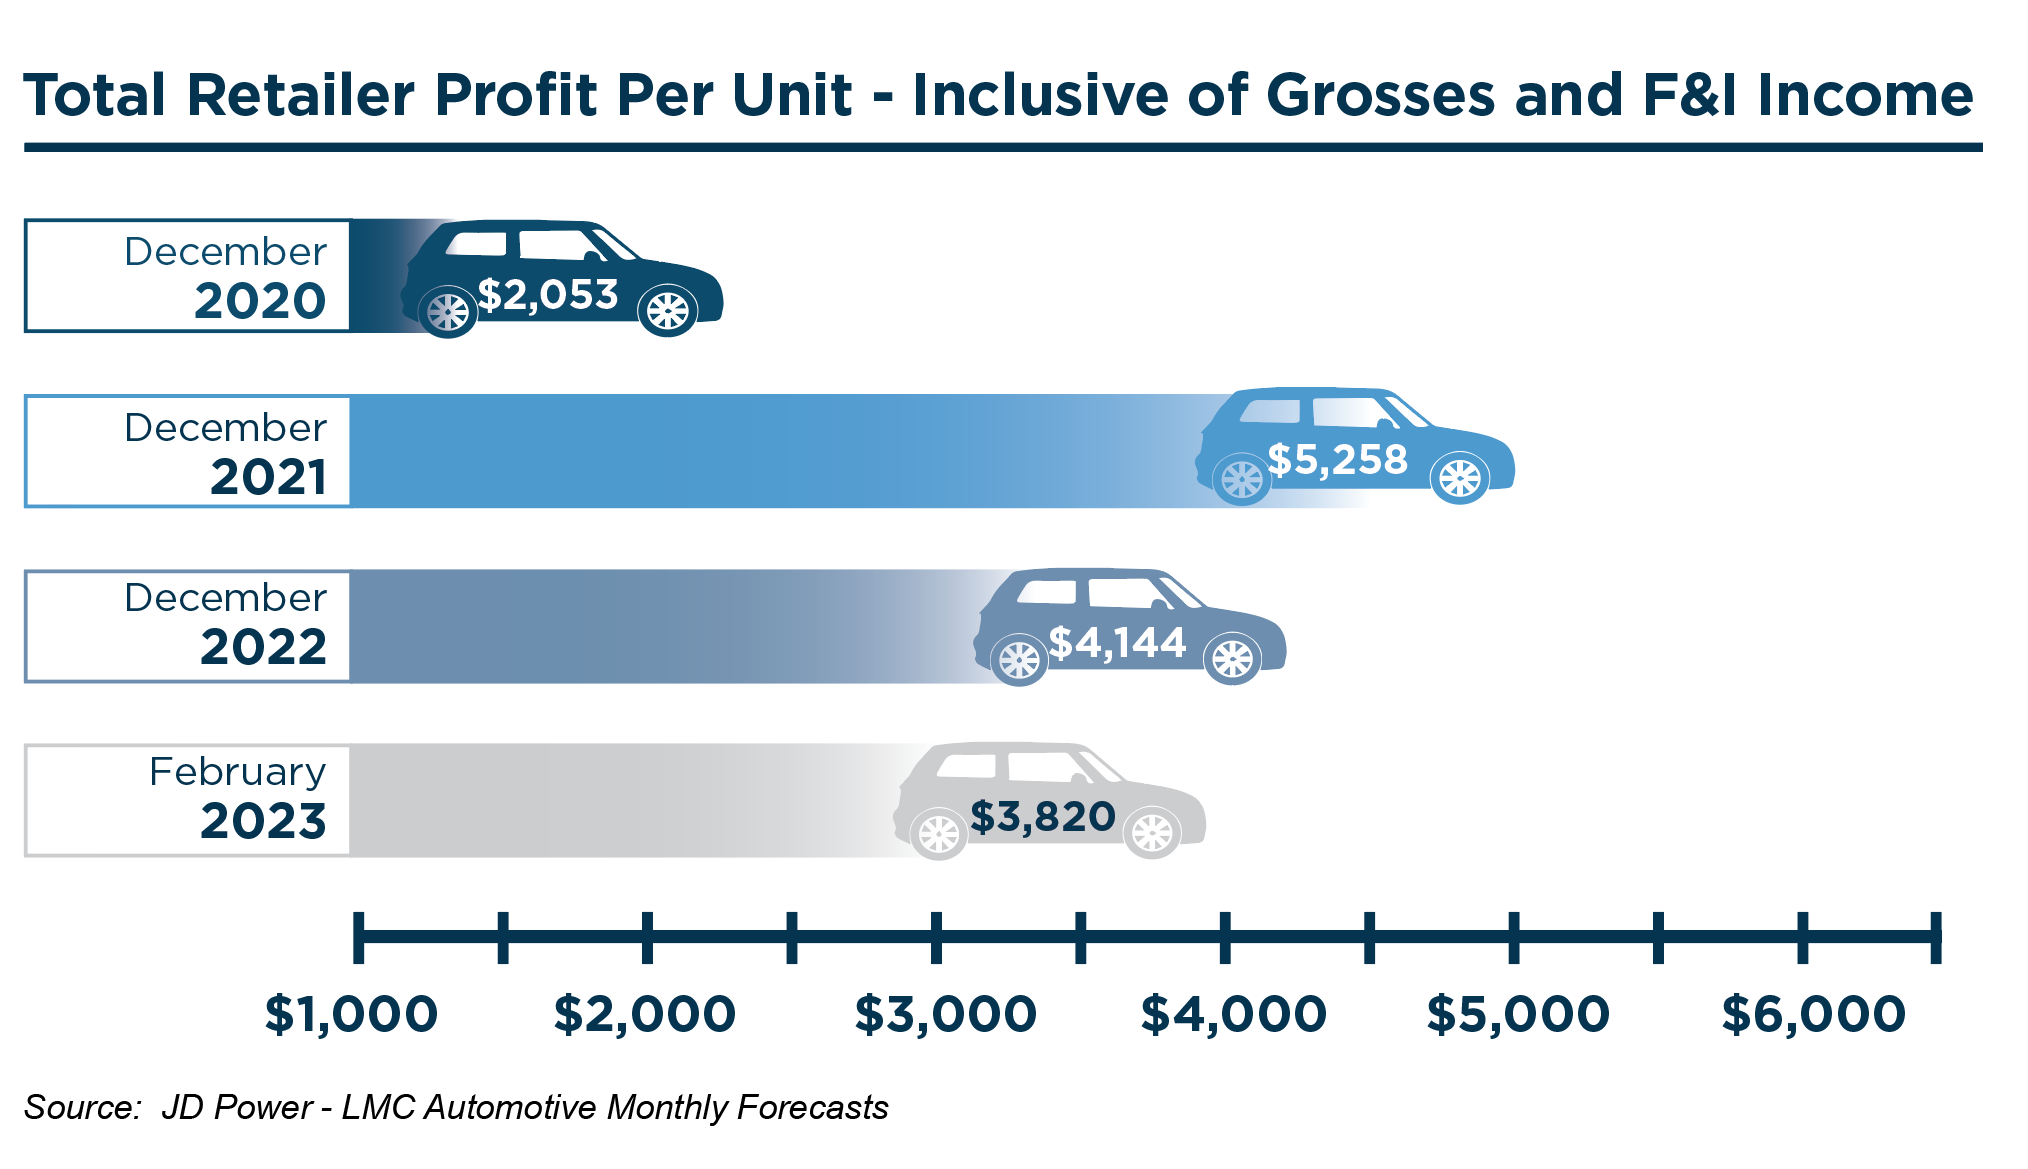
For context, JD Power reports that 37% of new vehicles sold above MSRP in December 2022, compared to 50% of new vehicles selling above MSRP in July 2022. If these trends continue along with increased incentives from manufacturers, average transaction prices for new vehicles could cool slightly in 2023, despite inflation and increased input costs for the OEMs.
Supply of New Vehicles
For the last couple of years, evidence of a tight supply of new vehicles could be seen in the lack of inventory on auto dealer lots across the country. We’ve written about average days’ supply for both new and used vehicles in this space on numerous occasions. We’ve also viewed this trend from a similar metric that measures the average days a new vehicle sits on a dealer’s lot before it is purchased. The monthly forecasts provided by JD Power/LMC Automotive report these figures as 23 days and 29 days as of December 2022 and February 2023, respectively. Both figures indicate a steady climb and slight improvement over the prior-year-end low of 17 days at December 2021. While most experts are cautiously optimistic that the auto OEMs will not revert back to the historical levels of production and inventory, the graph below shows the context of the latest two figures to historical year-end figures:
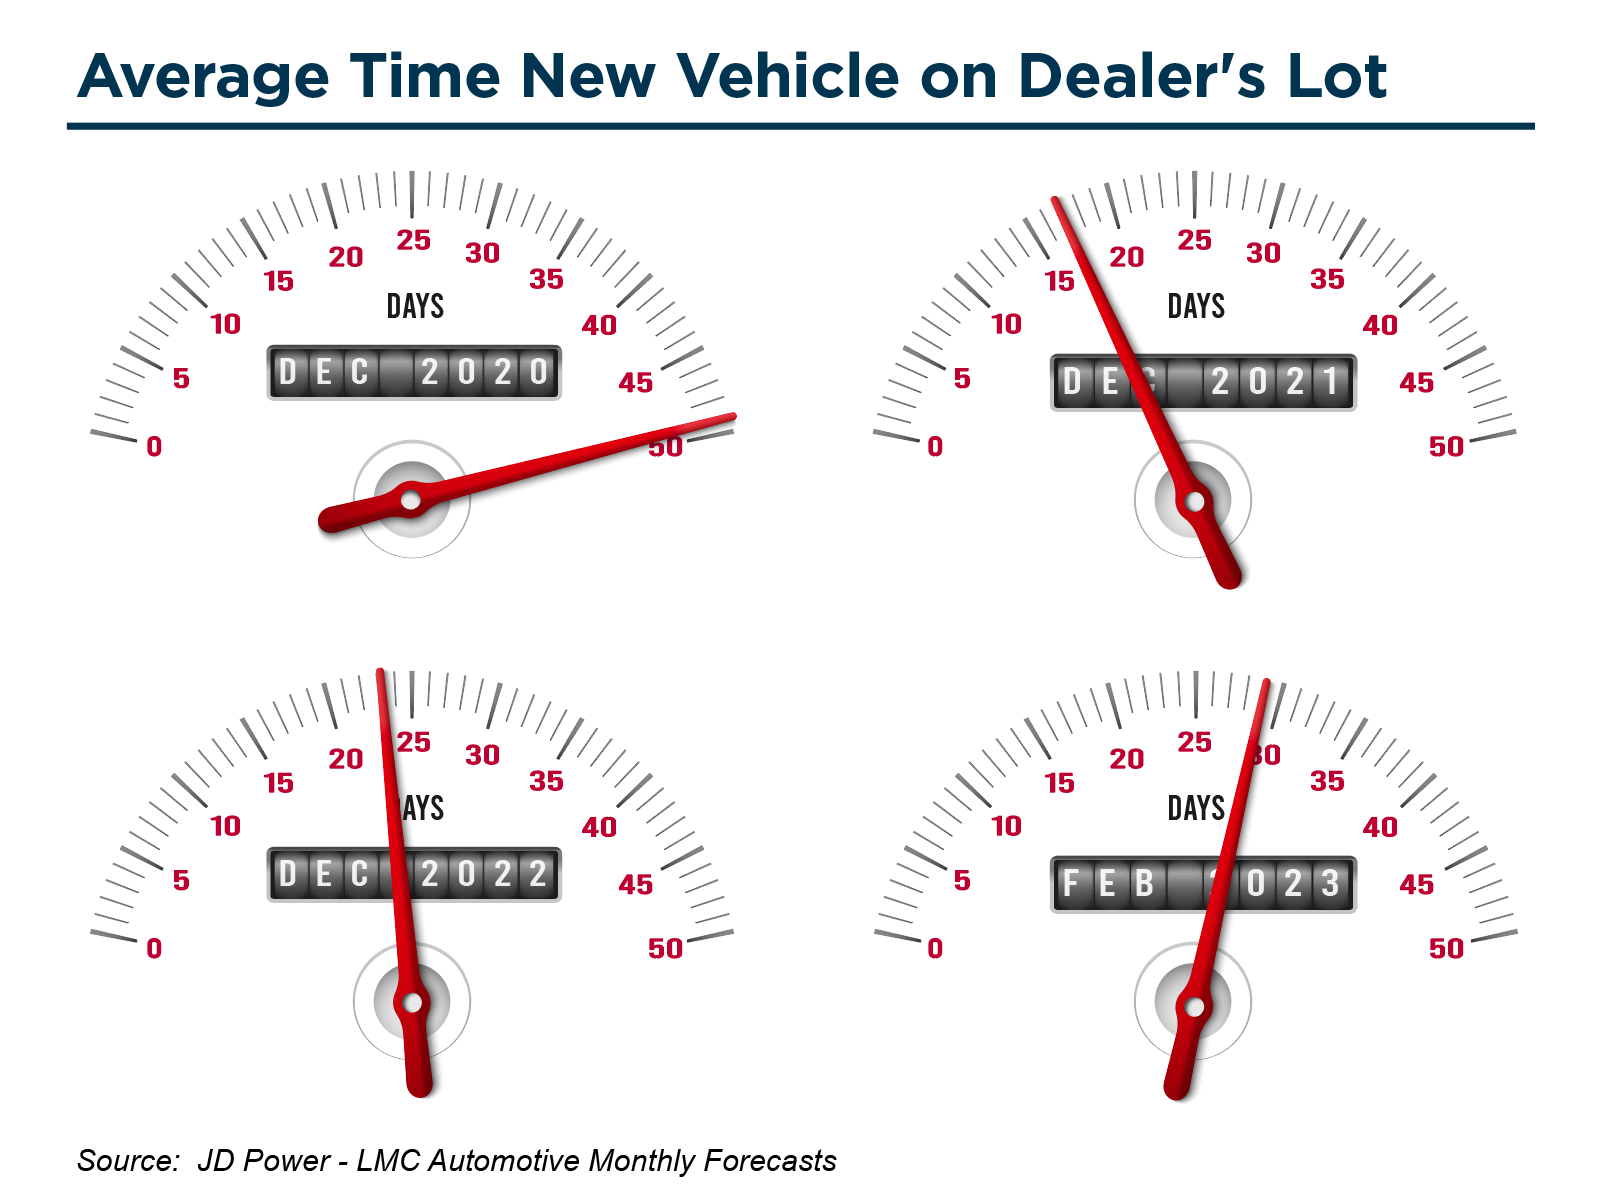
Embedded within these average day figures, dealers continue to pre-sell a large portion of their reduced vehicle allocations during this post-pandemic transition and recovery from the microchip shortage. JD Power indicates that 47% of new vehicles are actually selling within ten days of arriving on a dealer’s lot. For context, this percentage is down from 57% of new vehicles sold within the first ten days on the lot in March 2022.
Average Trade-In Equity Used Vehicles
Like new vehicles, used vehicle transaction prices also soared during 2022 but have cooled some recently. Since fewer new vehicle units have been available to sell over the last few years, fewer used vehicles are traded into the dealer for resell. Increased demand for used vehicles led the average trade-in equity value for used cars to climb during the same period. Like the other trends discussed in this post, the average trade-in equity value for used vehicles also appears to be softening at the end of 2022 and early 2023. According to the monthly forecasts from JD Power/LMC Automotive, the average trade-in equity value totaled $9,316 and $8,895 for December 2022 and February 2023, respectively.
With rising interest rates, consumers tend to focus more on monthly payments. Despite average used vehicle transaction prices cooling slightly, we anticipate many consumers will choose to hold on to their vehicles longer during this time. As such, if the average trade-in equity value of used vehicles continues to decline, we expect it to impact transaction prices similarly. With vehicles depreciating more quickly from the elevated purchase prices experienced in the last couple of years, more consumers may be “upside down” on their used vehicles if the trade-in value declines below their remaining loan balance. We expect this will be a hindrance to purchasing a new vehicle or a newer used vehicle. The question becomes how much this will affect demand. If vehicle prices and interest rates remain elevated, it will be difficult to roll negative equity into a higher loan balance when consumers trade in without materially increasing monthly payments.
Used-To-New Vehicle Unit Ratio (Retail Only)
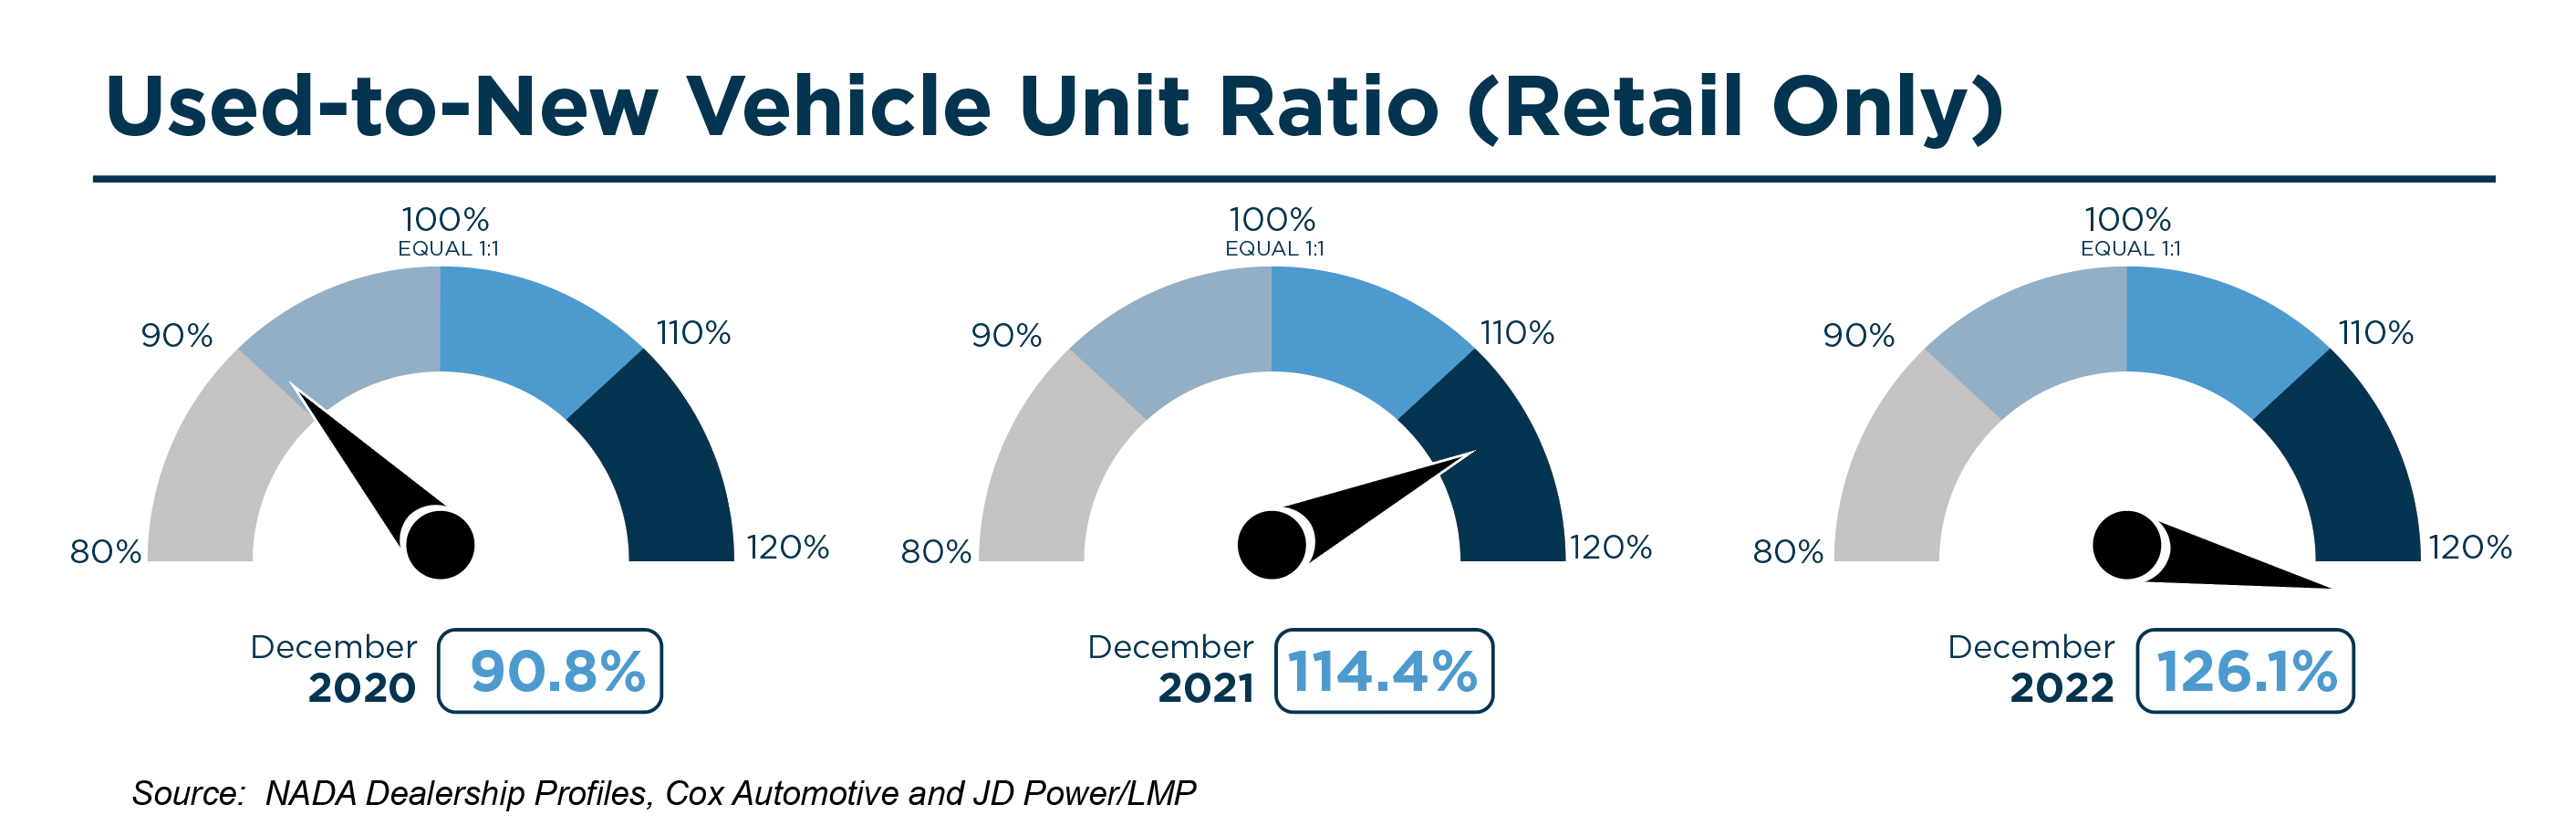
The graph below depicts the ratio of used and new vehicle units retailed.
Click here to expand the image above
Historically, the gap between profits per unit earned on used and new vehicles was wider. For several years, auto dealers have been making nearly as high margins on new vehicles as used vehicles. Despite improvements in production and supply, this ratio continues to be impacted by those conditions and the slow recovery from the microchip shortage. While average transaction prices for new and used vehicles continued to climb during the second half of 2022, most experts predict that average transaction prices for new and used vehicles will cool slightly in 2023. With those conditions and the moderate improvement in new vehicle supply that is expected to continue in 2023, we expect the ratio of used to new vehicles to decline in the coming years.
Fleet sales
Fleet sales consist of sales to large rental car companies, commercial users, and government agencies. Historically, fleet sales allowed auto dealers to sell surplus inventory and to sell larger blocks of units at a time. While fleet sales typically occurred at reduced margins compared to retail sales, they allowed auto dealers to put more vehicles in service to hopefully benefit the fixed operations of an auto dealer as those vehicles will eventually require service maintenance and parts. It also frees up capital for dealers to redeploy into inventory that will either sell at higher margins or turnover more quickly. Auto dealers anticipate that buyers of new vehicles will continue to return to the same dealership for those services during the lifetime of the warranty period and hopefully beyond.
During the height of the pandemic, fleet sales declined significantly. Rental car companies weren’t just canceling orders; they actively sold off their existing fleet to build up cash as cities endured temporary shutdowns and much of domestic travel was halted or significantly curbed. With travel returning and inventory supply improving, fleet sales are steadily increasing. As seen in the graphic below, monthly fleet sales for December 2022 were estimated to be 209,200, the highest year-end total since December 2020.
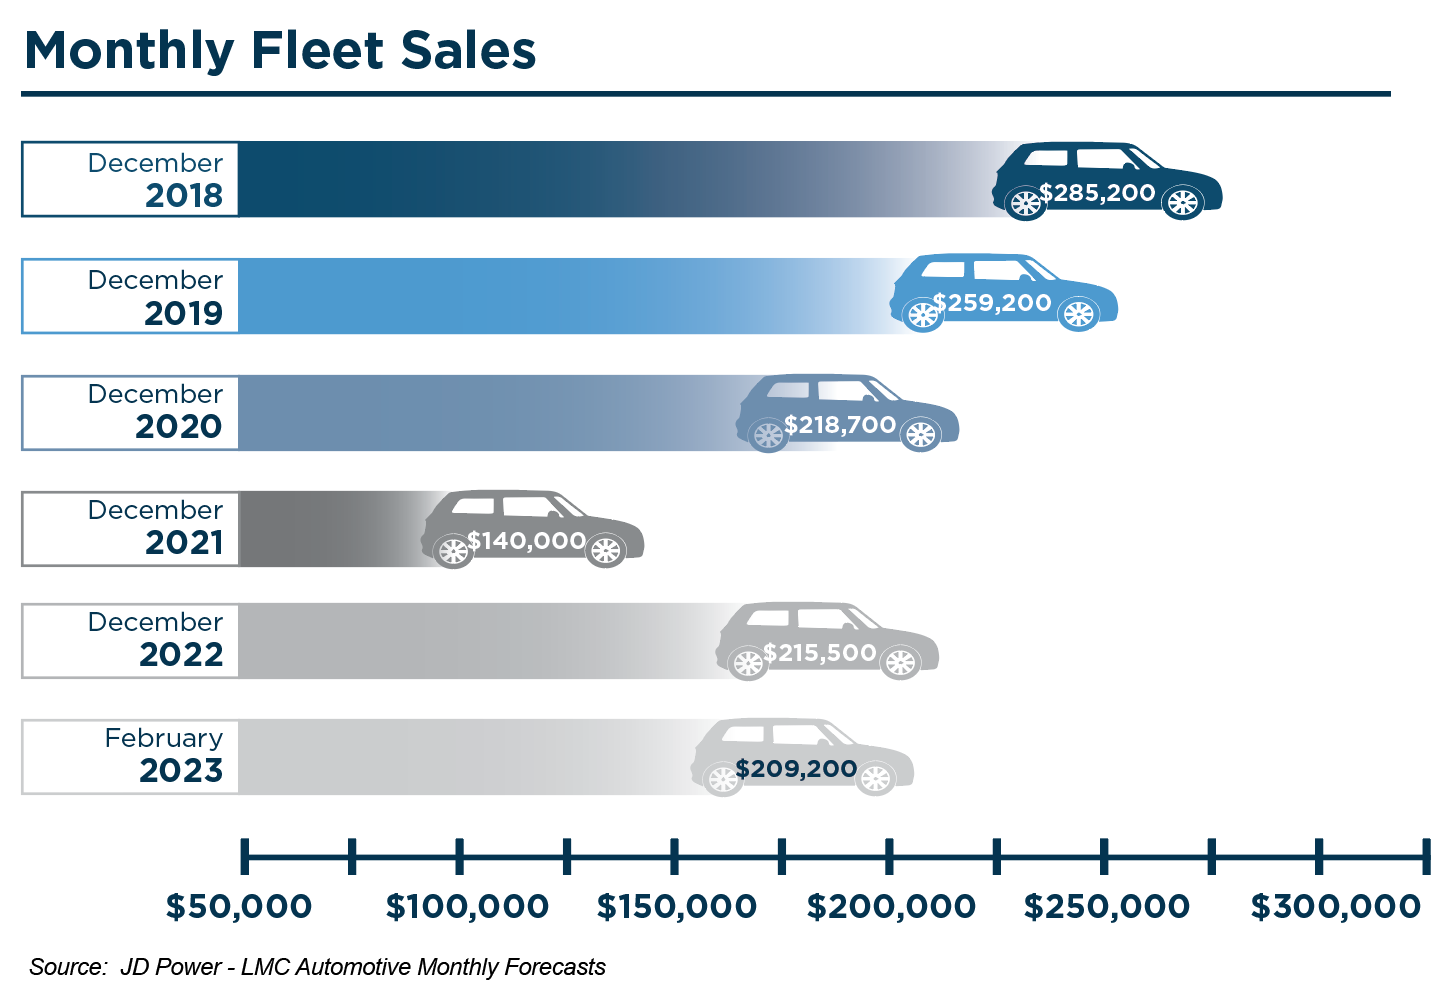
Continuing the trend into 2023, January and February have posted strong fleet sales estimates at 183,300 and 209,200, respectively. While January and February’s figures are stronger than the last several years, they still fall short of early-year levels in 2019 and 2020. It should be noted that, historically, monthly fleet sales are strongest at year-end and the early part of the following year as dealers look to move the prior year’s inventory.
Vehicle Miles Traveled
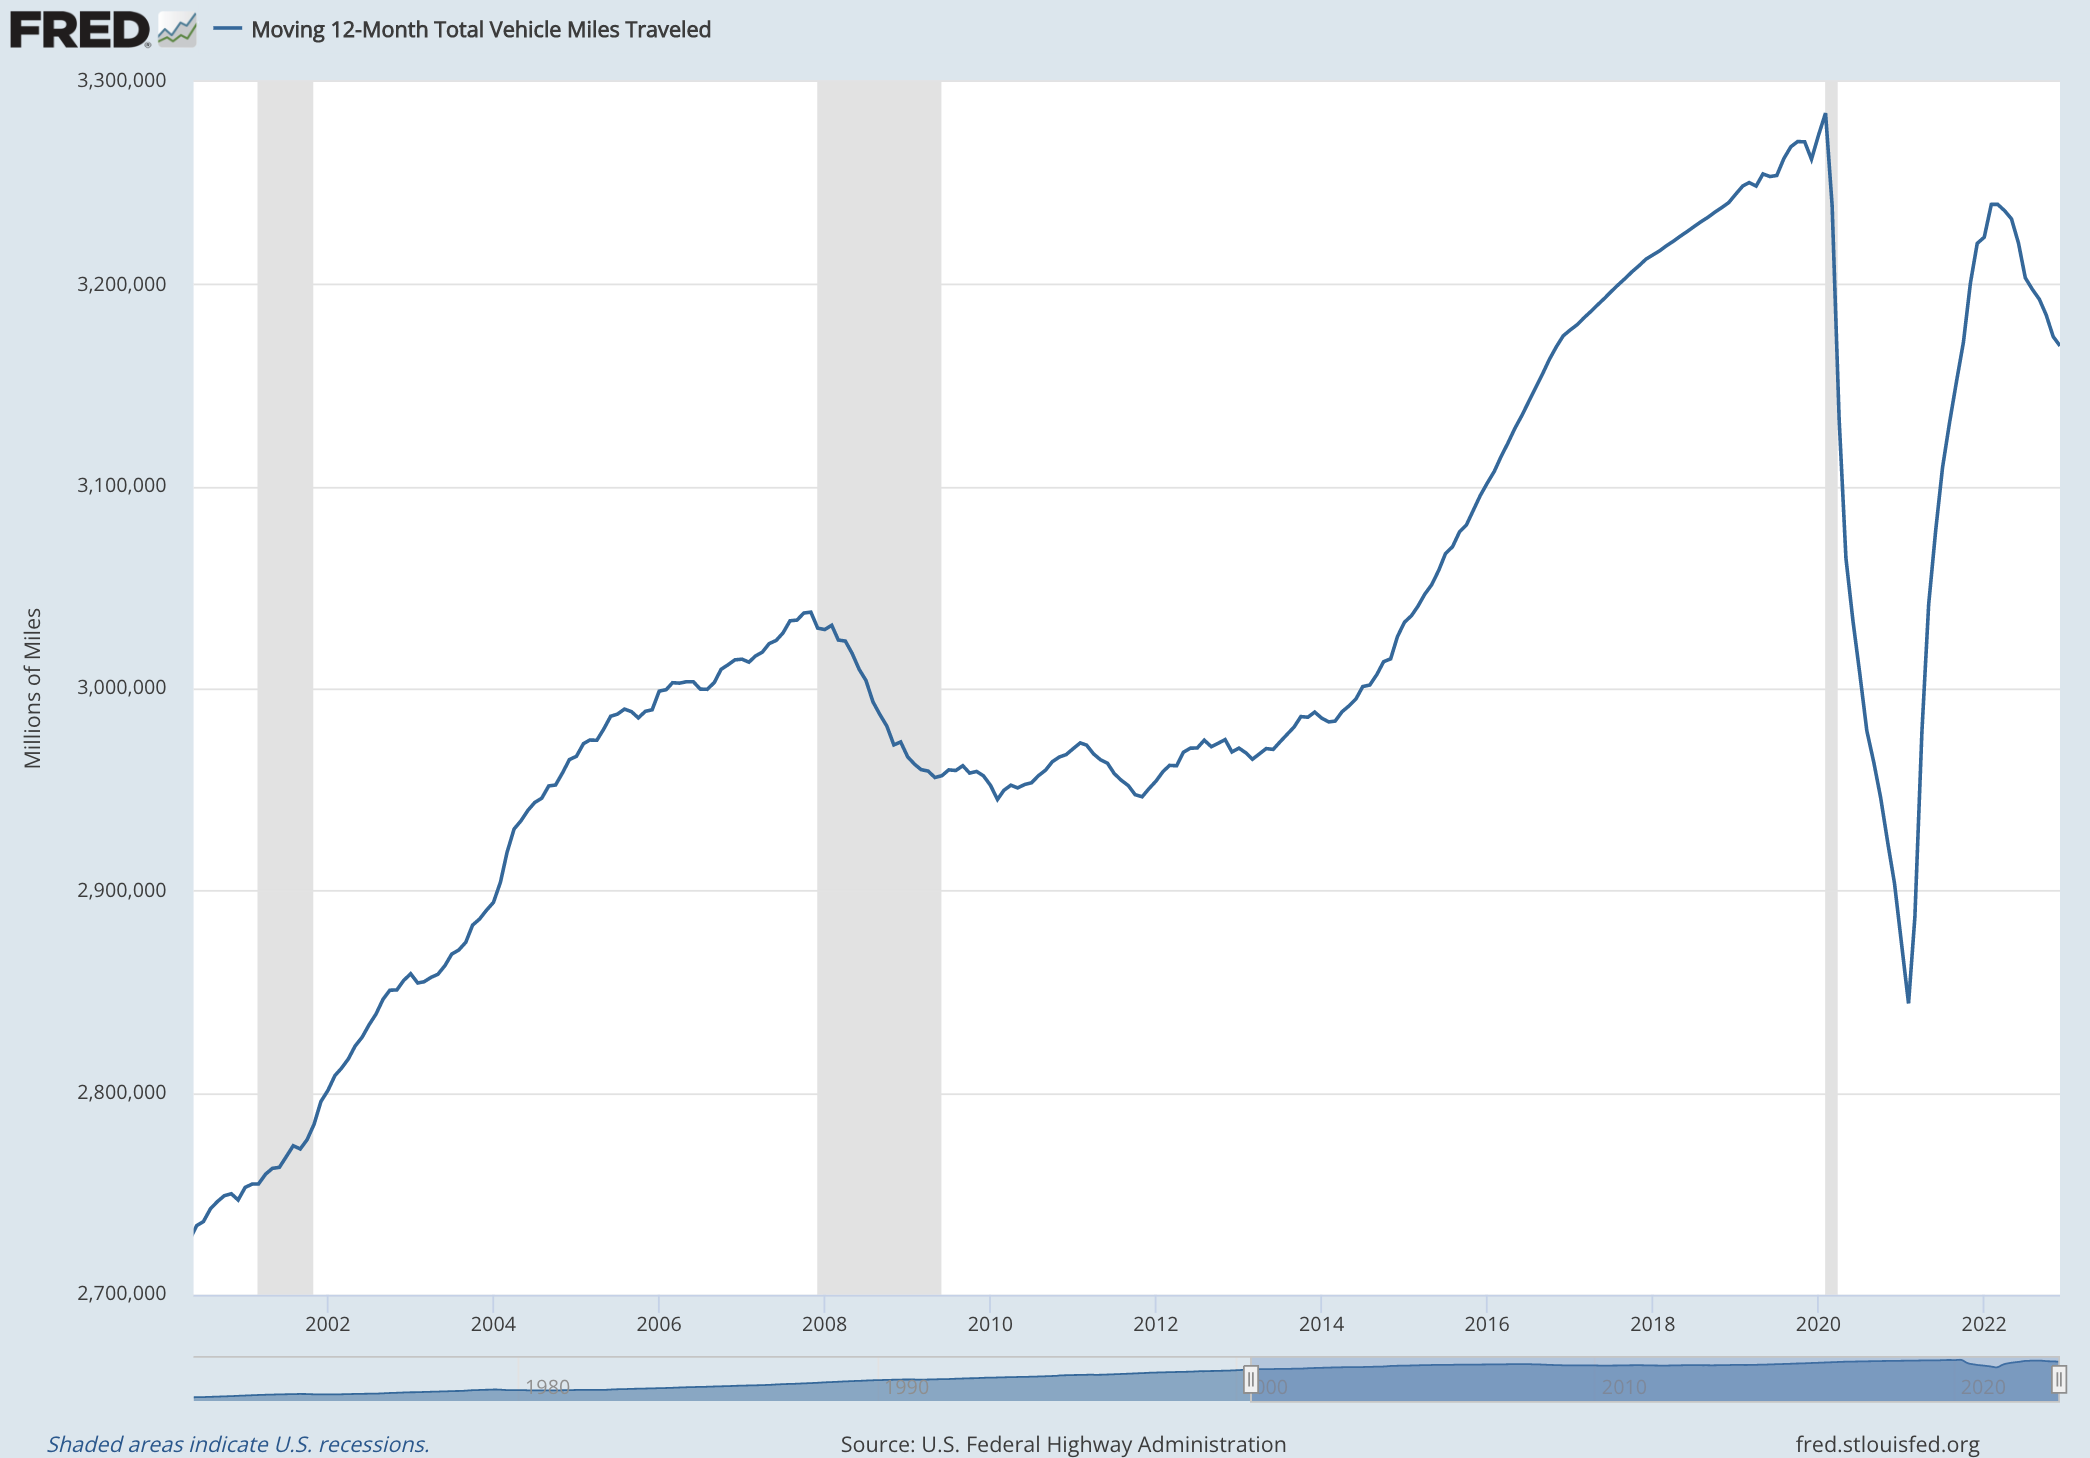
Another key indicator that portrays the health of the automotive industry is the number of miles driven or vehicle miles traveled (“VMT”). As with the number of vehicles in service, the number of miles driven contributes to the fixed operations of an auto dealer as vehicles will require more parts and service as they are driven more frequently or for longer distances. Increased miles will also lead to the eventual purchase of a new vehicle from the new or used vehicle inventory. VMT has been tracked since 1971, and a graphical view of the rolling 12-month average from 2000 through current can be seen below:
Click here to expand the image above
Over time, VMT has generally increased as the population has grown and more vehicles have been put in service. Since 1971, there have only been a few occasions where the rolling-12 month average has declined, which, as you’ll note, tend to correlate with recessions: 1974, brief periods in the late 1970s and the early 1980s, the Great Recession in 2008 and 2009, and the pandemic in 2020. During the height of the pandemic, the rolling-12 month VMT average dropped below 3 trillion miles for the first time since mid-2014 and even below 2.8 trillion for the first time since the early 2000s. The rolling-12 month average bottomed out in February 2021 at approximately 2.77 trillion miles but steadily climbed back to 3.23 trillion miles in March 2022, indicating almost a full recovery to the high water mark of 3.28 trillion miles in February 2020.
So how did the rolling 12-month average fare in the second half of 2022? Vehicle miles traveled have plateaued and declined to approximately 3.17 trillion miles as of December 2022. Perhaps this indicates some of the impacts following the great resignation and increased numbers of workers that either work remotely full-time or on a part-time basis. Those workers have much fewer miles to commute than before the pandemic.
An auto dealership’s service and parts department usually performs somewhat counter-cyclically to other departments during economic downturns and recessions. As discussed in this post, when consumers face pricing pressures, higher interest rates, and economic uncertainty, they often choose to hold on to their vehicles for a longer time, forcing the need for increased service work. Auto dealers would be wise to focus on the service and parts department if profits are normalizing on the sale of new and used vehicles. The service and parts department has historically performed as one of the highest profit centers in the overall dealership.
Conclusions
2022 marked another very successful year for auto dealers. Most of the metrics discussed in this post seem to have peaked at some point during 2022 and are shifting in the other direction. Does this signal that profitability has peaked? Will increasing volumes compensate for declining unit economics? Only time will tell. Despite cooling metrics, dealers can be optimistic that profitability and other trends continue to experience heightened levels over pre-pandemic figures, sometimes still in the magnitude of two or three times higher.
For an understanding of how your dealership is performing, along with an indication of what your dealership is worth, contact a professional at Mercer Capital to perform a valuation or analysis.