Analyzing Sources of Peer Information for Auto Dealers
Data Drill Down


In our quarterly newsletters, we use various data sources to keep tabs on the auto dealer industry. This includes items like SAAR to gauge the health and activity of the industry in terms of volumes. In this post, we discuss other metrics that help us analyze the dealerships we’re engaged to value. The goal of analyzing such metrics is two-fold: we seek to contextualize how the company’s performance compares to peers and whether a dealership is likely to get a higher multiple in the marketplace.
We also strive to provide our clients with an in-depth analysis that can be beneficial to the management of their dealership. Understanding value drivers and performance relative to peers helps dealers understand and, hopefully, increase the value of their business. While sources like RMA (defined below) are frequently used in valuations across industries as a starting point, the auto dealer industry has the luxury of having other unique data sources that can provide further insight to our clients.
Let’s peel back the onion and drill down into these various data sources.
RMA Annual Statement Studies
Beginning on the outer layer of our proverbial onion, one of the base resources employed by appraisers for companies in a variety of industries is the Annual Statement Studies: Financial Ratio Benchmarks, as published by the Risk Management Association. We refer to this information simply as “RMA” for short.
This annual study allows users to determine the composition of common sized balance sheets, income statements, and other key financial ratios. Though RMA data was initially published to aid banks in determining the suitability of loans, this information is still helpful in the valuation context because it allows us to gain insight into industry financial trends.
RMA data is offered by North American Industry Classification System codes (“NAICS” codes). For auto dealers, there are Retail – New Car Dealers (#441110) and Retail – Used Car Dealers (#441120). As seen in the pictures below, the vast majority of peer information comes from new vehicle dealers with over $25 million in sales. Most auto dealers, whether they have one rooftop or several, tend to fall into the over $25 million category. In an industry where vehicles retail around $30 thousand, a dealer only needs to sell about 830 vehicles a year to get to $25 million in revenue, and this doesn’t even consider fleet, wholesale, and fixed operations.
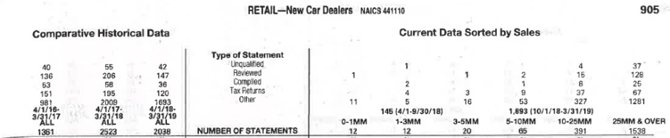
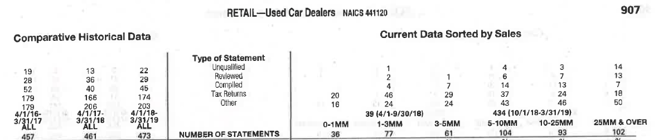
While we frequently show both new and used vehicle financial ratios from RMA, the data from new dealers is more likely to be appropriate for a typical franchised dealer, even those with material used vehicle operations.
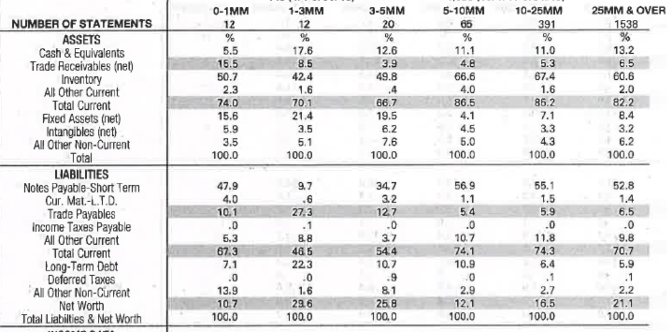
As alluded to previously, this data provides common size balance sheet and income statements. For example, RMA data shows inventory comprises about 60% of total assets, while short-term notes payable (the vast majority of which for auto dealers is floor-plant debt) comprise about 52.8%. Many dealers do not fully finance their used vehicles, which likely plays a role in inventory exceeding short-term notes payable in the RMA data. Inventory as a percentage of total assets and inventory turnover can also be used to determine the amount of inventory held by a dealer.
These data points can then be applied to the subject company we are valuing to consider how floor plan debt usage may impact liquidity and expenses and whether they are carrying adequate inventory to support sales.
RMA data also provides helpful insights into the following metrics:
- Working capital as a percentage of sales
- Inventory turnover
- Average Days Outstanding (on receivables and payables)
- Gross and Pre-Tax profit margins
- Officer/director compensation as a % of sales
While these metrics are helpful in analyzing dealers, it is critical to use caution when relying on this information. We believe the data works better as a starting place, as the average of 2,000 dealerships is not going to be directly comparable to the dealership in question. Therefore, we find it more helpful as a test of reasonableness than some figure to specifically tether analysis.
NADA Dealership Financial Profiles
While RMA data is a useful starting point, the auto dealer industry has more directly comparable data available. Peeling back the next layer of the onion, The National Automobile Dealers Association (“NADA”) publishes Dealership Financial Profiles on a monthly basis.
Like RMA, data from all types of dealerships is compiled in the “Average Dealership Profile.” For dealers with many rooftops, this may give a good overall perspective. However, when valuing a single point location, Dealership Financial Profiles help us to get even more specific.
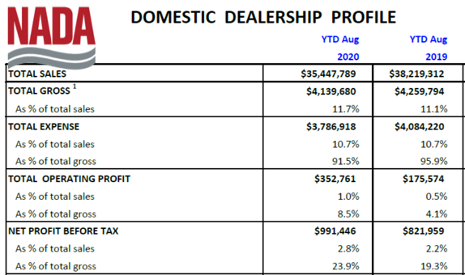
NADA offers data for domestic, import, luxury, and mass market dealerships. This is helpful because while operations can be substantially similar for different brands of dealerships, margins and profit drivers tend to be different for the various types of dealerships. This enhanced granularity allows for better comparisons than the information provided by RMA, and monthly information is also more helpful than annual studies. However, NADA information focuses primarily on the income statement, with minimal information on the balance sheet available (excluding the net debt-to-equity and current ratio). Sales, gross profit, operating profit, pre-tax profit figures are offered for various types of dealerships as seen below for domestic dealerships.
Beyond just margins, NADA data drills down further into the following:
- Profitability by department (new, used, and fixed operations)
- New and used retail volumes
- F&I penetration
- Advertising, rent, floor-plan interest, and SG&A expenses
Like the RMA data, strict comparisons should be made with caution. Still, these are very helpful data points that can lead to better discussions with dealer principals, both about the performance of the business and potential normalization adjustments for valuation purposes. For example, dealerships frequently rent their facilities from an entity that owns the property. This entity and the dealership operations frequently have overlapping ownership structures, and this provides another data point to help determine if the company is paying a fair market-based rent. Related parties may also perform certain advertising functions, which by nature have fewer data points to determine whether a company is overpaying or underpaying for these services.
As we mentioned above, another advantage of NADA data is the frequency of publication. Monthly information may be subject to seasonal quirks if profitability is stronger during certain months but comparing to prior year periods largely neutralizes this impact.
Using more current information is particularly helpful in the dynamic environment we’ve experienced in this pandemic. For example, in the above figure, revenues and gross profit were down for the average dealership through August 2020, but pre-tax profits actually rose as expenses declined more than gross profit. This analysis would not be possible until the following year of RMA studies. Ultimately, NADA data gets to closer comparisons than RMA, but we can still peel back another layer.
20 Group Data
In our valuation engagements, we frequently ask for 20 Group data, which is compiled by OEMs and compares dealers to their peers.
Unlike NADA data, the peers in a 20 Group statement will be only the same brand, and selected peers will likely be more similar to the subject company in terms of size or geography (or both). As such, this represents the closest comparison possible.
Unfortunately, this data is not always available, and as noted in our other sources, we caution against heavy reliance on such information as necessary valuation adjustments are not frequently considered on dealer financial statements, and therefore, will not lead to fool-proof data points upon which to base valuation adjustments.
Blue Sky Transactions Data
Another data source frequently considered in transactions of auto dealerships are Blue Sky multiples, as published by Haig Partners and Kerrigan Advisors.
Blue Sky multiples offer different perspectives than the above information. These auto dealer focused investment banks publish indications of dealership intangible value they encounter in the transaction space. For valuation purposes, these multiples can be used in conjunction with peer performance to explain the Blue Sky value of a dealership. If a certain branded dealership typically gets a 5-6x Blue Sky multiple, and the dealership is performing better than their peers, all else equal, they may get a multiple at the upper end or even above this range.
However, not everything is all equal. You’d pay more for a dealership that delivers consistently strong returns. But how much of the increased value is due to higher earnings and how much is to a higher multiple?
If a company is underperforming its peers, but the buyer believes they can improve performance up to peers, a higher value paid on lower historical earnings implies a higher multiple, so even an underperforming dealer might get a higher multiple than a better performing peer.
Multiples are based on some indication of value and some indication of earnings; they frequently describe value rather than prescribe value. Stated more simply, a valuation does not simply derive tangible book value and apply the mid-point of the Blue Sky multiple range to pre-tax earnings. A proper valuation will determine the value of the dealership and be able to communicate why the implied Blue Sky value is reasonable within the context of historical and expected earnings and compare this performance to that of its relevant peers.
Conclusion
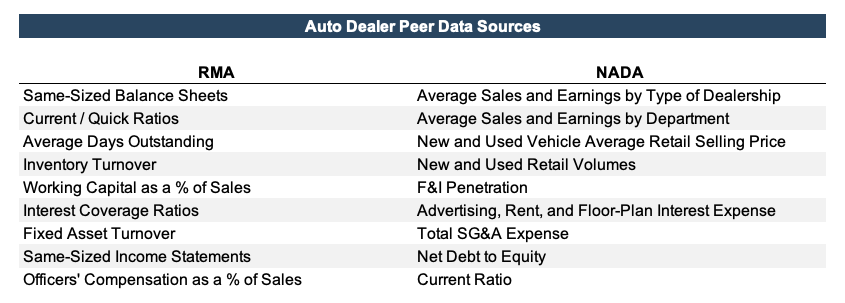
In total, these various sources offer plenty of perspective into the historical performance and expected value in the marketplace for an auto dealership. Each source offers a different type of insight, and each comes with its own strengths and drawbacks. We have summarized data available from RMA and NADA in the following table.
For a better understanding of where your dealership stacks up relative to peers and potentially in the marketplace, contact a member of the Mercer Capital Auto Dealer Valuation team today.