April 2023 SAAR


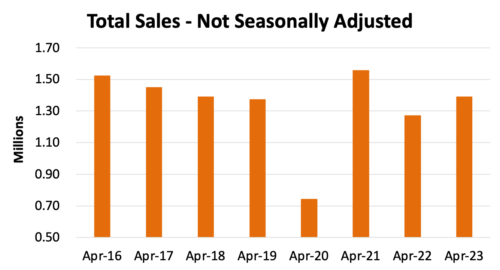
The April 2023 SAAR was 15.9 million units, up 7.2% from last month and 11.4% from April 2022. This month’s improvements are significant for the month and the year as they emphasize the story that the data has been telling for months: vehicle availability has been improving, leading to higher sales volumes and more consistency in the SAAR. In fact, the year-over-year improvement in April marks the ninth straight month that the SAAR improved from the year prior. On an unadjusted basis, total sales for April came in at 1.39 million units, an improvement of 9.4% from April 2022. See the chart below for a comparison of the last eight April’s unadjusted sales.
While there is typically nothing particularly special about auto sales in the month of April, it has presented comparatively dynamic conditions over the past four years. In the April 2022 SAAR post, we used this month to compare the last three April’s inventory to sales ratios, and this year offers us that same opportunity. See the chart below for a three-year look back at the industry’s inventory to sales ratio.
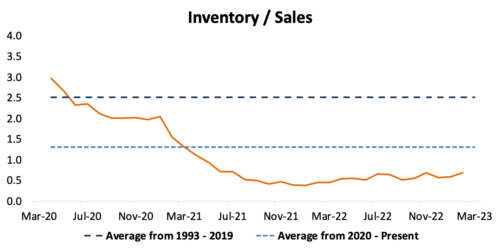
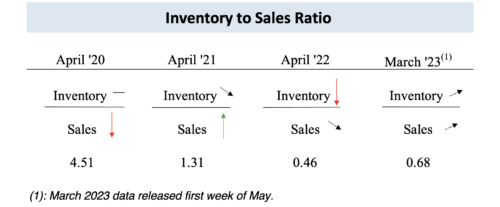
- In April 2020, the COVID-19 pandemic captured the world’s attention and stifled vehicle demand as economic uncertainty pushed consumers to hold off on vehicle purchases. This pause in activity kept potential buyers off dealer lots despite adequate inventory levels across the entire industry. Cooled conditions resulted in very low sales and an elevated inventory to sales ratio (4.51) compared to the all-time high of 4.64 in January 2009. In 2009, dealers were turning as much inventory as possible—even at lower GPUs—to shore up their cash position.
- In April 2021, demand had more than recovered. Pent-up demand from the pandemic resulted in a level of raw sales that was the highest ever recorded in April. Inventory balances would have been considered “healthy but declining” due to strong demand during this period. Sales began to outpace the rate of OEM vehicle production around this time.
- In April 2022, the tables completely turned from the observed conditions in April 2020. Demand continued to stay strong, but historically low inventory balances (due to supply chain shortages) restricted raw sales numbers well below what was observed in April 2021. Demand was still overwhelming compared to historically low supply at the time, and actual sales were declining alongside inventory availability because there were not enough vehicles to sell.
- In the current environment, sales have incrementally improved alongside the available inventory balance, leading to marginal increases in the inventory to sales ratio over the last year. Pent-up demand from commercial and fleet customers (who did not have the opportunity to cycle out aging fleets during 2020-2022) has kept the ratio below 1.0, but a consistent sticky trend of improvements in 2023 is expected to continue throughout the remainder of the year.
Transaction Prices, Incentive Spending, and Monthly Payments
Transaction Prices – According to the J.D. Power–LMC Automotive Forecast, the average transaction price for a new vehicle was $46,044 in April, an all-time April record but down nearly $2,000 from last month ($48,008 as reported by Cox Automotive). In fact, March 2023’s average transaction price also fell by about $500 last month, hinting at the possibility of a short-term normalization of prices from the height of 2022’s elevated prices. This marks the second month in a row that the average transaction has been reported below MSRP after twenty consecutive months of the contrary. We will monitor where average transaction prices eventually land and if that will affect where OEMs decide to set MSRPs going forward.
Incentive Spending – According to the same forecast by J.D. Power: “The average incentive spend per vehicle has risen 58.9% from April 2022 and is currently on track to reach $1,599 for April 2023. The percentage of incentive spending per vehicle in relation to the average MSRP is currently trending at 3.3%, an increase of 1.1 percentage points from April 2022.” J.D. Power thinks this increase in incentive spending can be partially traced back to the absence of discounts on leased vehicles when compared to purchased vehicles, but numerous factors are in play.
Average Monthly Payment – The average monthly finance payment was $729 in April, up $48 from April 2022. The average monthly payment has remained elevated despite a cooling of vehicle transaction prices due to rising interest rates across all lending spaces. In an upcoming blog, we will revisit the state of automotive finance data and provide a much more robust discussion on monthly payments.
May 2023 Outlook
Mercer Capital’s outlook for the May 2023 SAAR continues to be optimistic. Industry supply chain conditions are improving. However, sales volumes will likely continue to be closely tied to production volumes, although less so than a few months ago. Consumer activity may begin to cool off as affordability becomes an issue for many prospective buyers, but we’ll have to see it to believe it.
Mercer Capital provides business valuation and financial advisory services, and our auto team helps dealers, their partners, and family members understand the value of their business. Contact a member of the Mercer Capital auto dealer team today to learn more about the value of your dealership.