April 2024 SAAR
The April 2024 SAAR was 15.7 million units, reflecting generally flat month-over-month (+1.1%) and year-over-year (+0.4%) growth. Over the last several months, we have seen more stability in the SAAR than we have seen since the pandemic. This stability will likely give confidence to dealers and consumers alike after years of volatility and uncertainty in transaction prices and vehicle availability. Inventory levels, increased incentive spending, average transaction prices, and per-unit dealer profits will all be discussed later in this post.
Unadjusted Sales Data
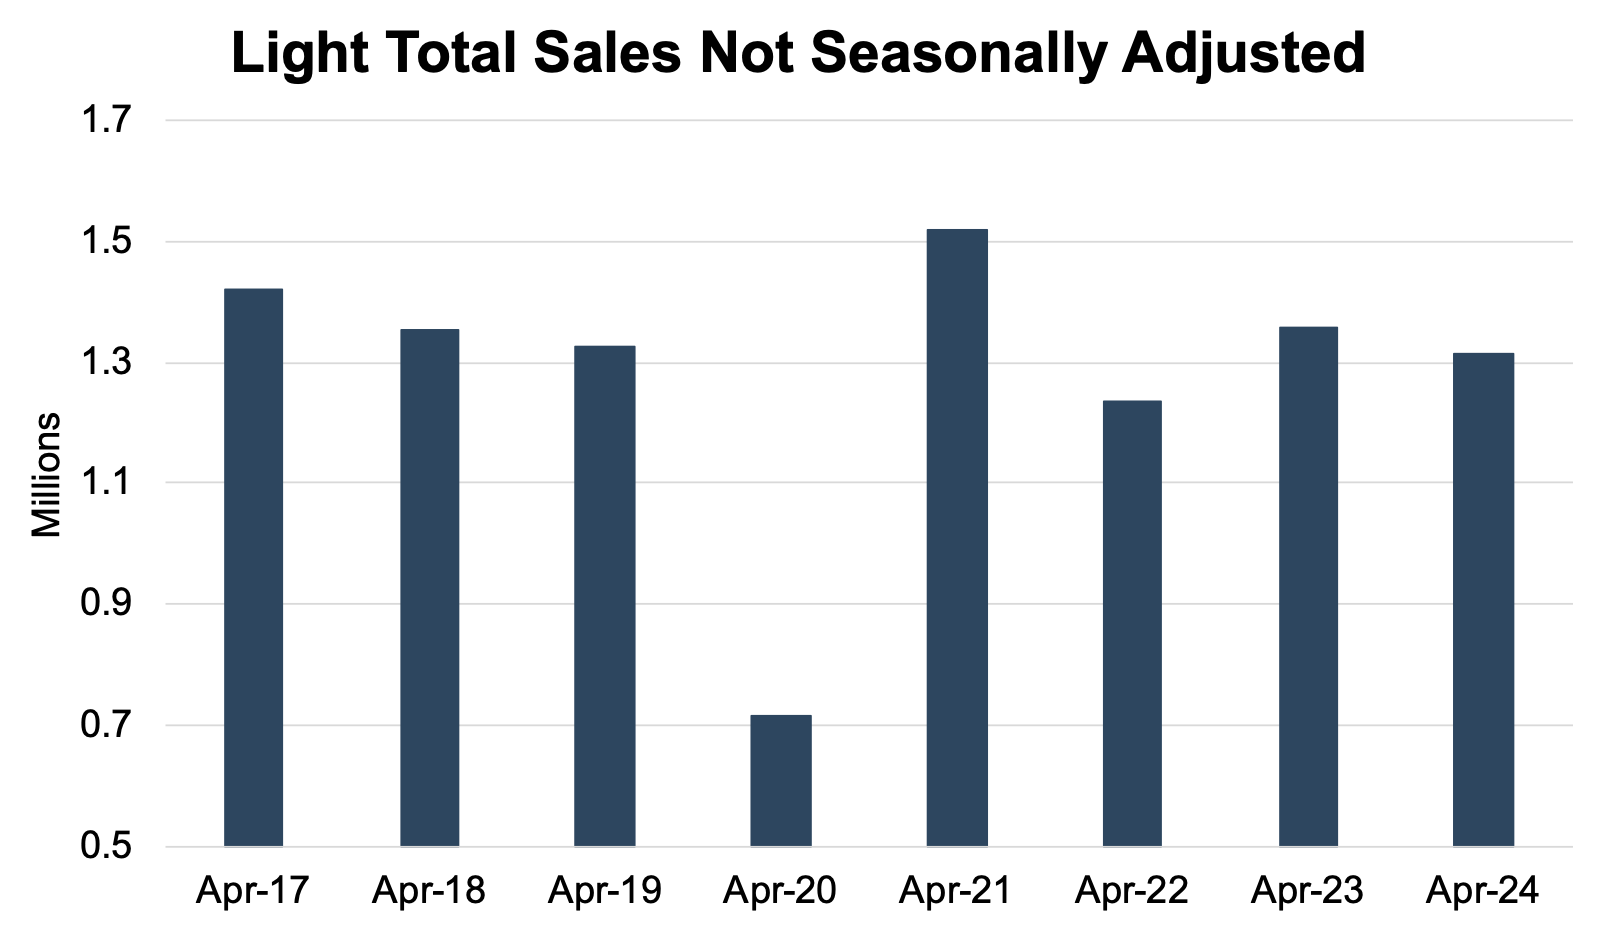
On an unadjusted basis, the industry sold 1.31 million total units in April 2024, a 9.1% decrease from last month. This is the largest March-to-April decline since 2021, when sales fell 4.9%. It seems tax refund season came early this year, as used-vehicle inventory at the start of April was the lowest it’s been in the past year, according to Cox Automotive.
While unadjusted sales experienced a slight decline from April 2023, April 2024 sales are very similar to pre-pandemic levels, which is becoming a theme across many of the data points we track. The chart below shows unadjusted total sales volumes for the last eight Aprils:

Inventory and Days’ Supply
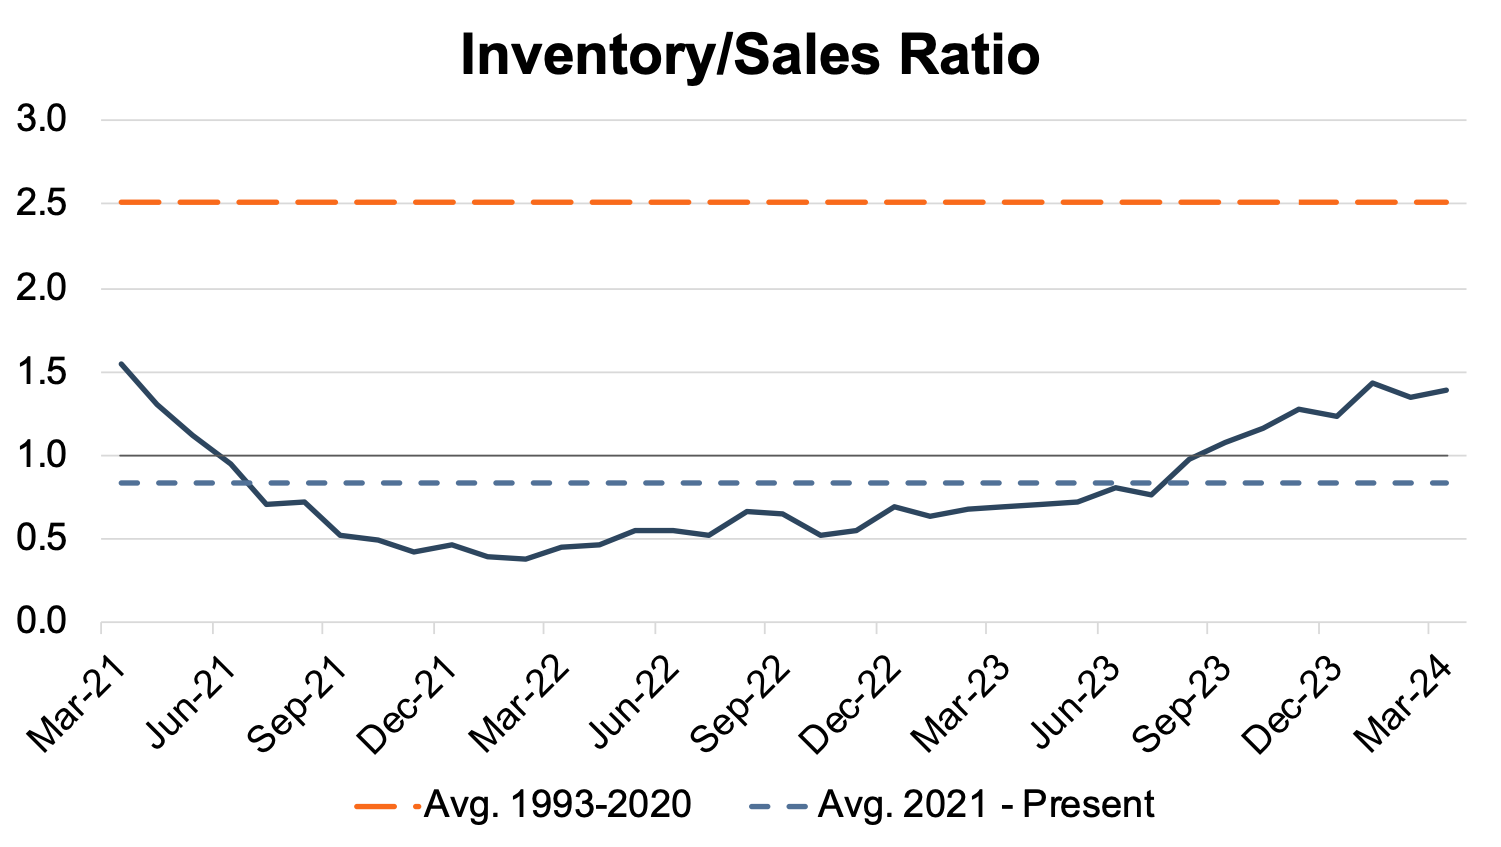
An inventory-to-sales ratio greater than 1.0x indicates that the seasonally adjusted inventory level at the end of the month was greater than reported sales; this data tends to be lagged by a month or two.
In March 2024, the inventory-to-sales ratio rose slightly to 1.39x from 1.35x in February 2024. Additionally, the last seven months have been above the 1.0x threshold, indicating that the industry has generally recovered from the lows of the pandemic. The chart below illustrates the industry’s inventory-to-sales ratio over the last three years.

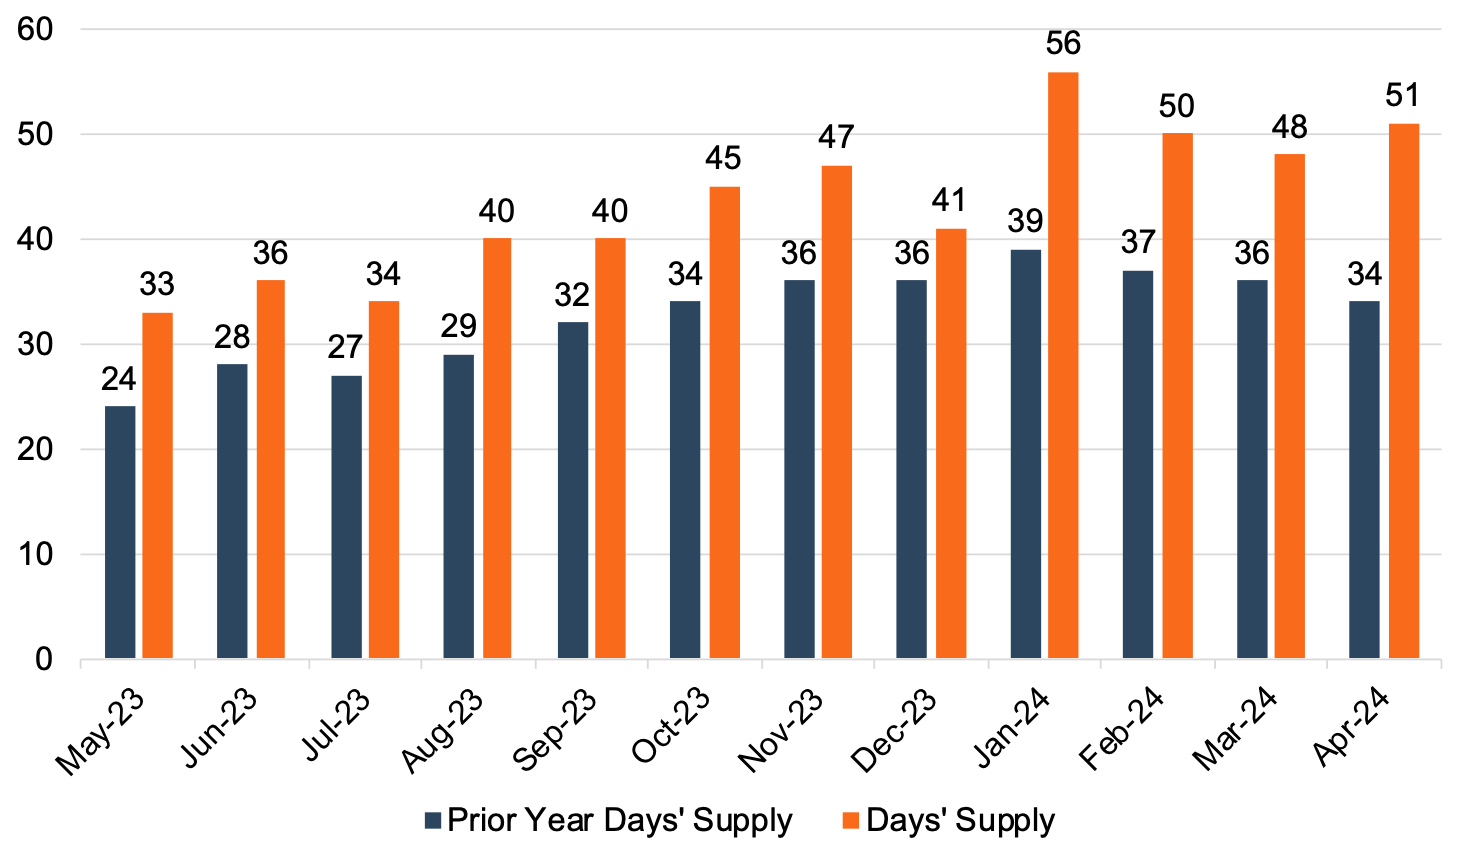
Days’ Supply, another indication of the relationship between auto sales and inventory, has remained generally elevated over the last year. April 2024 Days’ Supply expanded to 51, and we believe it is likely that Days’ Supply will stick around 50 over the next few months. The chart below presents Days’ Supply for U.S. Light Vehicles over the past twelve months (per Wards Intelligence):

Transaction Prices
The president of data and analytics at J.D. Power, Thomas King, discussed the downward trajectory of average transaction prices for new vehicles in April:
“The average new-vehicle retail transaction price is declining as manufacturer incentives rise, retailer profit margins fall, and availability of lower-priced vehicles increases compared to a year ago. Transaction prices are trending towards $45,093—down $1,172 or 2.5%—from April 2023. The combination of slightly higher retail sales but lower transaction prices mean that consumers are on track to spend nearly $46.4 billion on new vehicles this month—3.5% lower than April 2023 and the fourth-highest April on record.”
According to J.D. Power, the average used vehicle price in April was $28,491, down 4.5% from last year. Declining transaction prices have also impacted trade-in values which are down about 14% from April of last year. Throughout 2024, we will likely see the average transaction price moderate as inventory levels continue to expand.
A discussion of the last few years of average transaction prices benefits from a bit of context. It is important to note that transaction prices shot through the roof during the inventory-constrained 2021 and 2022 calendar years. While average transaction prices have certainly contracted over the past few months, the average transaction price is still a bit higher than it was pre-pandemic. From the consumer side, vehicle buyers may even see higher monthly payments due to the current high interest rate environment in the United States. Stay tuned for an upcoming post on auto finance that will explore this topic in more detail.
Incentive Spending and Profitability
With only about 16% of new vehicles transacting above MSRP in April 2024, total retailer profit per unit is expected to drop nearly 30% to $2,588 from April 2023. Thomas King highlights the continued pressure on dealer profitability in April:
“Although sales to retail buyers are rising, the rate of growth is modest. This is due in part to discounts from manufacturers and retailers stabilizing, coupled with ongoing deterioration of used-vehicle values that results in shoppers having less trade-in equity. While the stabilization of discounting is positive for short-term industry profitability, the modest growth rate means that inventory at dealerships is continuing to rise and discounting is expected to increase. This should elevate the sales pace at the expense of per unit profitability.”
J.D. Power notes that average incentive spending per unit in April is expected to hit $2,633, up nearly 57% from April 2023. Incentive spending as a percentage of the average MSRP is expected to reach 5.3% in April 2024, reflecting an increase of 1.9 percentage points from April 2023. Going forward, it will be interesting to keep an eye on how auto manufacturers continue to subsidize purchases with incentive spending. We believe that the trends over the last several months will likely remain stable and persist into the second half of the year. If auto manufacturers continue to provide these incentives, it is likely that sales volumes will continue to grow while dealer profitability settles closer to pre-pandemic levels.
May 2024 Outlook
Mercer Capital expects the May 2024 SAAR to come in around the 16 million mark. As inventory levels and dealer-to-dealer competition trend higher, we will likely see more holiday incentives in May 2024 than in recent years. Inventory levels and incentive compensation will likely put pressure on the average transaction price and per-unit dealer profit through May 2024 and the remainder of the year.
Mercer Capital provides business valuation and financial advisory services, and our auto team helps dealers, their partners, and family members understand the value of their business. Contact a member of the Mercer Capital auto dealer team today to learn more about the value of your dealership.
 Auto Dealer Valuation Insights


