August 2022 SAAR


The August SAAR was 13.2 million units, down 1.1% from last month but up 0.7% from August 2021. This month’s data release marks the third month in a row that the SAAR has been in the low 13 million-unit range, with the metric seemingly having stabilized in the short term. To illustrate this trend, the average SAAR has been 13.1 million units over the last four months.
Now that the August data has been released and two-thirds of the year is a known commodity, we have much more visibility to what the full year SAAR might look like. Year to date average SAAR is 13.7 million units, which makes it even harder for us to imagine a full year SAAR over 14 million units. To put numbers in a hypothetical scenario, the turnaround that is necessary to reach an average SAAR of 14 million units in 2022 would require the next four months’ SAAR to average 14.7 million units.
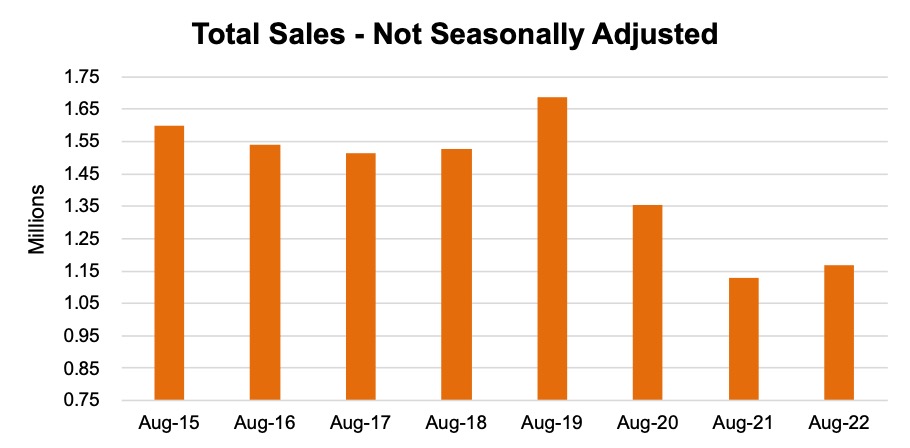
Unadjusted sales numbers have also kept with the trends we have seen over the last several months. Comparing the previous eight August’s unadjusted sales figures (in the chart below) emphasizes the longevity of the production issues that have gripped the auto industry. In August 2020, unadjusted sales had begun to recover from the steep drop that started in April 2020 in response to the COVID-19 pandemic. While this recovery seemed strong in late 2020 and into the first half of 2021, supply chain issues reared their ugly head during the summer of 2021 and, by August of last year, had completely stagnated. While August 2022’s unadjusted sales show a modest recovery from this time last year, it is clear that the auto industry is still very much in the midst of an inventory crisis.
Inventory
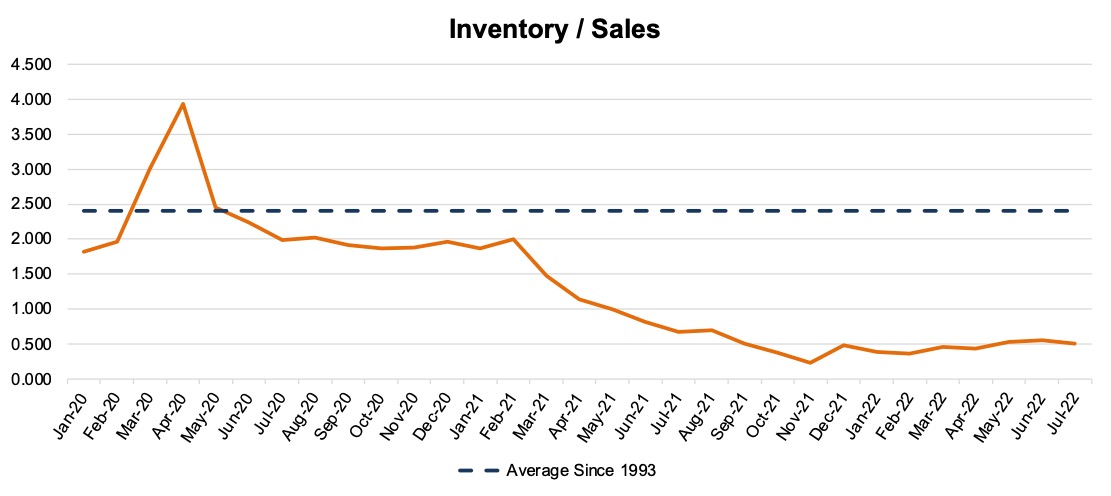
Speaking of inventory levels, not much has changed since the last time the data was released. Industry-wide inventory balances for July came in at 0.50x, down from June’s figure of 0.56x. The inventory to sales ratio has been under 1.0x since May 2021 and had been climbing the past few months to the highest levels since August 2021 before declining in July 2022 (most recently available inventory data tends to lag by a month).
To put context to this ratio, on average, dealers have been selling twice the number of vehicles that are on their lots during the last several months. Consumers have had to get accustomed to pre-ordering vehicles or simply settling for the vehicle that just so happens to be on the lot when they visit a dealership. Pent-up demand for these vehicles has not had a chance to unwind at all, and the most likely scenario that dealerships can expect is that pent-up demand will hang around until meaningful changes in inventory availability come to fruition (when that actually might happen is still a mystery). See the chart below for a look at the industry’s inventory to sales ratio from January 2020 through July 2022.
Transaction Prices, Incentive Spending, and Monthly Payments
For our weekly readers, it may seem like there has been a new record for the average transaction price set almost every month over the past year, and that is not far from the truth. According to J.D. Power, the average transaction price for a vehicle in August was $46,259, up 11.5% from this time last year and the highest average transaction price on record. Inventory constraints have continued to push prices higher and higher each month, but these constraints are not the only driver of vehicle prices record-setting rise. For example, OEMs have had to prioritize high-demand vehicles like trucks, SUVs and crossovers, all of which are much more expensive than the typical sedan. We believe this is particularly notable in light of elevated gas prices, which, at least in theory, should temper demand for larger vehicles that guzzle more gas.
OEMs have also kept incentive spending low. In August, average incentive spending per unit is expected to total $969, a decline of 47.1% from this time last year and the fourth straight month under $1,000. Higher prices, reduced incentives and rising interest rates are also pushing average monthly payments higher. For example, the average monthly payment on a new vehicle contract reached a new record of $716 in August. As interest rates are expected to continue to rise at the Federal Reserve’s next meeting on September 20th, it is unlikely that average monthly payments will decline any time soon.
Imports and Exports
Imports and exports are not something that we typically touch on in our monthly SAAR blog, but supply chain issues and persistently low inventory levels have raised questions related to the international flow of vehicles. Mexico and Canada are the two primary importers of vehicles into the U.S. due largely to continental trade agreements (NAFTA and USMCA). The chart below shows the flow of vehicles (in thousands) from August 2019 through June 2022, the most recently available month of data.
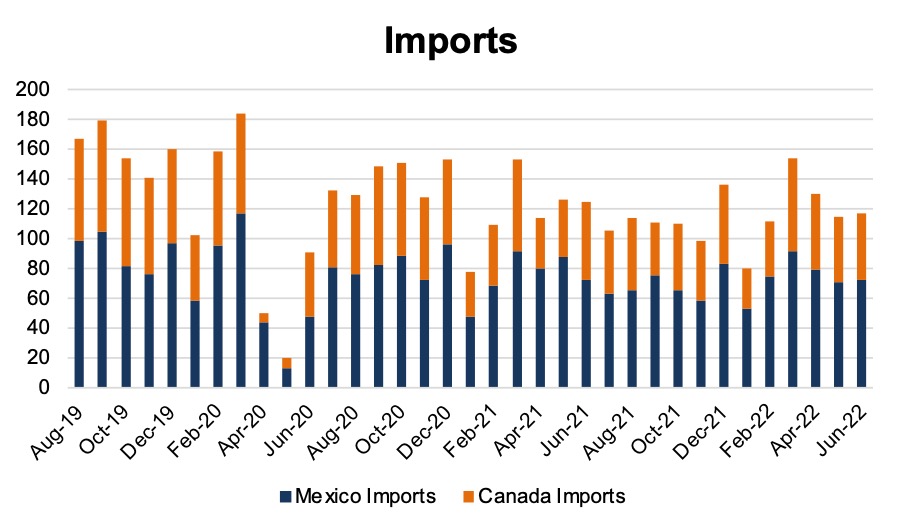
Like automotive retail generally, import activity is seasonal. Later in the winter season is when import activity typically slows down, and the summer and fall are when imports ramp up. Over the last two years since August 2020, seasonality has been present, but the total number of imports, on average, has fallen.
For Mexican imports, the average number of vehicles imported from January 2016 to December 2019 was 105,000 per month compared to an average of 72,000 from January 2020 to June 2022. Canadian imports have followed a similar but more drastic trend, averaging 95,000 imports from 2016-2019 compared to 45,500 from 2019 to June 2022.
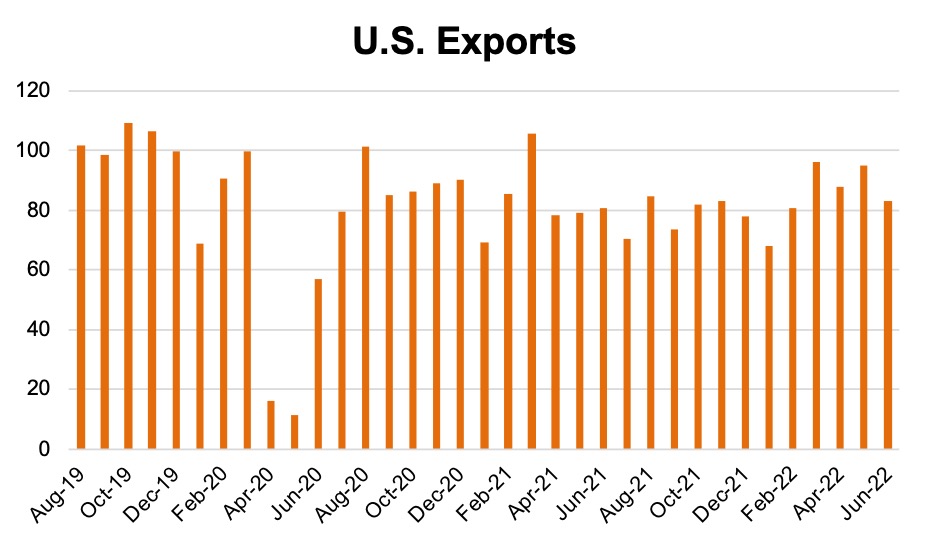
Exports from U.S. have fallen as well, which makes sense. Producers in the country have retained more vehicles to service domestic markets instead of sending units overseas. From January 2016 to December 2019, an average of 105,000 vehicles were exported to international markets. From January 2020 to June 2022, that number fell to 78,500 vehicles per month. See the chart below for auto unit exports from August 2019 through June 2022.
From looking at the raw import/export numbers, it is clear that the flow of vehicles across international lines has soften considerably. Globalization of the automotive manufacturing industry has been clawed back during this period of uncertainty and is unlikely to return to pre-pandemic levels until supply chains recover and inventories are replenished domestically and abroad. It will be interesting to follow import and export activity when inventory balances begin to recover to see how much the import/export recovery lags behind.
The import/export ratio steadily declined to a recent low of 1.42x in 2021. While this figure represents a low dating back to 1993 (first published data), the supply chain constraints may only exacerbate a secular trend as this ratio was 1.66x in 2019 and 2020. Imports from Canada and Mexico were below 1.4 million for the first time since 2009 and are just above 1993 levels. While 2021 exports are down 21.1% since 2019, this actually represents a 10.9% recovery from 2020’s reduced export levels. While imports from North American trade partners are nearly the same as over 25 years ago, exports have nearly doubled.
September 2022 Outlook
Mercer Capital’s outlook for the September 2022 SAAR is consistent with the status quo. Industry supply chain conditions continue to stagnate. Sales volumes will likely continue to be closely tied to production volumes as vehicles leave lots within days of arriving. Consumers have largely become conditioned to these higher prices, yet demand remains high due to relatively poor substitutes for personal vehicles, among other factors, of course. Elevated profitability across the entire industry will likely continue as high prices boost margins on vehicle sales. Perhaps the September SAAR can eclipse 14 million units and signal a turning of the tide, but we predict that a 14 million unit SAAR for 2022 is an optimistic assumption in the current landscape. We first need to get back to a monthly SAAR of 14 million.
Mercer Capital provides business valuation and financial advisory services, and our auto team helps dealers, their partners, and family members understand the value of their business. Contact a member of the Mercer Capital auto dealer team today to learn more about the value of your dealership.