February 2024 SAAR


The February 2024 SAAR was 15.8 million units, a 6.0% increase from last month and a 6.3% increase compared to this time last year. February 2024’s year-over-year sales improvement and consistently improving inventory levels may indicate that the industry is reverting to its pre-pandemic ways. As nationwide inventory balances continue to expand, incentive spending from auto manufacturers has followed in tandem as OEMs and retailers compete to draw in buyers. Check out our recent blog for a deep dive into Customer Lifetime Value and the importance of getting buyers in the door for both dealers and manufacturers.
Unadjusted Sales Data
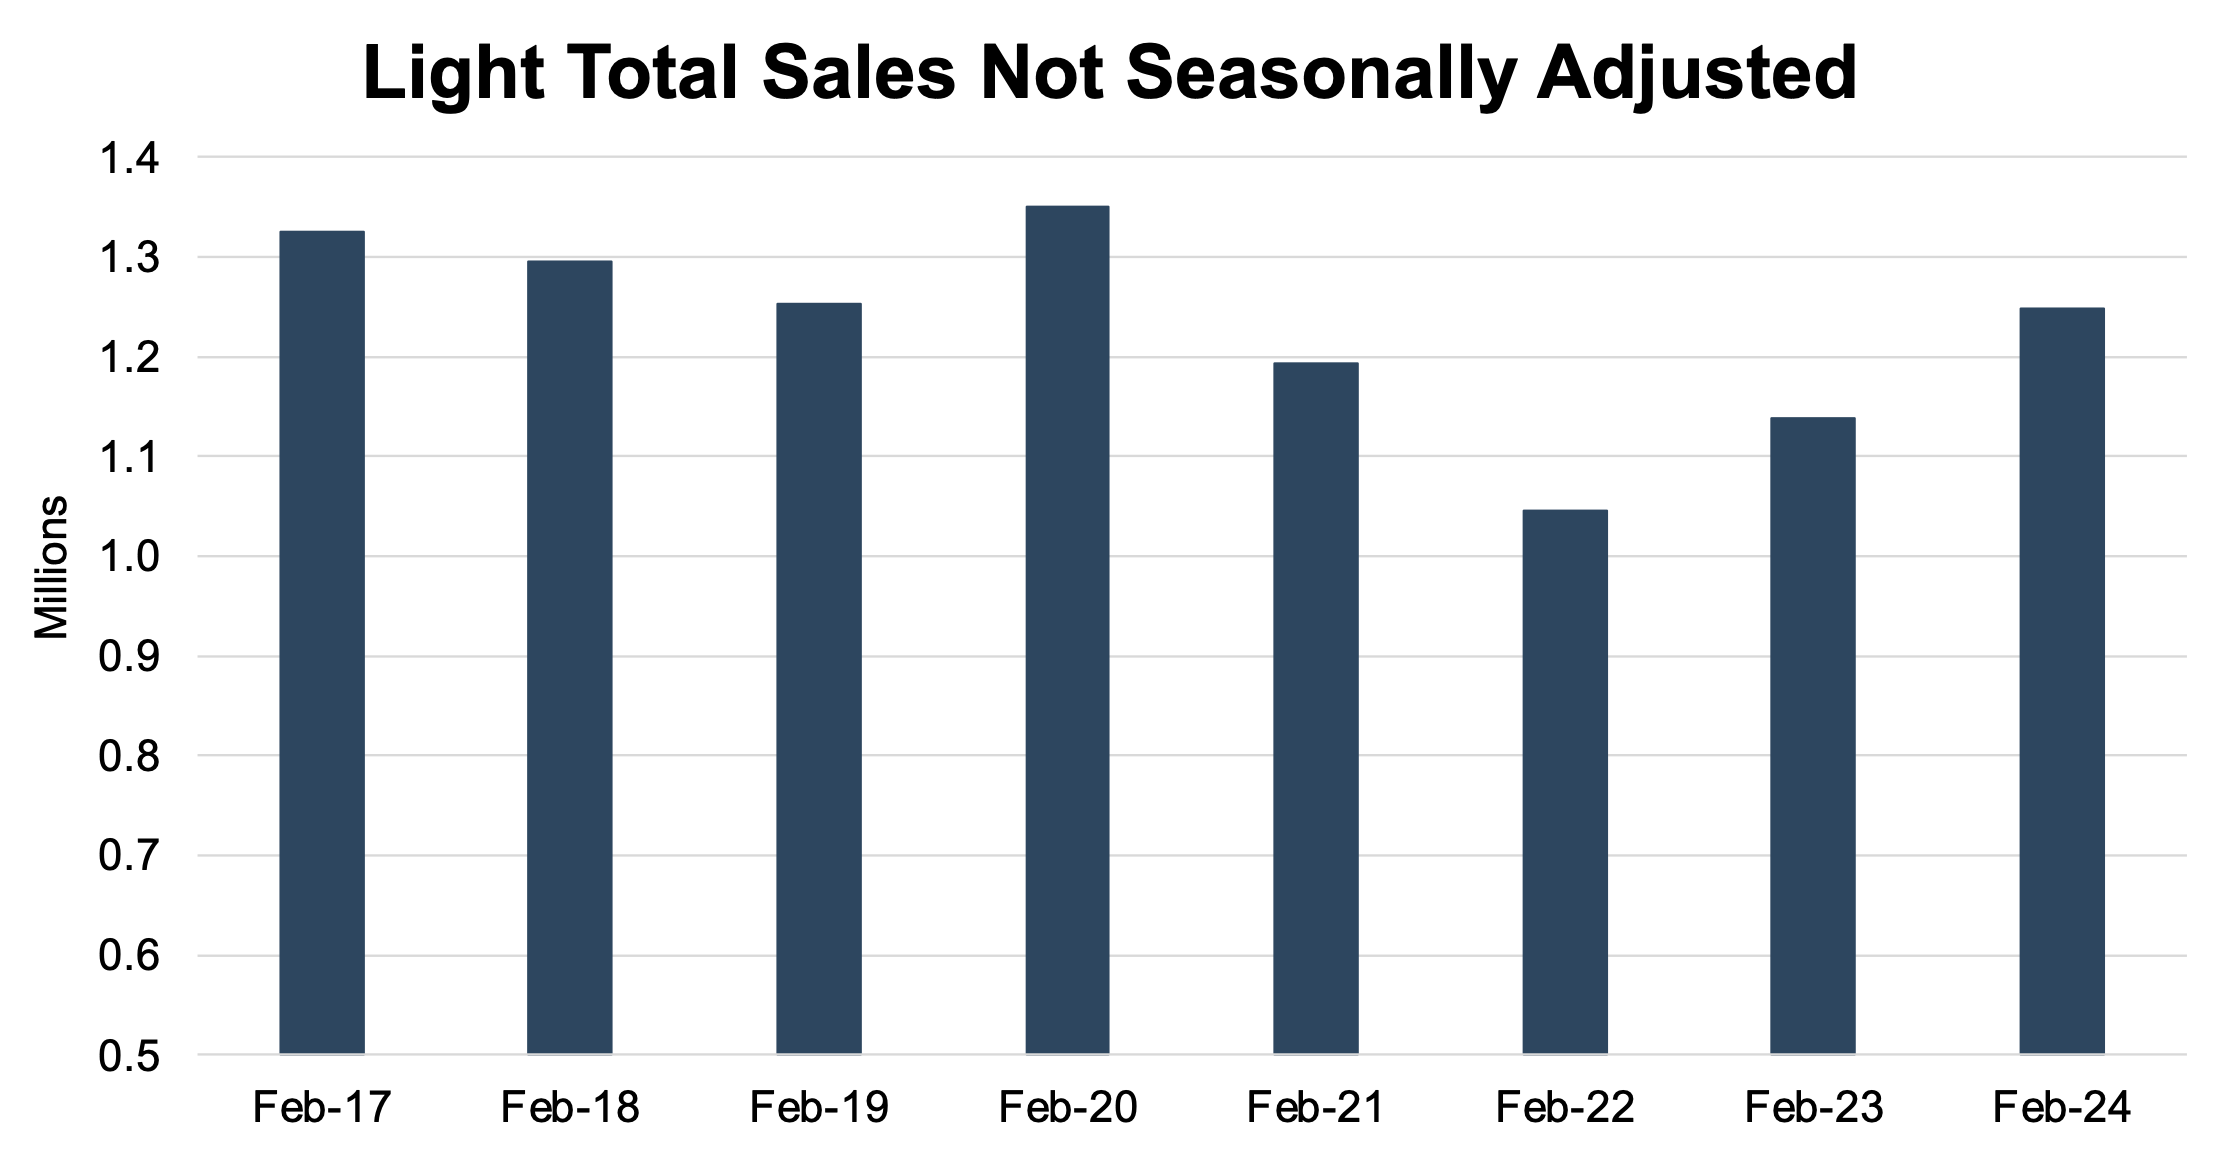
On an unadjusted basis, the industry sold 1.25 million total units in February 2024. From last month, unadjusted sales increased by nearly 17%, a notable improvement from lower volumes in January 2024. January is typically the lowest-selling month of the year, and the gap between January and February sales is typically large (9% improvement during 2023 and 6% during 2022), but this year’s improvement was larger than in recent years. Additionally, February 2024 marks the highest February sales since 2020, just before the pandemic. The chart below shows unadjusted total sales volumes for the last eight Februarys:
Inventory and Days’ Supply
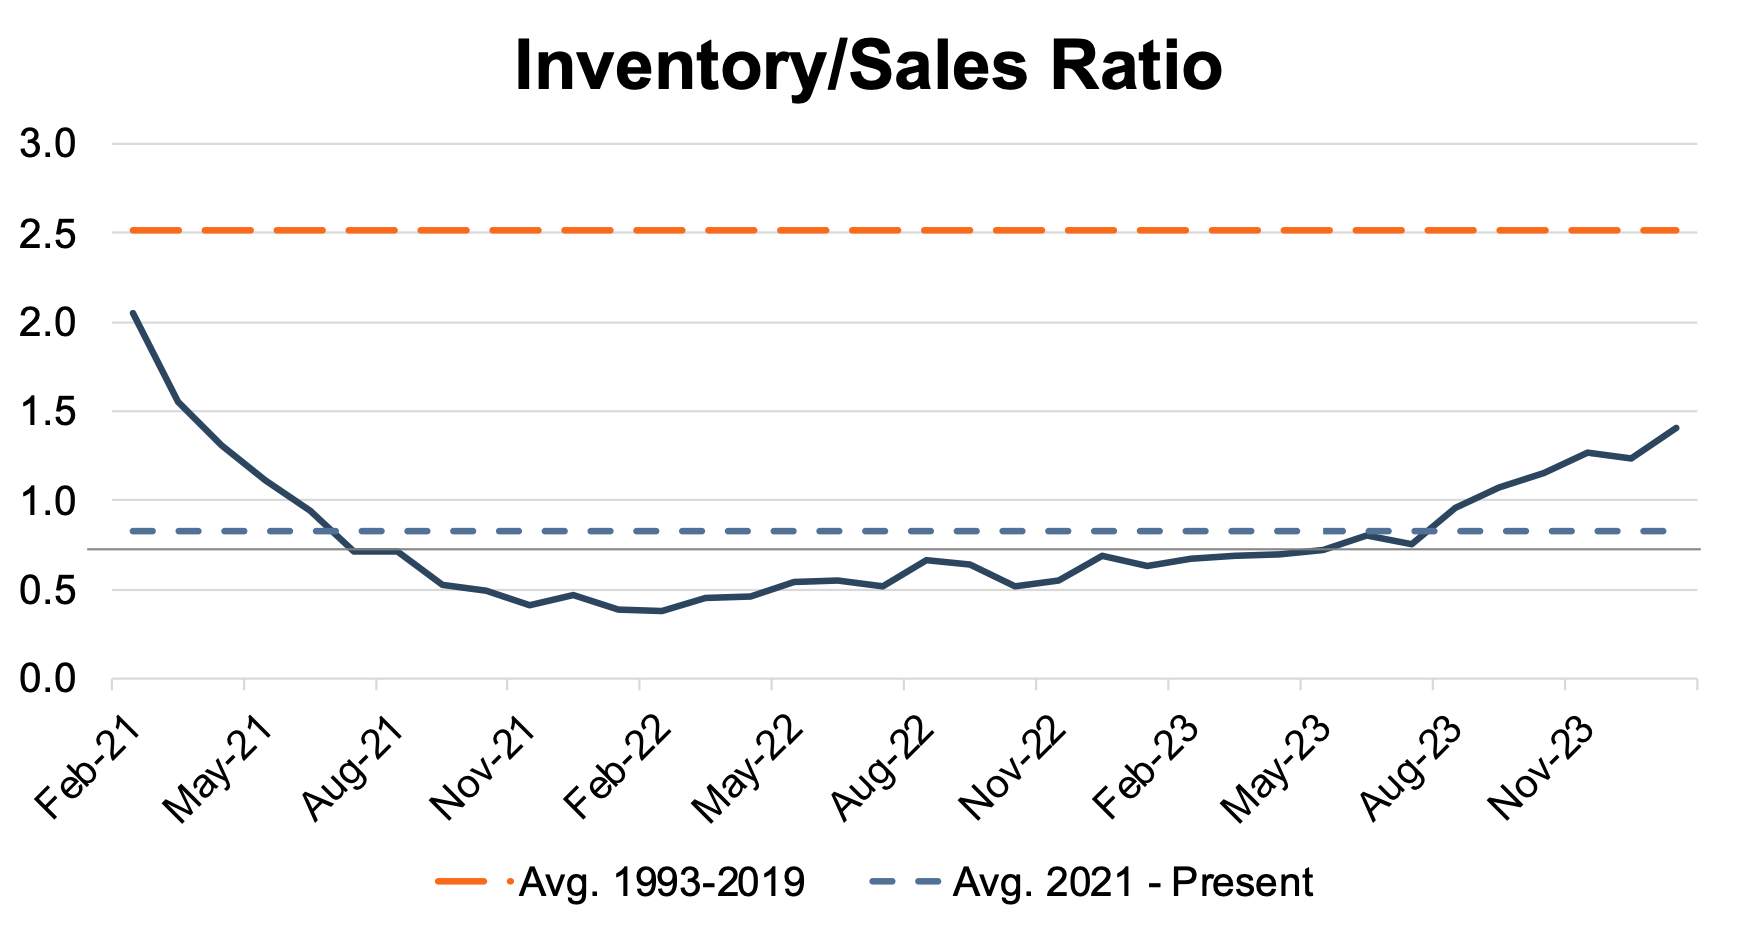
As a refresher, an inventory-to-sales ratio greater than 1.0x indicates that the seasonally adjusted inventory level at the end of the month was greater than reported sales. In January 2024, the inventory-to-sales ratio jumped to 1.41x from 1.23x in December 2023. Furthermore, January 2024 marks the fifth consecutive month above 1.0x. Perhaps the industry is finally on the other side of the inventory crunch after years of uncertainty and scarcity of models across all OEMs. The chart below illustrates the industry’s inventory-to-sales ratio over the last three years.
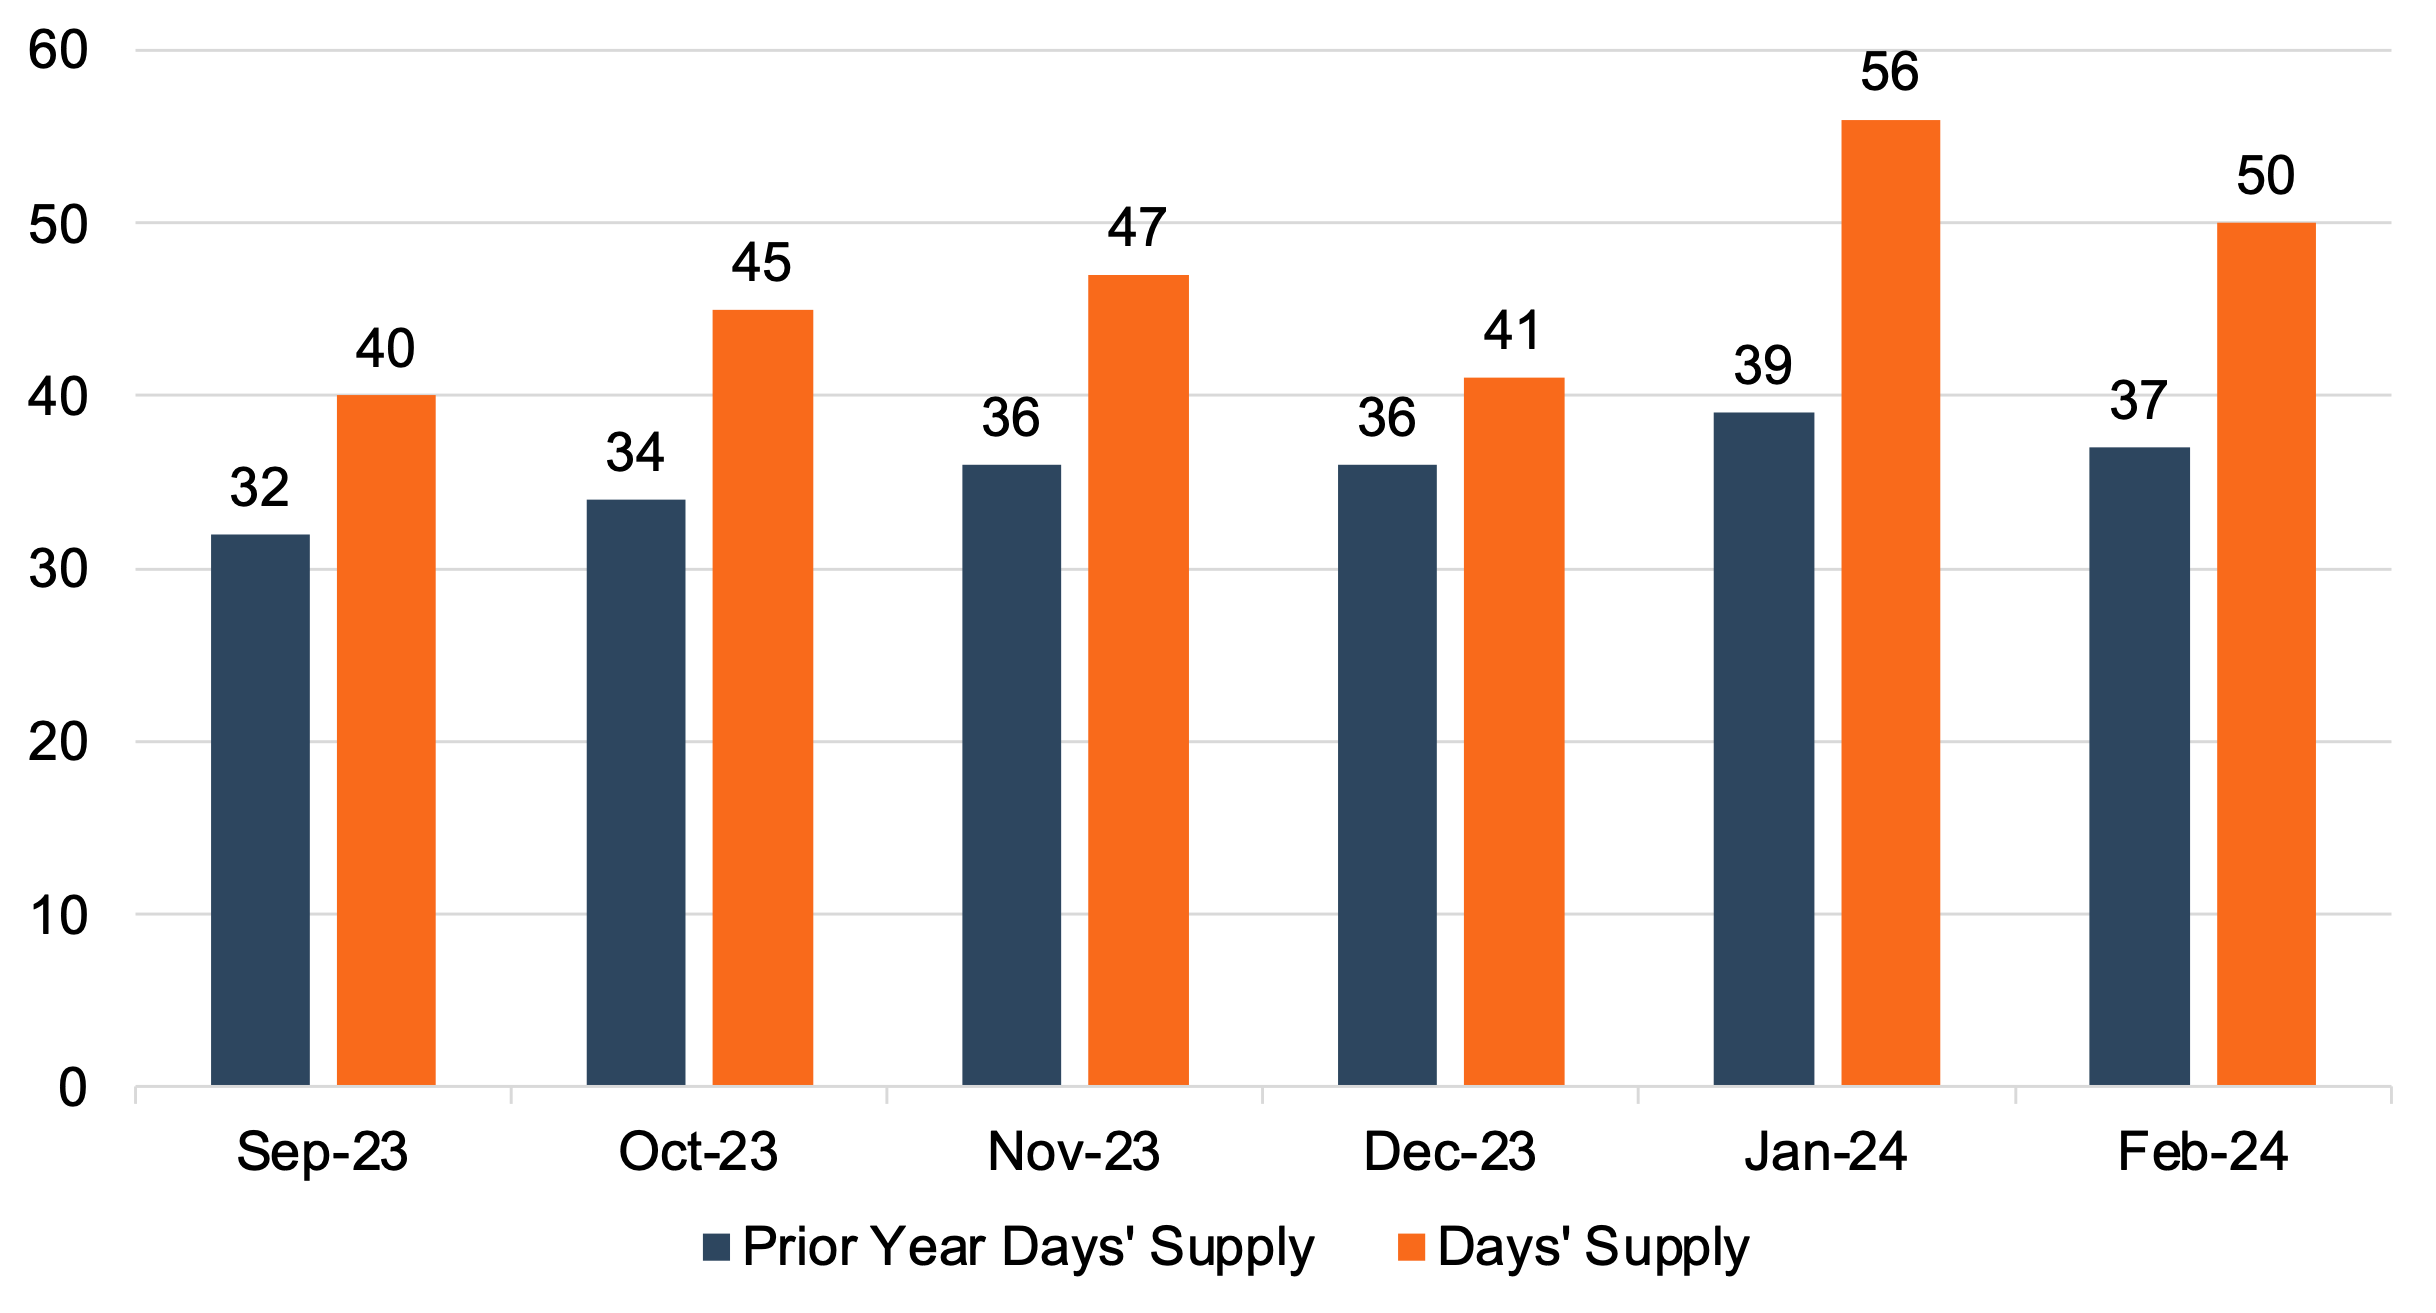
Days’ Supply, another indication of the relationship between auto sales and inventory, has generally increased over the last year despite a month-over-month decline in February 2024 (down to 50 in February 2024 from 56 in January 2024). Even though Days’ Supply fell to 50 in February 2024, it is likely that Days’ Supply will hover in the low 50s over the next few months as the industry returns to the cyclicality that was commonplace prior to pandemic disruptions. The chart below presents Days’ Supply for U.S. Light Vehicles over the past six months (per Wards Intelligence):
Transaction Prices
Thomas King, president of data and analytics at J.D. Power, discussed the downward trend in average transaction prices for new vehicles in February:
“The average new-vehicle retail transaction price is declining due to rising manufacturer incentives, falling retailer profit margins and increased availability of lower-priced vehicles. Transaction prices in February are trending towards $44,045, down $1,919 or 4.2%—from February 2023. However, despite the significant decline in average transaction prices, higher sales volumes mean consumers are on track to spend nearly $40.8 billion on new vehicles this month—the highest on record for the month of February, and 4.1% higher than February 2023.”
When it comes to used vehicles, the average transaction price decreased from January 2024. According to J.D. Power, the January average used-vehicle price of $28,121 is down 2.4% from a year ago. Falling transaction prices are also impacting trade-in values, which are down about 11% from last year. As inventory levels continue to rise, we will likely see the average transaction price continue to moderate throughout 2024.
Increasing inventory and decreasing transaction prices have also impacted per-unit dealer profit. Mr. King made the following comments on factors affecting dealer profits below:
“Total retailer profit per unit—which includes vehicles gross plus finance and insurance income—is expected to be $2,574, down 31.3% from February 2023. Rising inventory is the primary factor behind the profit decline and fewer vehicles are selling above the manufacturer’s suggested retail price (MSRP). Thus far in February, only 17.4% of new vehicles have been sold above MSRP, which is down from 31.7% in February 2023.”
Incentive Spending
J.D. Power notes that average incentive spending per unit in February is expected to hit $2,565, up over 75% from one year ago. Incentive spending as a percentage of the average MSRP is expected to reach 5.3% in February 2024, reflecting an increase of 2.3 percentage points from February 2023. While incentive spending remains elevated in February, it is important to note that these are average figures, and some markets and vehicle make/models are still transacting above MSRP, as noted by Mr. King. There is an interesting dichotomy with significant demand for more affordable options, though some consumers are still willing to pay up for the vehicle they want. While the industry and the economy are cyclical, people are making multi-year investments when they choose their vehicle, and the balance between affordability and style/preference is showing up in the numbers.
March 2024 Outlook
Mercer Capital expects the March 2024 SAAR to come in between 15.5 and 16 million. As inventory levels trend higher in the coming months, OEMs and retailers will face more competition for sales. We anticipate the heightened competition and additional options for buyers will push incentives up and the average transaction price down. For brand-agnostic consumers, we expect there to be deals available.
Mercer Capital provides business valuation and financial advisory services, and our auto team helps dealers, their partners, and family members understand the value of their business. Contact a member of the Mercer Capital auto dealer team today to learn more about the value of your dealership.