

The July 2024 SAAR came in at 15.8 million units, a 4.2% increase from last month and roughly flat with July 2023 (-0.8%). While the month-over-month increase was expected based on the CDK cyber-attack that hit the auto dealer industry in late June, we find it notable that results were still below last year. For more information related to the CDK cyber-attack, see our post from late June outlining the circumstances of the attack and its effect on dealerships across the country.
Unadjusted Sales Data
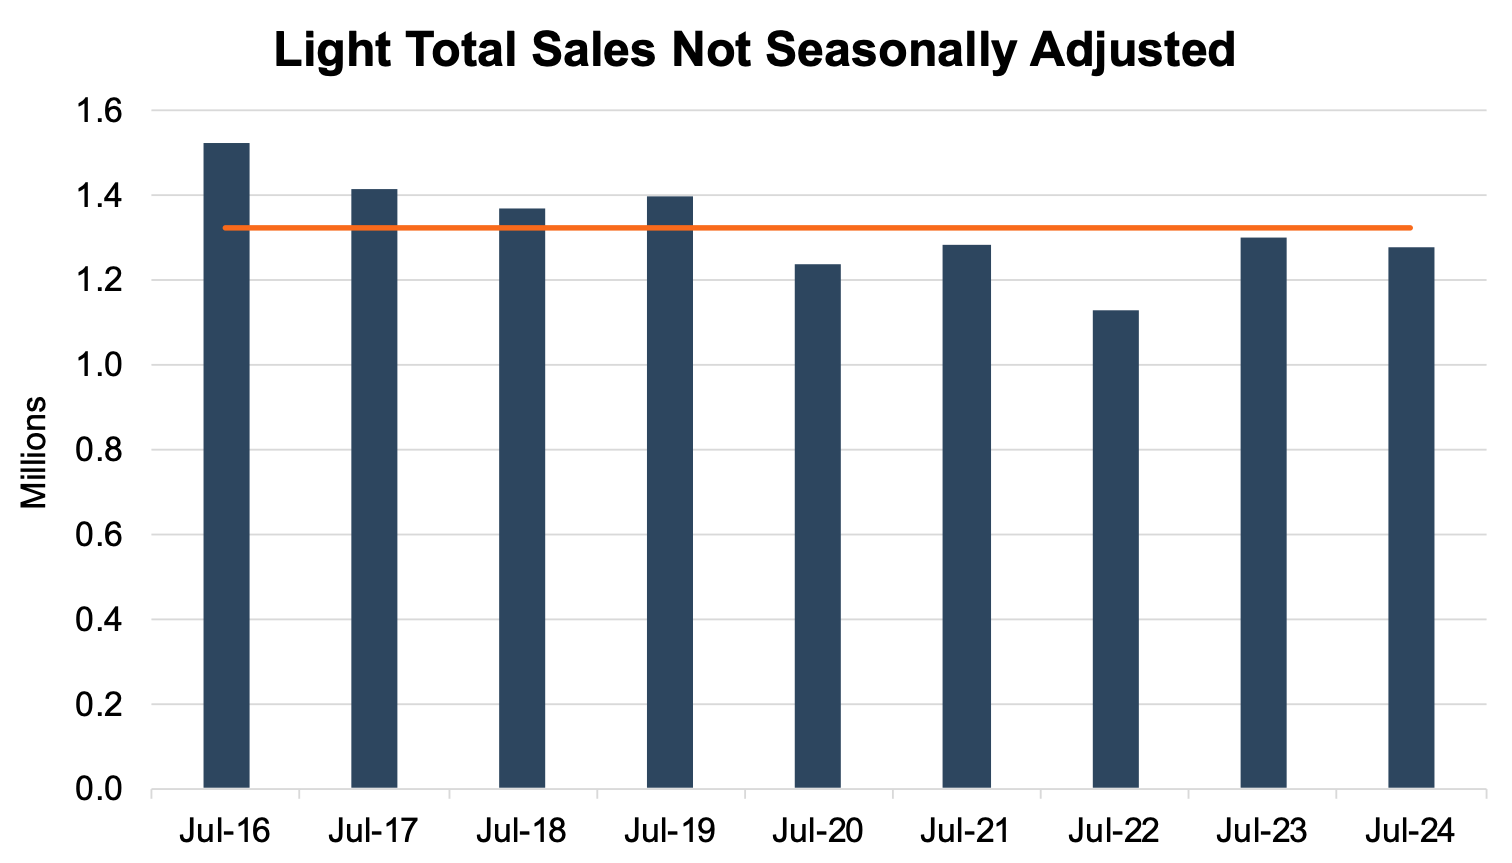
On an unadjusted basis, the industry sold 1.27 million total units in July 2024, a 3.0% decrease from last month. July 2024 sales fell below the nine-year July average, which captures the pandemic year as well as the four years before and after. The chart below shows unadjusted total sales volumes for the last nine Julys and the nine-year average in orange, which shows the stark difference in volumes pre- and post-COVID as all four Julys prior to the pandemic exceeded each year of post-pandemic sales.
Inventory and Days’ Supply
An inventory-to-sales ratio greater than 1.0x indicates that the seasonally adjusted inventory level at the end of the month was greater than reported sales; this data tends to lag by a month or two. In June 2024, the inventory-to-sales ratio jumped to 1.42x from 1.25x in May 2024. As we expected, the spike in this metric reflects the impact the CDK cyberattack had on the industry during late June. Looking at the longer-term trends in the metric, it is clear that inventories across most brands have been recovered for some time now as dealers are saddled with more inventory than they are selling in any given month. Some public auto dealers have complained about an elevated days’ supply in their most recent Q2 earnings calls, as dealers typically have little control over how many units they are allocated. Stay tuned for a more detailed analysis of these earnings calls in our next blog. The chart below illustrates the industry’s inventory-to-sales ratio over the last three years.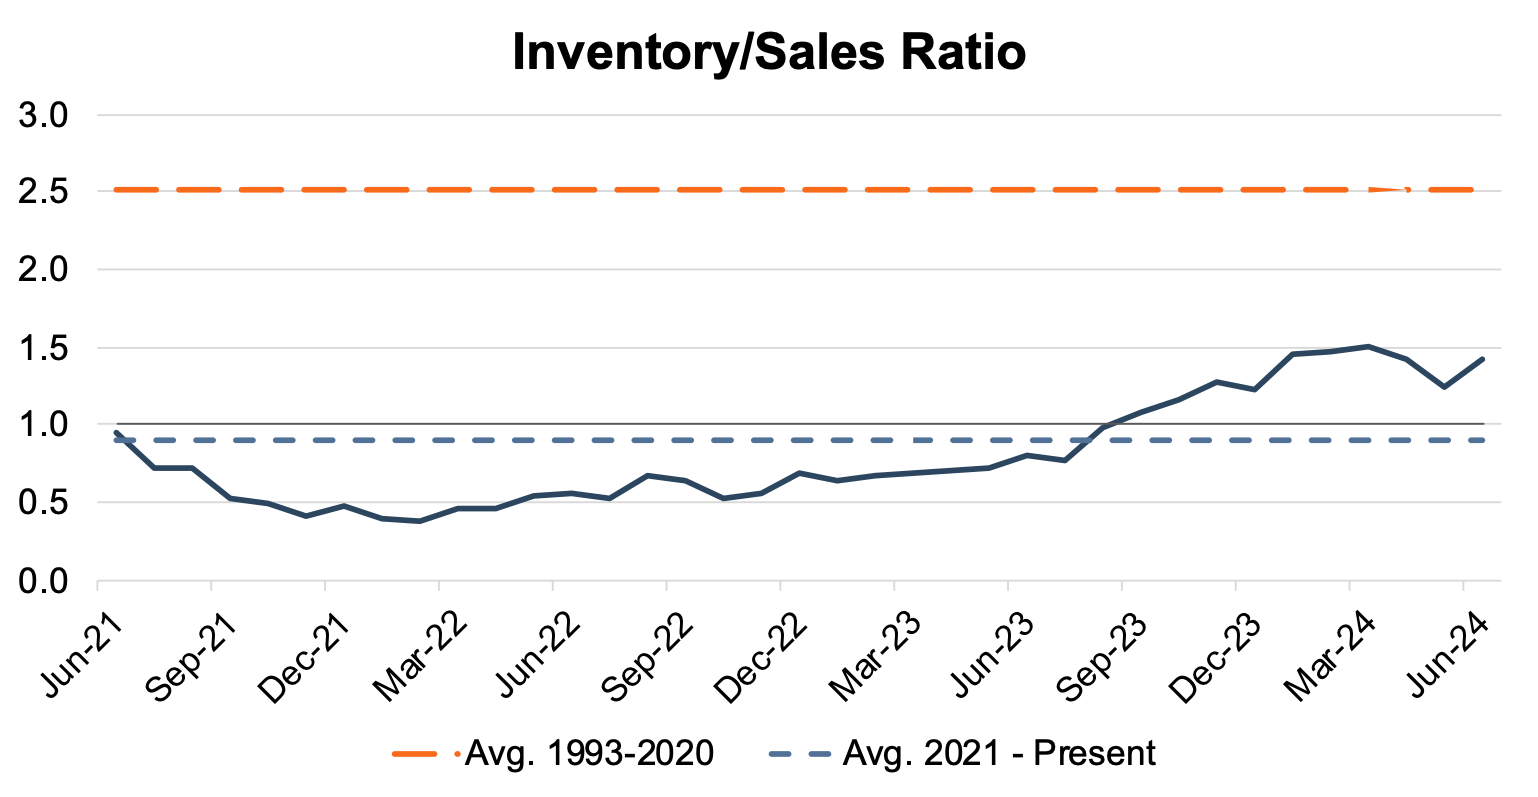 Following fairly elevated inventory levels in June, days’ supply (another indication of the relationship between auto sales and inventory) came in at 52 days in July 2024. While this is certainly higher than the same time last year and reflects a recovery in the manufacturing supply chain at a global level, this measure of average inventory availability obscures the large differences in days’ supply by brand. For example, Toyota has been reported to have a days’ supply below 20 days while Stellantis has been reported at nearly 100 days or more. The chart below presents days’ supply for U.S. Light Vehicles over the past twelve months (per Wards Intelligence).
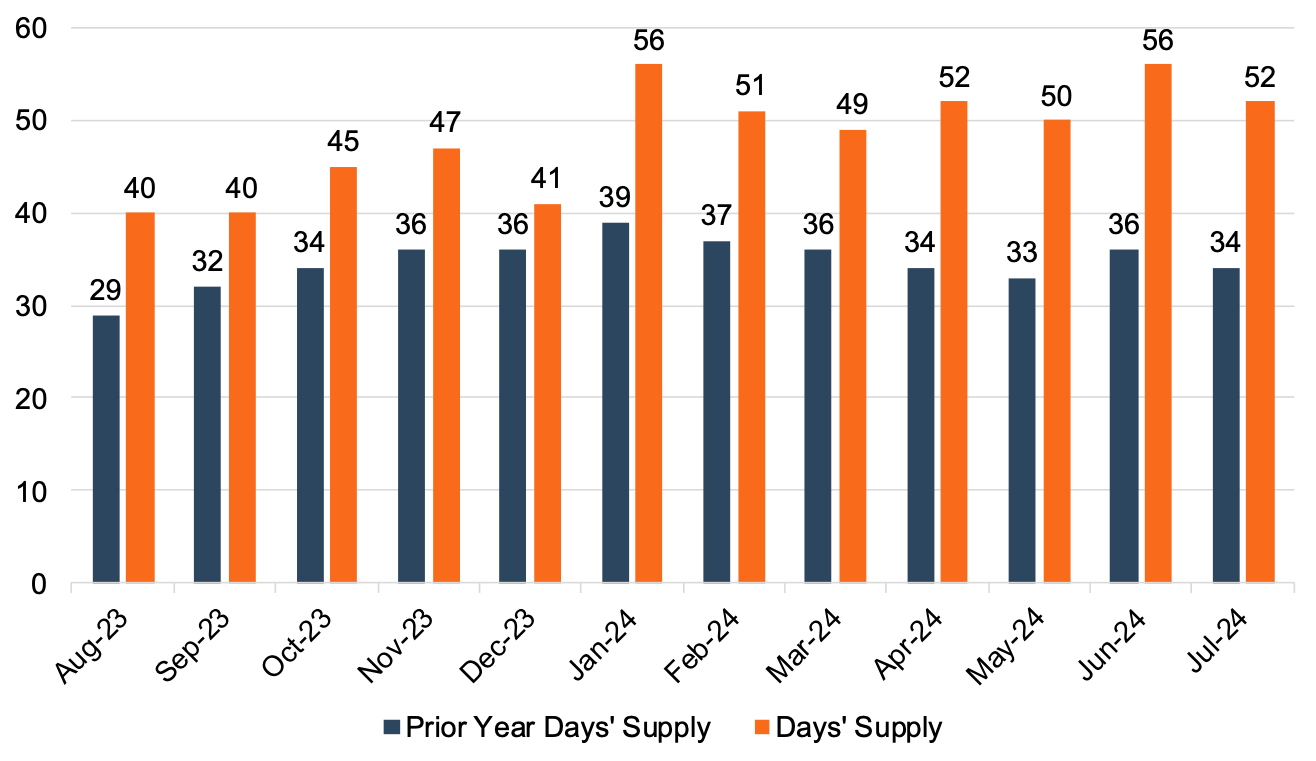
Transaction Prices
Thomas King, the president of data and analytics at J.D. Power, discussed the factors impacting average transaction prices for new vehicles in July:
“The average new-vehicle retail transaction price is declining compared with a year ago due to higher manufacturer incentives, larger retailer discounts, and rising availability of lower-priced vehicles increases. Transaction prices are trending towards $44,271—down $1,166 or 2.6%—from July 2023. The combination of slightly higher retail sales and lower transaction prices means that buyers are on track to spend nearly $47.8 billion on new vehicles this month—3% higher than July 2023 and the second highest July on record.”
J.D. Power indicates the average used vehicle price in July was $28,070, down 5.4% from last year. Additionally, trade-in values are down 12.5% from last July. As inventory levels stabilize and, in some cases, become inflated, certain brands are forced to ramp up incentives. We expect the average transaction price to moderate in the second half of 2024, particularly as vehicle purchasing for many consumers is about fitting payments within constrained monthly budgets, and declining trade-in values increase auto loan balances. Again, it is important to note that even though average transaction prices have contracted in recent months, the average transaction price is still above pre-pandemic levels.
Incentive Spending and Profitability
With only about 14.5% of new vehicles transacting above MSRP in July 2024, total retailer profit per unit is expected to drop nearly 33% to $2,298 from this time last year in July 2023. Such a drop in per-unit profitability stresses the very different pricing and inventory environment the industry is experiencing in 2024 compared to the last three years. Profitability will likely look very different for dealers in this post-pandemic environment and is approaching pre-COVID levels.
Incentive spending from manufacturers typically displays an inverse relationship with per-unit profitability, as incentive spending is designed to increase volumes at the expense of profitability. Furthermore, certain manufacturers are in a situation where there is an outsized days’ supply of their vehicles in the market. In the face of over-inventoried brands, incentives will likely be the primary tool used by manufacturers to sell these units and normalize inventory levels across the country. Given this environment, J.D. Power notes that average incentive spending per unit in July 2024 is expected to be $2,892, up 52% from July 2023. Incentive spending as a percentage of the average MSRP is expected to reach 5.9% in July 2024, an increase of 1.9 percentage points from July 2023. This dynamic has occurred many times in the auto industry. All it takes is one OEM to overproduce, starting a vicious downward cycle for dealers of incentives and intense battling for market share. While auto dealers had hoped that lessons learned about leaner inventories over the past few years would stick, it is appearing less and less likely to be a new normal for the industry.
August 2024 Outlook
Mercer Capital expects the August 2024 SAAR to land within the 15.5 to 16 million range as a portion of the Labor Day holiday weekend falls in August this year. Throughout the remainder of 2024, we expect to see pressure on the average transaction price and per-unit dealer profit as expanding inventory levels drive incentive spending higher.
Mercer Capital provides business valuation and financial advisory services, and our auto team helps dealers, their partners, and family members understand the value of their business. Contact a member of the Mercer Capital auto dealer team today to learn more about the value of your dealership.