June 2024 SAAR


The June 2024 SAAR came in at 15.3 million, a 4.0% drop from last month and a 4.8% drop from June 2023. According to Wards Intelligence, the CDK cyberattack caused a 50,000-unit deficit during June 2024; however, second-quarter sales were still relatively flat (-0.4%) from the second quarter of 2023 as only 11 of 91 days were impacted in the quarter.
Mercer Capital’s auto dealer valuation team anticipated the SAAR to come in around the 16 million mark in June 2024, but the June 19th cyberattack had other plans. Impacting the dealership management (“DMS”) used by nearly 15,000 stores nationwide, the cyberattack forced dealers to revert to manual processes that hindered vehicle sales throughout the rest of the month. For more background on the CDK cyberattack, take a look at our recent blog post covering the attack. We now know that substantially all stores impacted by the cyberattack are back online as of July 2024.
Unadjusted Sales Data
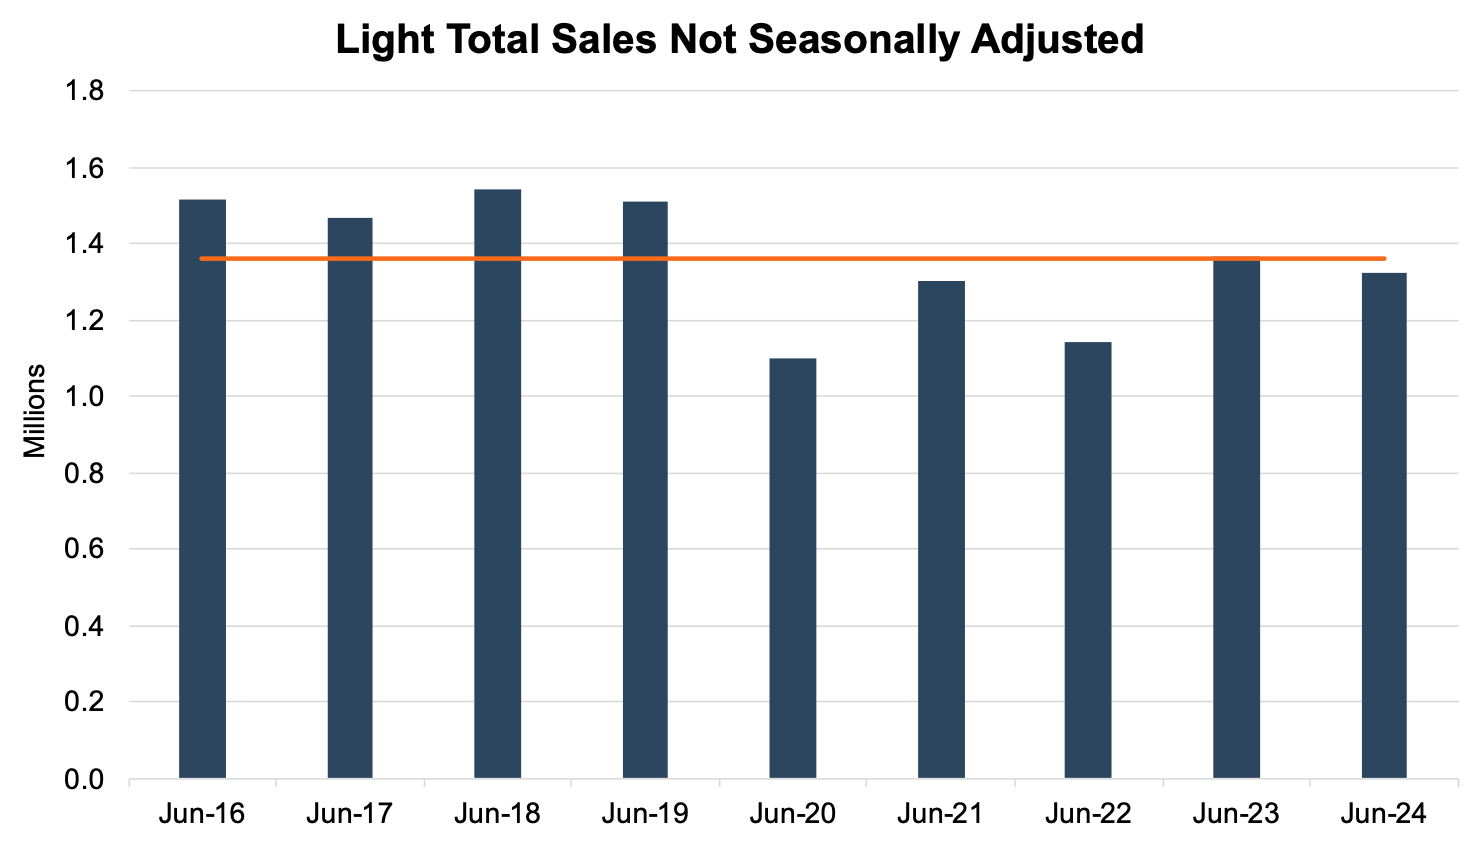
On an unadjusted basis, the industry sold 1.32 million total units in June 2024, a 7.6% decrease from last month. Even with the impact of the CDK cyberattack, unadjusted June 2024 sales fell just shy of the nine-year average, which captures the pandemic year as well as the four years before and after. If Wards Intelligence’s 50k unit deficit is accurate, June’s sales would’ve been above the 9-year average. The chart below shows unadjusted total sales volumes for the last nine Junes and the nine-year average in orange:
Inventory and Days’ Supply
An inventory-to-sales ratio greater than 1.0x indicates that the seasonally adjusted inventory level at the end of the month was greater than reported sales; this data tends to lag by a month or two.
In May 2024, the inventory-to-sales ratio dropped to 1.25x from 1.39x in April 2024. May 2024 marks the ninth consecutive month above the 1.0x threshold, suggesting the industry has found its footing when it comes to inventory production and accumulation. The chart below illustrates the industry’s inventory-to-sales ratio over the last three years.
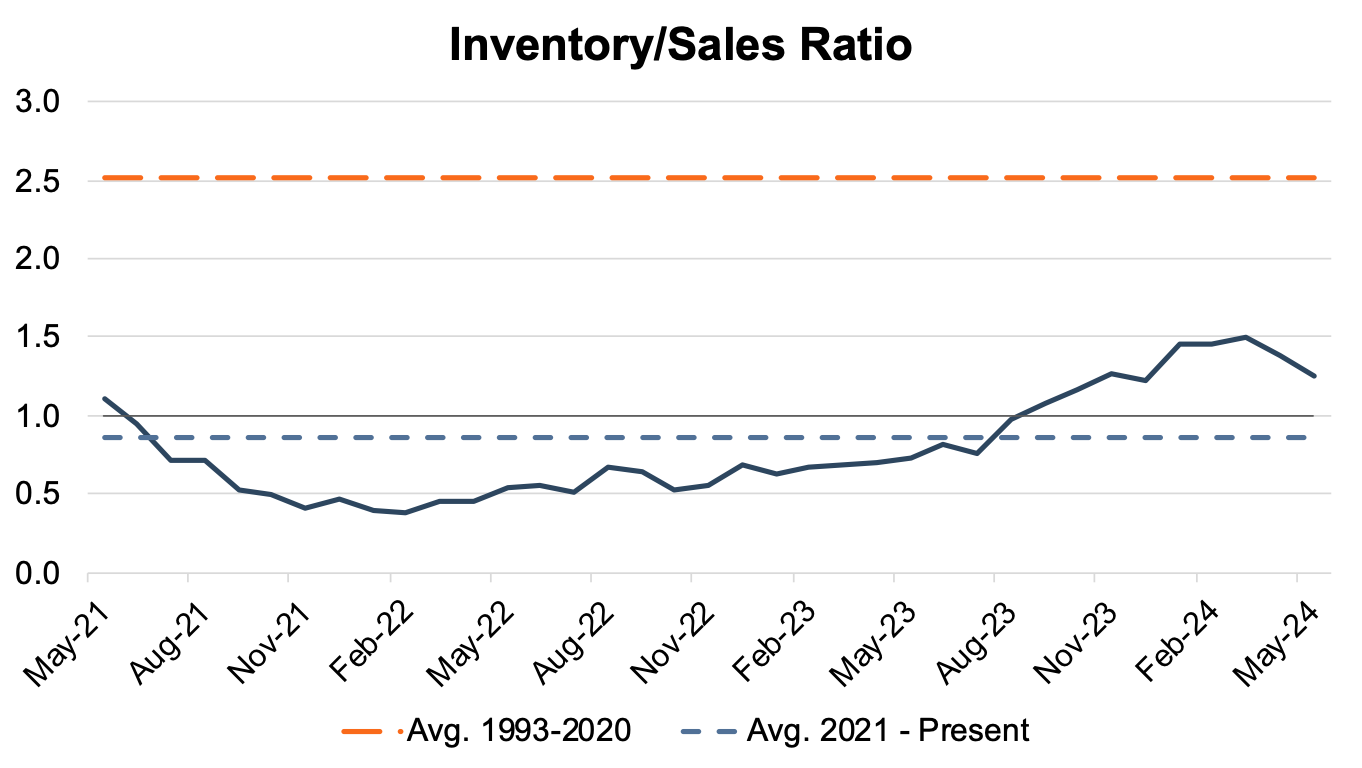
As mentioned above, the inventory-to-sales ratio data tends to lag, meaning the full impact of the CDK cyberattack on this particular metric will not be realized for another month or so. That said, we can safely predict, all else equal, that the June 2024 ratio is likely to spike as inventory was elevated and sales fell.
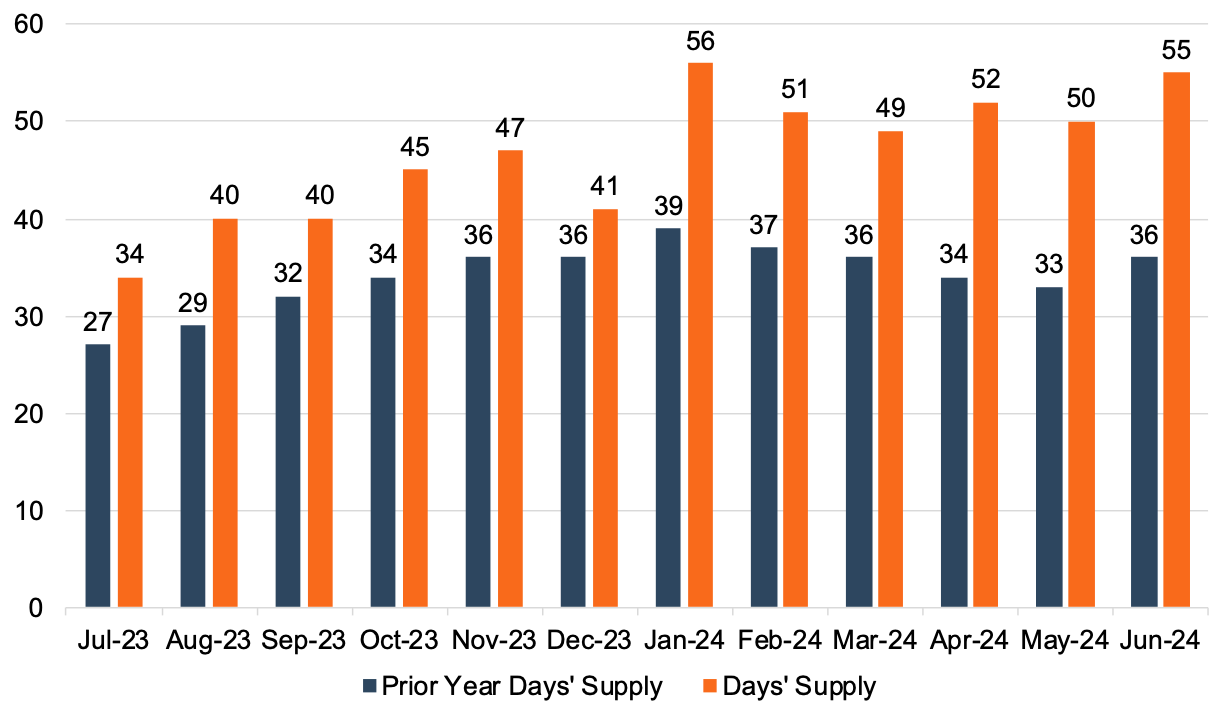
Days’ Supply, another indication of the relationship between auto sales and inventory, came in at 55 days in June 2024. While inventory was somewhat elevated during June due to the reduced sales capacity associated with the CDK cyberattack, we believe that Days’ Supply will likely be closer to 50 days in the coming months. However, it’s worth noting that industry averages were closer to 60-90 days pre-COVID and chip shortage. June’s high could be a blip, but it still indicates a larger trend returning to normal, despite some auto executives indicating years ago that the lower Days’ Supply might end up being a “new normal.” The chart below presents Days’ Supply for U.S. Light Vehicles over the past twelve months (per Wards Intelligence):
Transaction Prices
The president of data and analytics at J.D. Power, Thomas King, discussed the downward trajectory of average transaction prices for new vehicles in June:
“The average new-vehicle retail transaction price is declining compared with a year ago as manufacturer incentives rise, retailer profit margins decline, and availability of lower-priced vehicles increases. Transaction prices are trending towards $44,857—down $1,372 or 3%—from June 2023. The combination of slightly higher retail sales and lower transaction prices means that buyers are on track to spend nearly $44.6 billion on new vehicles this month—6.5% lower than June 2023 but the fourth highest June on record.”
According to J.D. Power, the average used vehicle price in June was $28,208, down 6.3% from last year. Trade-in values, which are reflective of used-vehicle prices, are down nearly 17% from last June. We expect the average transaction price to continue to moderate in the coming months as inventory levels strengthen. Even though average transaction prices have contracted in recent months, we note that the average transaction price is still above pre-pandemic levels.
Incentive Spending and Profitability
With only about 16.9% of new vehicles transacting above MSRP in June 2024, total retailer profit per unit is expected to drop nearly 32.3% to $2,407 from this time last year in June 2023. A drop in per-unit profitability of this magnitude highlights the very different pricing and inventory environment that the industry is experiencing in 2024 compared to last year and especially 2021 and 2022. Profitability will likely look very different for dealers in this post-pandemic environment and approaching pre-COVID levels. Dealers will likely need to focus on increasing sales volumes going forward instead of relying on outsized margins on fewer unit sales. However, as most dealers know, it’s a delicate balance as chasing volumes can reduce front-end profits further.
Incentive spending from manufacturers typically displays an inverse relationship with per-unit profitability. This makes sense, as incentive spending is designed to incentivize dealers to sell units and have some price flexibility in the selling process. J.D. Power notes that average incentive spending per unit in June 2024 is expected to be $2,625, up 51.2% from June 2023. Incentive spending as a percentage of the average MSRP is expected to reach 5.3% in June 2024, an increase of 1.8 percentage points from June 2023.
July 2024 Outlook
Mercer Capital expects the July 2024 SAAR to come in above 16 million. We believe it is reasonable to expect many of the lost sales from June 2024 will be pushed into July 2024, especially with the long 4th of July weekend coinciding with when many dealers came back online; the outage stretching into this long weekend may have had significantly greater impacts. As we move into the second half of 2024, we expect to see pressure on average transaction price and per-unit dealer profit as expanding inventory levels drive incentive spending higher.
Mercer Capital provides business valuation and financial advisory services, and our auto team helps dealers, their partners, and family members understand the value of their business. Contact a member of the Mercer Capital auto dealer team today to learn more about the value of your dealership.