

The May 2024 SAAR was just shy of the 16 million mark, coming in at 15.9 million units, generally flat from last month (+0.8%) and reflecting year-over-year growth of 2.5%. Throughout the pandemic years, the auto industry was defined by volatility and uncertainty as inventory levels plummeted and transaction prices skyrocketed. In the first half of 2024, however, we have seen more stability in the SAAR as inventory levels rise and transaction prices moderate. For a closer look at the key metric trends in the first half of 2024, check out Scott Womack’s Mid-Year Review of the Auto Dealer Industry.
Unadjusted Sales Data
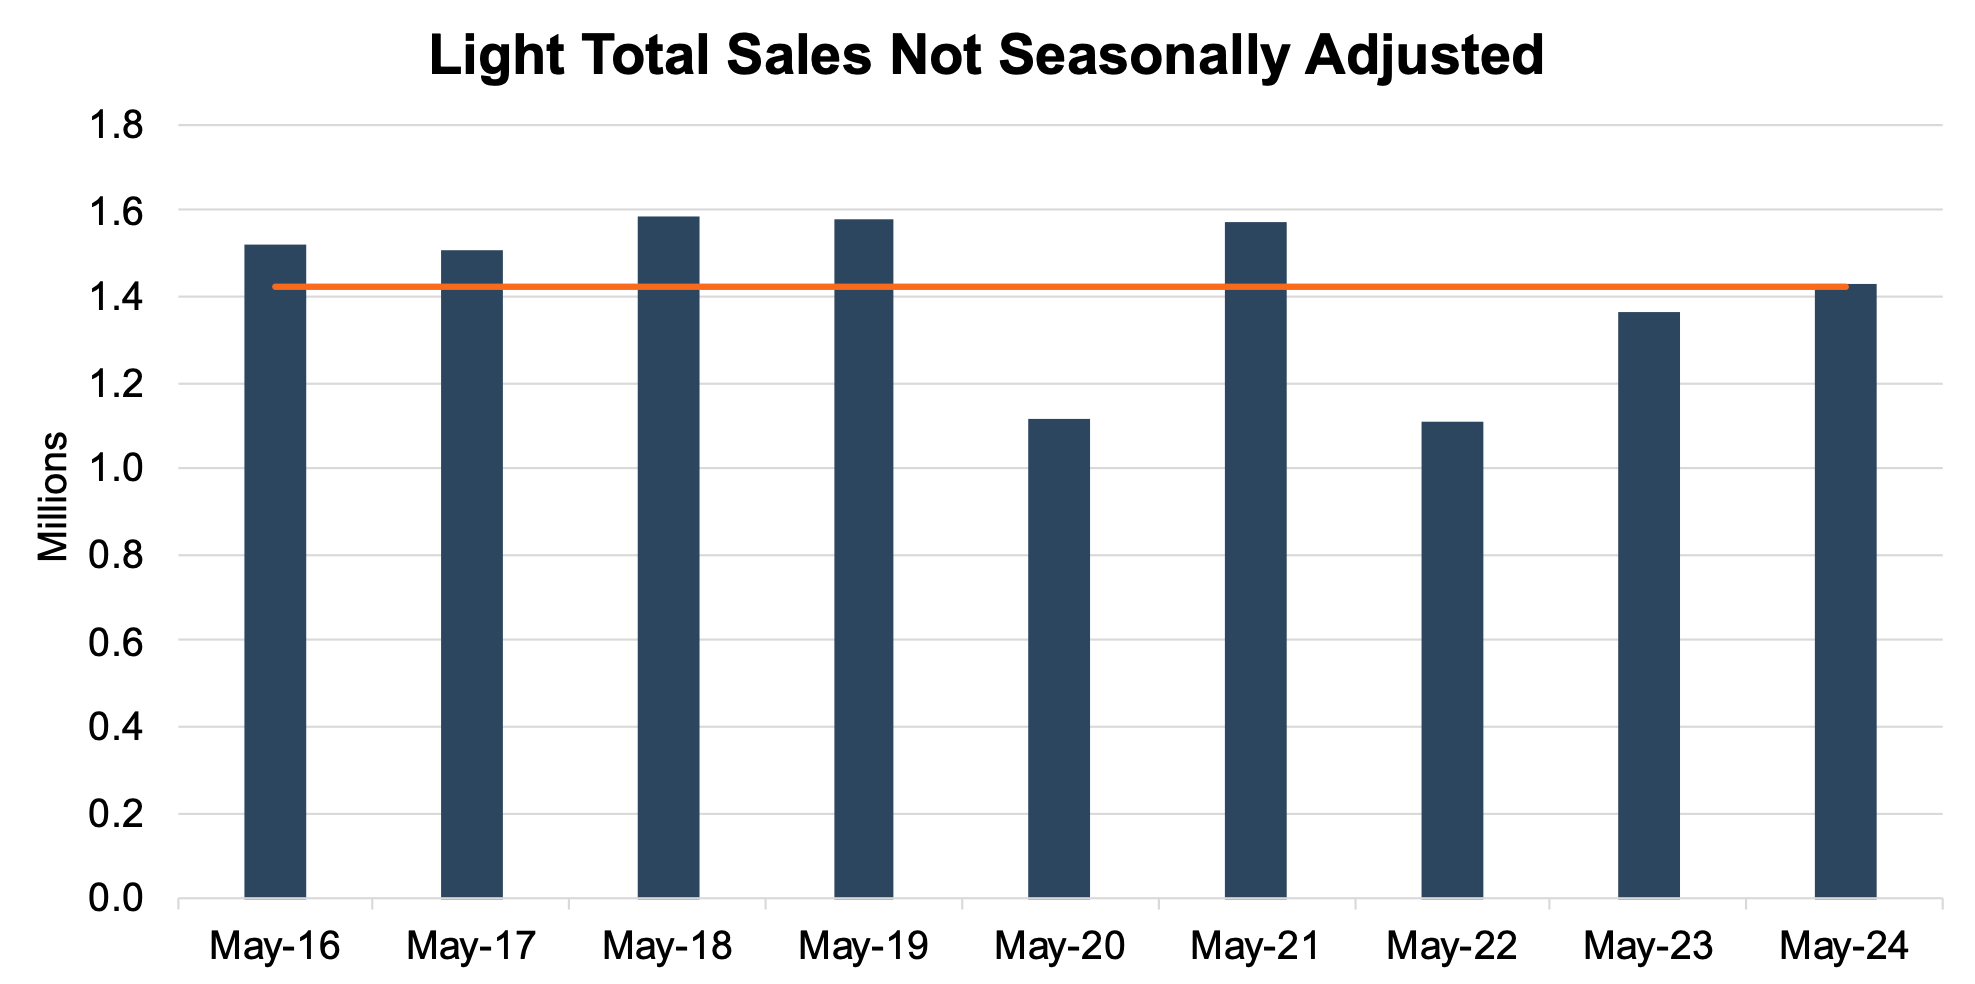
On an unadjusted basis, the industry sold 1.43 million total units in May 2024, an 8.3% decrease from last month. While unadjusted sales are still catching up with pre-pandemic levels, May 2024 sales are approaching the nine-year average (encapsulates the pandemic year as well as the four years before and after). The chart below shows unadjusted total sales volumes for the last nine Mays and the nine-year average in orange:
Inventory and Days’ Supply
An inventory-to-sales ratio greater than 1.0x indicates that the seasonally adjusted inventory level at the end of the month was greater than reported sales; this data tends to lag by a month or two. In April 2024, the inventory-to-sales ratio dipped slightly to 1.33x from 1.39x in March 2024. April 2024 marks the eighth consecutive month above the 1.0x threshold, suggesting the industry inventory has largely recovered from the lower levels seen throughout the pandemic. The chart below illustrates the industry’s inventory-to-sales ratio over the last three years.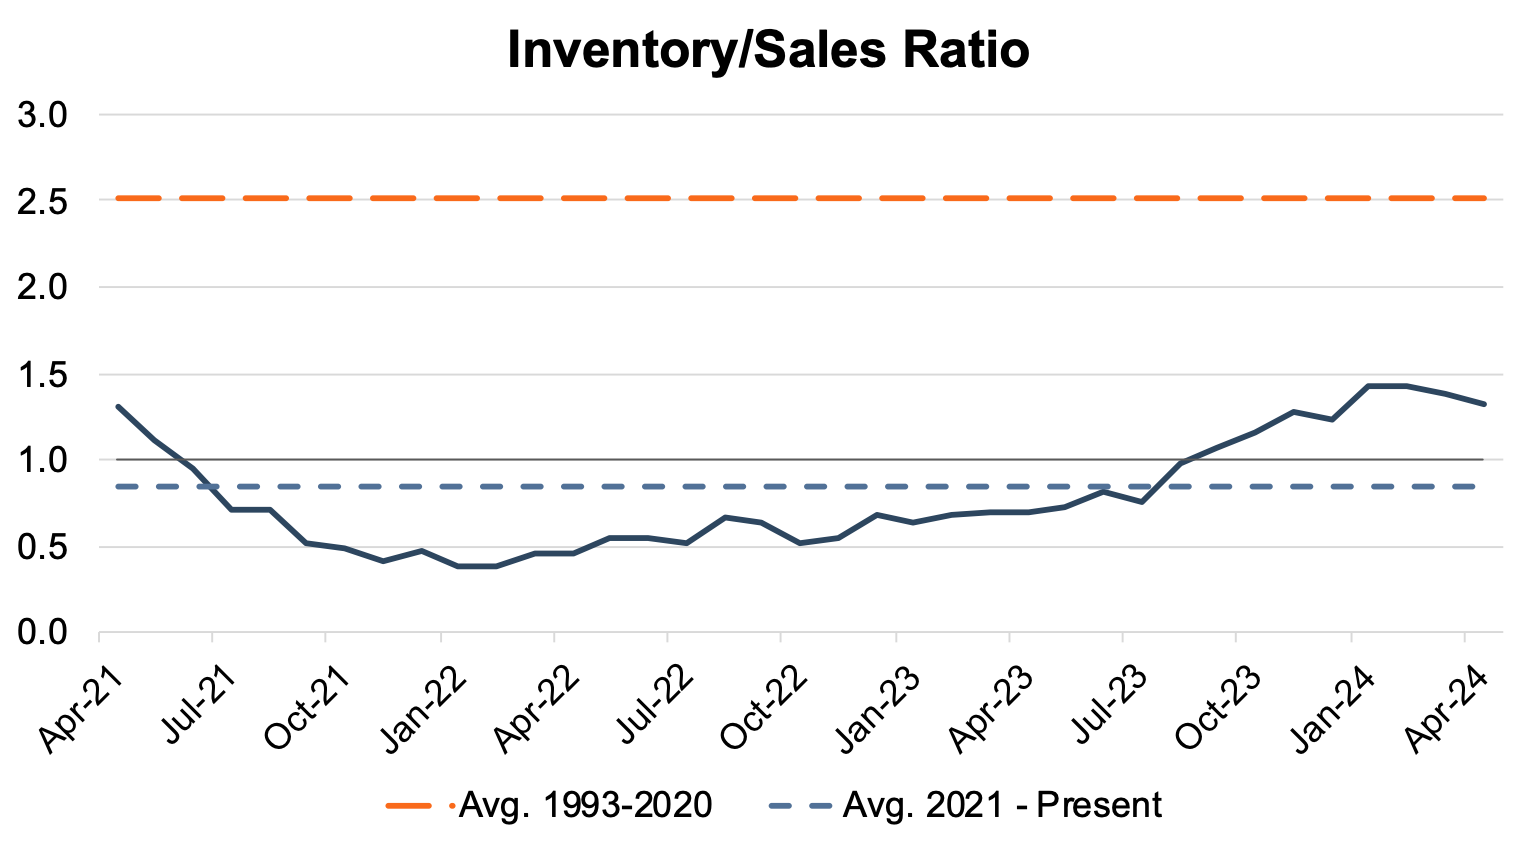 Days’ Supply, an indication of the relationship between auto sales and inventory, has continued to exceed last year’s levels. May 2024 Days’ Supply came in at 50, and we believe it is likely that Days’ Supply will hover around 50 for the next few months. The chart below presents Days’ Supply for U.S. Light Vehicles over the past twelve months (per Wards Intelligence):
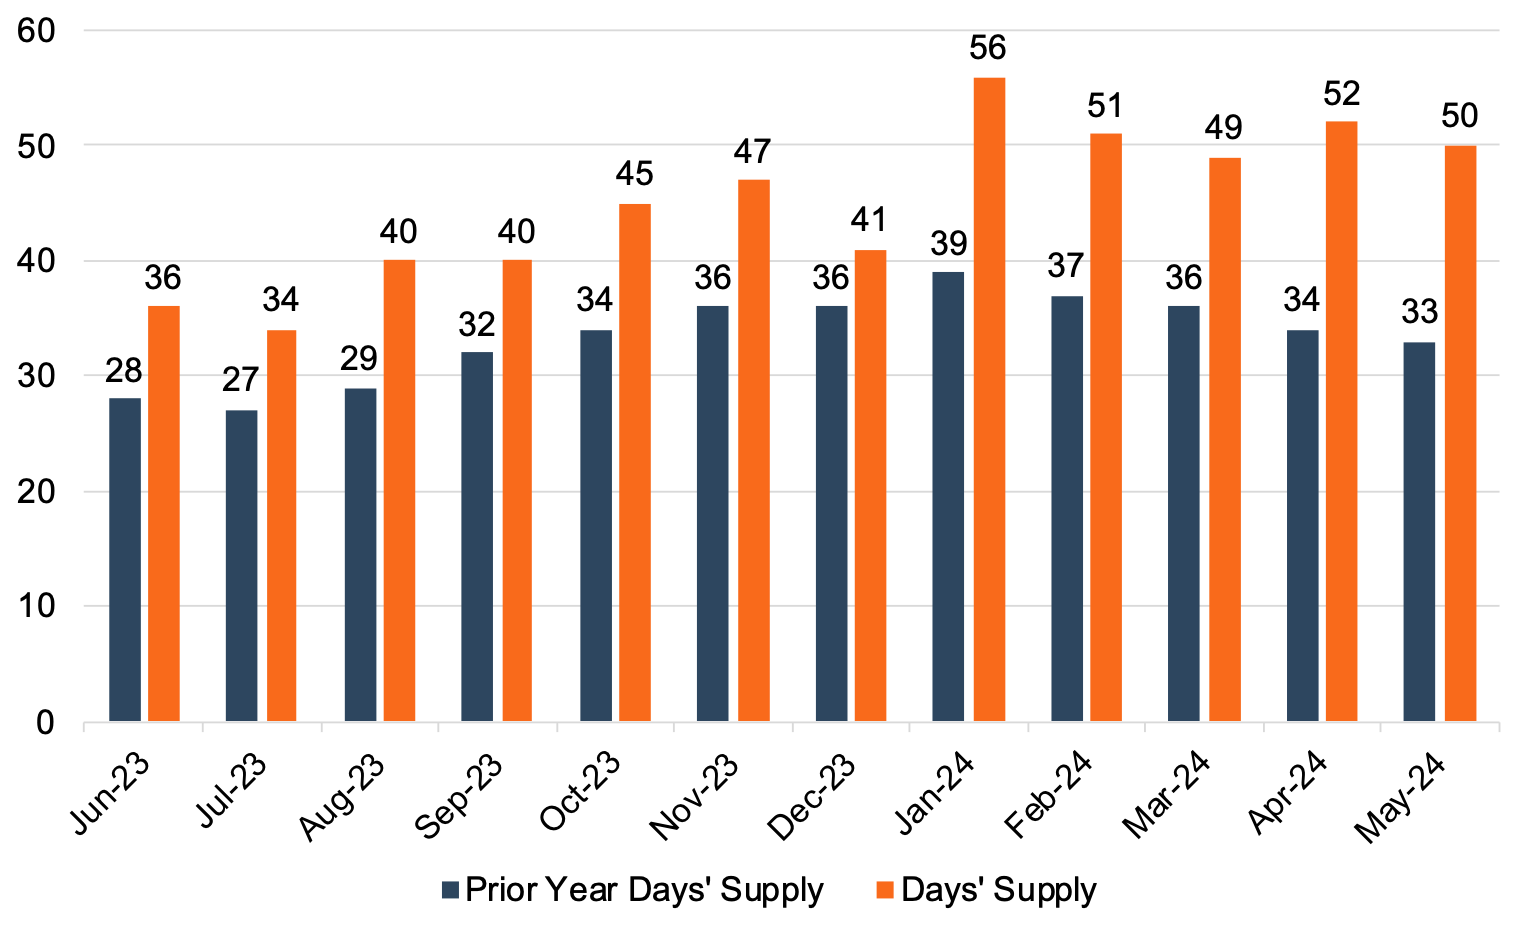
 Transaction Prices
The president of data and analytics at J.D. Power, Thomas King, discussed the downward trajectory of average transaction prices for new vehicles in May:
“The average new-vehicle retail transaction price is declining compared with a year ago as manufacturer incentives rise, retailer profit margins fall and availability of lower-priced vehicles increases. Transaction prices are trending towards $45,033—down $1,045 or 2.3%—from May 2023. The combination of slightly higher retail sales but lower transaction prices means that shoppers are on track to spend nearly $50.9 billion on new vehicles this month—6.8% higher than May 2023 and the second highest May on record.”
According to J.D. Power, the average used vehicle price in May was $28,470, down 5.4% from last year. Declining transaction prices have also impacted trade-in values, which are down about 15% from last May. As inventory levels strengthen, the average transaction price will likely continue to moderate in the coming months. While transaction prices have contracted in recent months, it is important to note that the average transaction price remains higher than pre-pandemic levels, and vehicle buyers will likely see higher monthly payments due to the current high interest rate environment.
Incentive Spending and Profitability
With only about 14.9% of new vehicles transacting above MSRP in May 2024, total retailer profit per unit is expected to drop nearly 31.5% to $2,471 from May 2023. Thomas King highlights the continued pressure on dealer profitability in May:
“Expected new-vehicle sales results for May represent a mixed bag of outcomes. On the positive side, the total sales pace will exceed 16 million units for the first time this year. Also, discounts are similar to last month, despite May being a month in which discounts traditionally increase to take advantage of elevated shopping activity during the Memorial Day weekend. This is good news for manufacturer and retailer profitability. However, the industry continues to produce more vehicles than are being sold, leading to rising inventories and increasing the likelihood of elevated discounts as the year progresses.”
We note Mr. King’s forecast as of late May of a 16 million SAAR was just above the actual SAAR of 15.9 million.
J.D. Power notes that average incentive spending per unit in May is expected to hit $2,640, up 48% from May 2023. Incentive spending as a percentage of the average MSRP is expected to reach 5.3% in May 2024, reflecting an increase of 1.7 percentage points from May 2023.
June 2024 Outlook
Mercer Capital expects the June 2024 SAAR to come in above 16 million. As we move into the second half of 2024, we expect to see pressure on average transaction price and per-unit dealer profit as expanding inventory levels drive incentive spending higher.
Mercer Capital provides business valuation and financial advisory services, and our auto team helps dealers, their partners, and family members understand the value of their business. Contact a member of the Mercer Capital auto dealer team today to learn more about the value of your dealership.