
As the summer winds down and we turn the calendar to August, the first half of 2023 is fully in the rearview mirror, and mid-year statistics for the auto industry have been released. How has the industry performed, and what do the metrics tell us about the direction the industry is headed for the remainder of 2023? In this post, we discuss several key metrics that we have tracked in this space over the last several years: new vehicle profitability, the supply of new vehicles, average trade-in equity values of used vehicles, the used-to-new vehicle retail unit sales ratio, fleet sales, and vehicle miles traveled.
New Vehicle Profitability
Total retailer profit per unit realized by auto dealers continues to remain strong despite a trio of trends: demand may be tempered due to high transaction prices and high interest rates, incentives offered by manufacturers have increased over the first half of the year, and vehicle supply continues to improve. But has this metric peaked? The chart below, created with elements provided by the JD Power and LMC Automotive forecast, illustrates the current and historical estimates have declined since the year-end high-water mark of $5,258 in December 2021. While these figures have cooled in recent months, the June 2023 figure of $3,692 per new vehicle unit is more than 1.5x the margin that dealers were experiencing in December 2020 and almost three times the margin realized in December 2019.
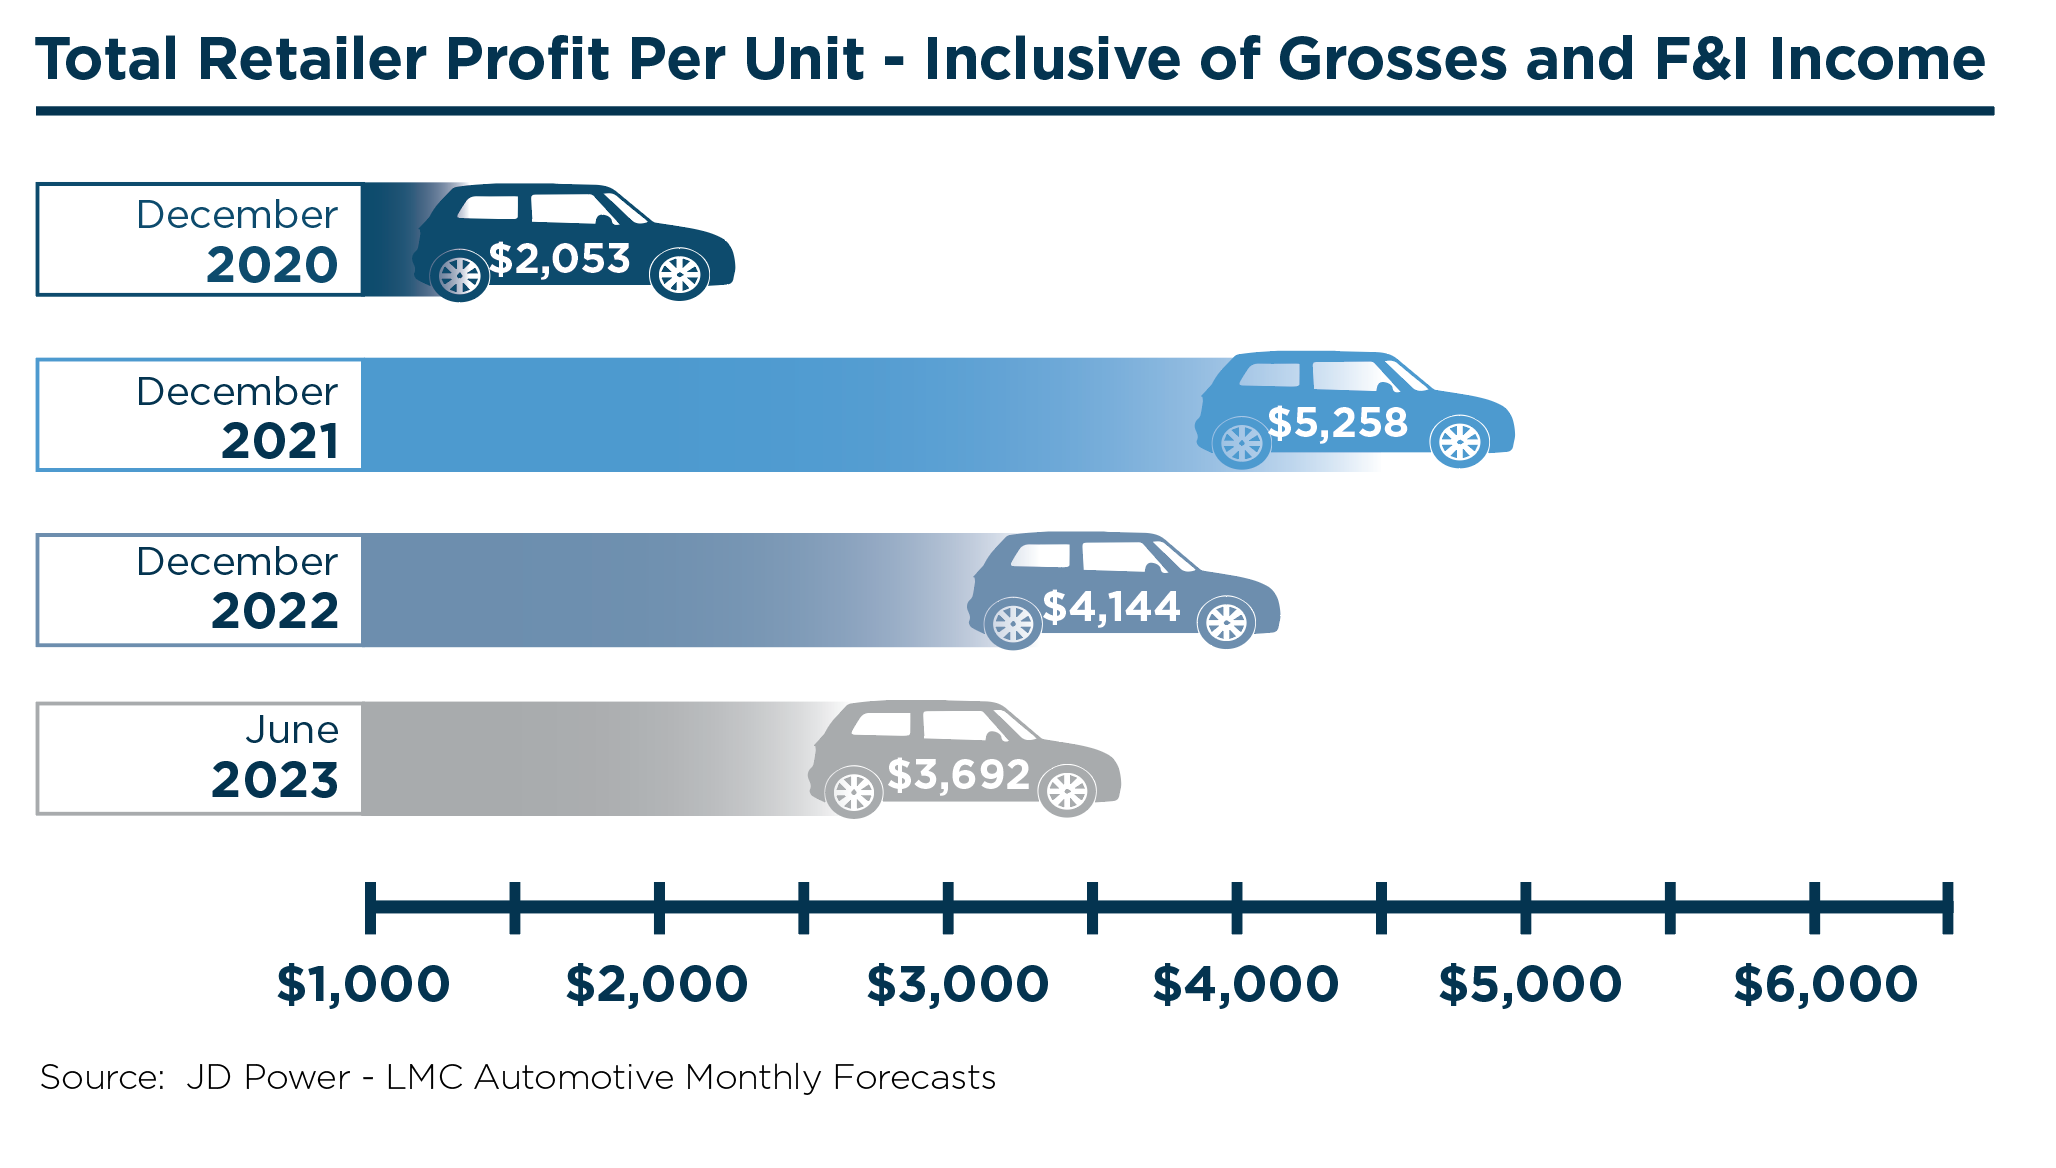 For context, JD Power reports that 30% of new vehicles sold above MSRP in June 2023, compared to 50% of new vehicles selling above MSRP this time last year. If these trends continue along with increased incentives from manufacturers, average transaction prices for new vehicles will cool slightly for the remainder of 2023 despite inflation and increased input costs for the OEMs. I recently listened to an industry webinar that described current market conditions for the auto industry. The auto dealer audience was polled throughout the webinar about their expectations about various metrics. When asked about their expectations for new vehicle profits for the remainder of the year, most responded that they expected profits to decline 10-15% from year-end 2022 figures. For perspective, even if new vehicle profits fell by 25% from year-end 2022 levels, new vehicle profits would still be 2.5x pre-pandemic figures.
Supply of New Vehicles
For the last couple of years, evidence of a tight supply of new vehicles could be seen in the lack of inventory on auto dealer lots across the country. We’ve written about average days’ supply for both new and used vehicles in this space on numerous occasions. We’ve also viewed this trend from a similar metric measuring the average time in days that a new vehicle sits on a dealer’s lot before it is purchased. The monthly forecasts provided by JD Power/LMC Automotive report these figures as 23 days and 28 days as of December 2022 and June 2023, respectively. Both figures indicate a steady climb and slight improvement over the prior-year-end low of 17 days in December 2021. While most experts are cautiously optimistic that the auto OEMs will not revert to the historical levels of production and inventory, the graphic below shows the context of the latest two figures to historical year-end figures:
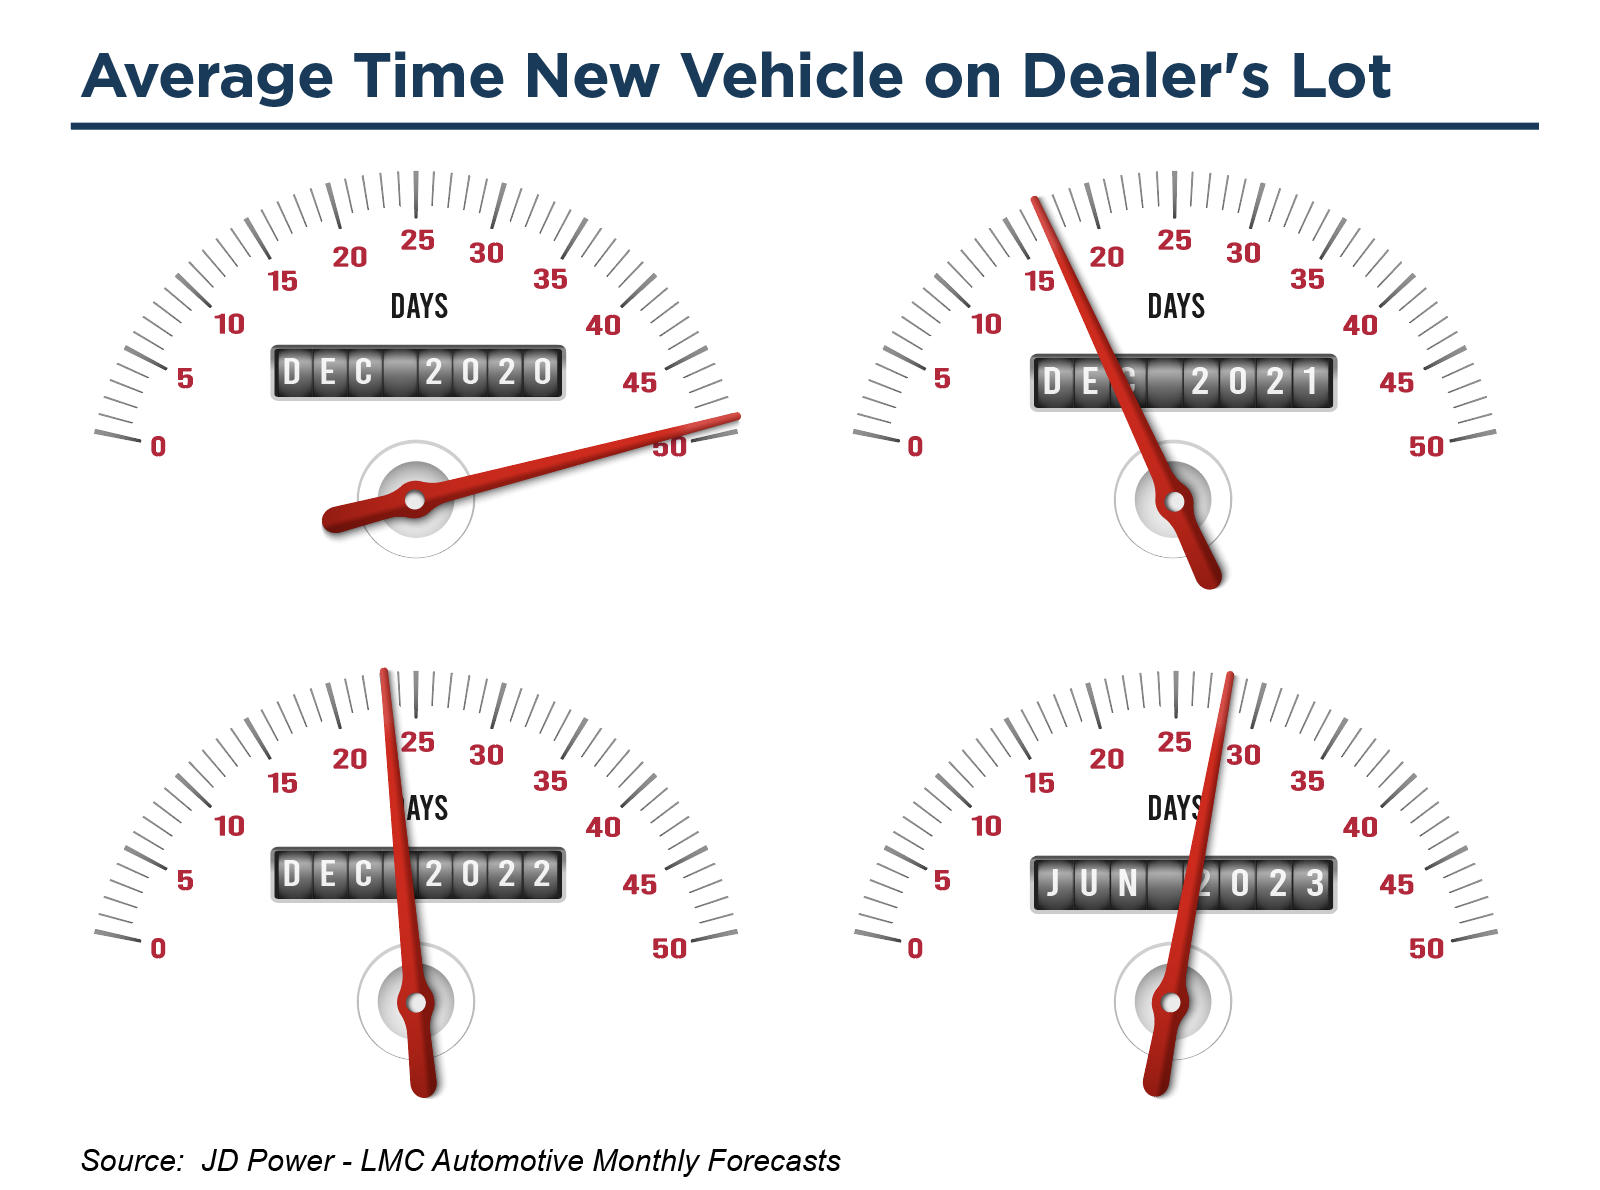 Within these average day figures, dealers continue to pre-sell a large portion of their reduced vehicle allocations during this post-pandemic transition and recovery from the microchip shortage. JD Power indicates that 46% of new vehicles are actually selling within ten days of arriving on a dealer’s lot. For context, this percentage is down from 57% of new vehicles sold within the first ten days on the lot in March 2022 but level with the percentage that dealers were experiencing at year-end 2022.
Average Trade-in Equity Used Vehicles
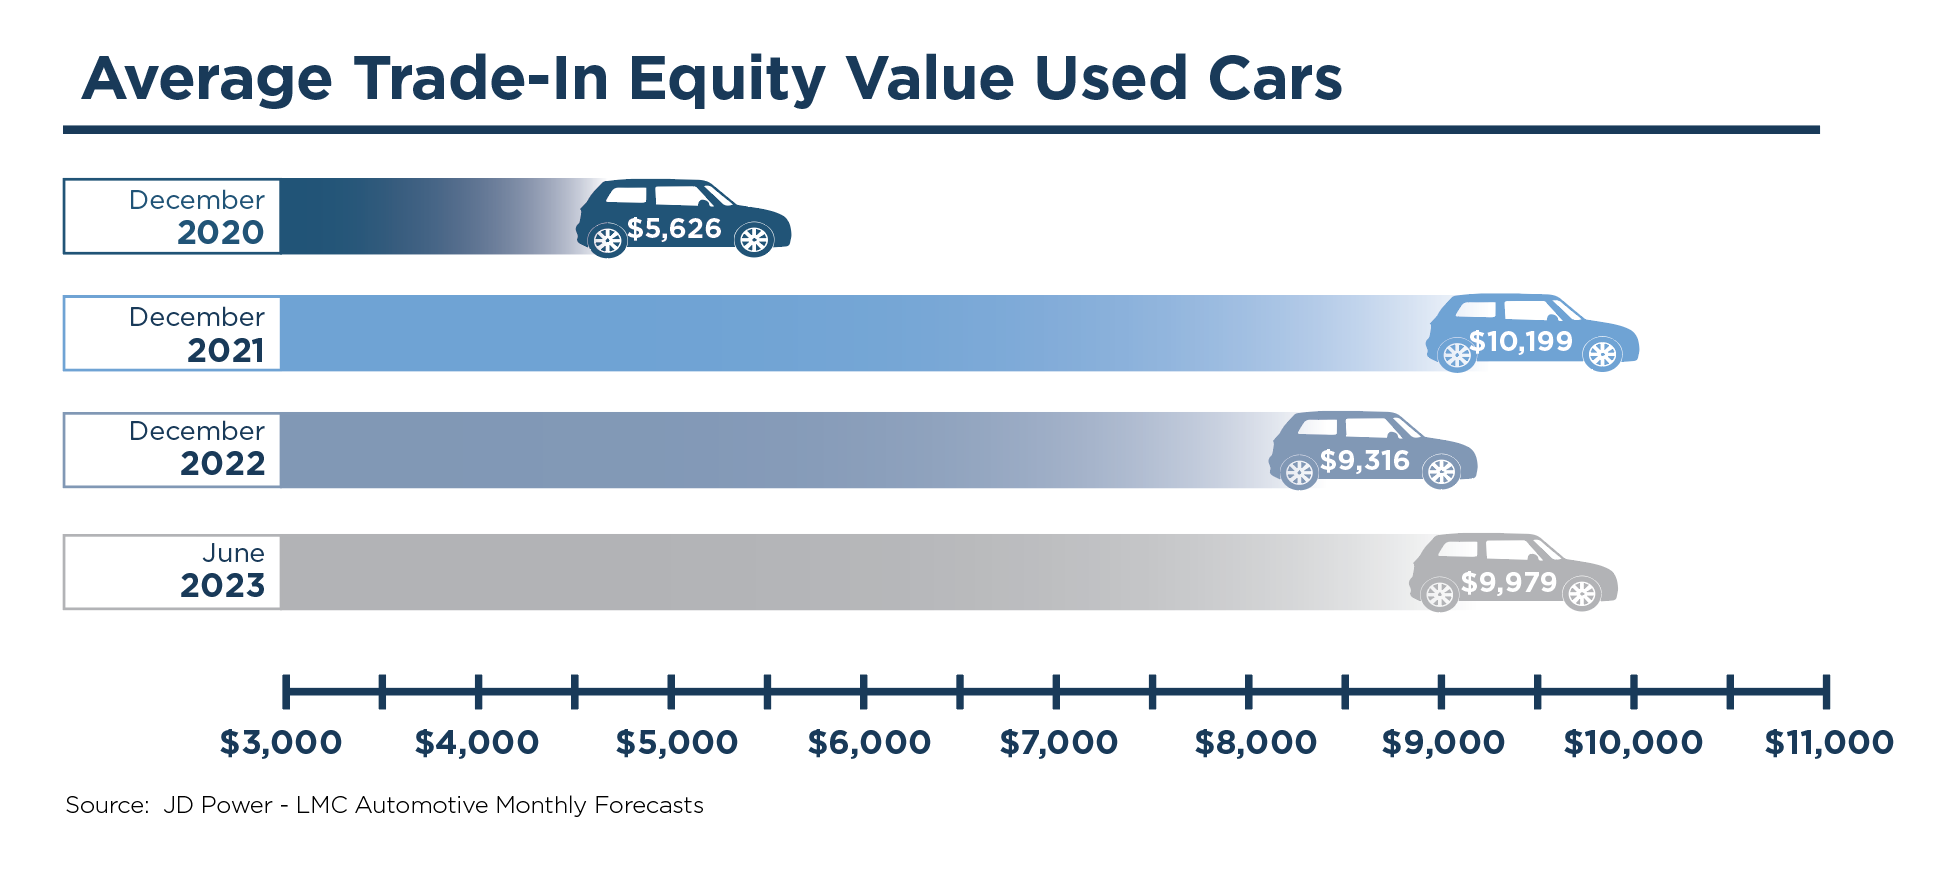
Like new vehicles, used vehicle transaction prices also soared during 2022 but have cooled some in recent months. Since fewer new vehicle units have been available to sell over the last few years, fewer used vehicles are traded into the dealer for resell. Increased demand for used vehicles led the average trade-in equity value for used cars to climb during the same period. Unlike other trends, the average trade-in equity value for used vehicles has climbed from year-end and early figures in 2023. According to the monthly forecasts from JD Power/LMC Automotive, the average trade-in equity value totaled $9,979 for June 2023 compared to $9,316 in December 2022.
Click here to expand the image above
With rising interest rates, consumers tend to focus more on their monthly payments. Despite average used vehicle transaction prices cooling slightly off record highs, we anticipate many consumers will choose to hold on to their vehicles longer during this time.
Used-To-New Vehicle Unit Ratio (Retail Only)
Click here to expand the image above
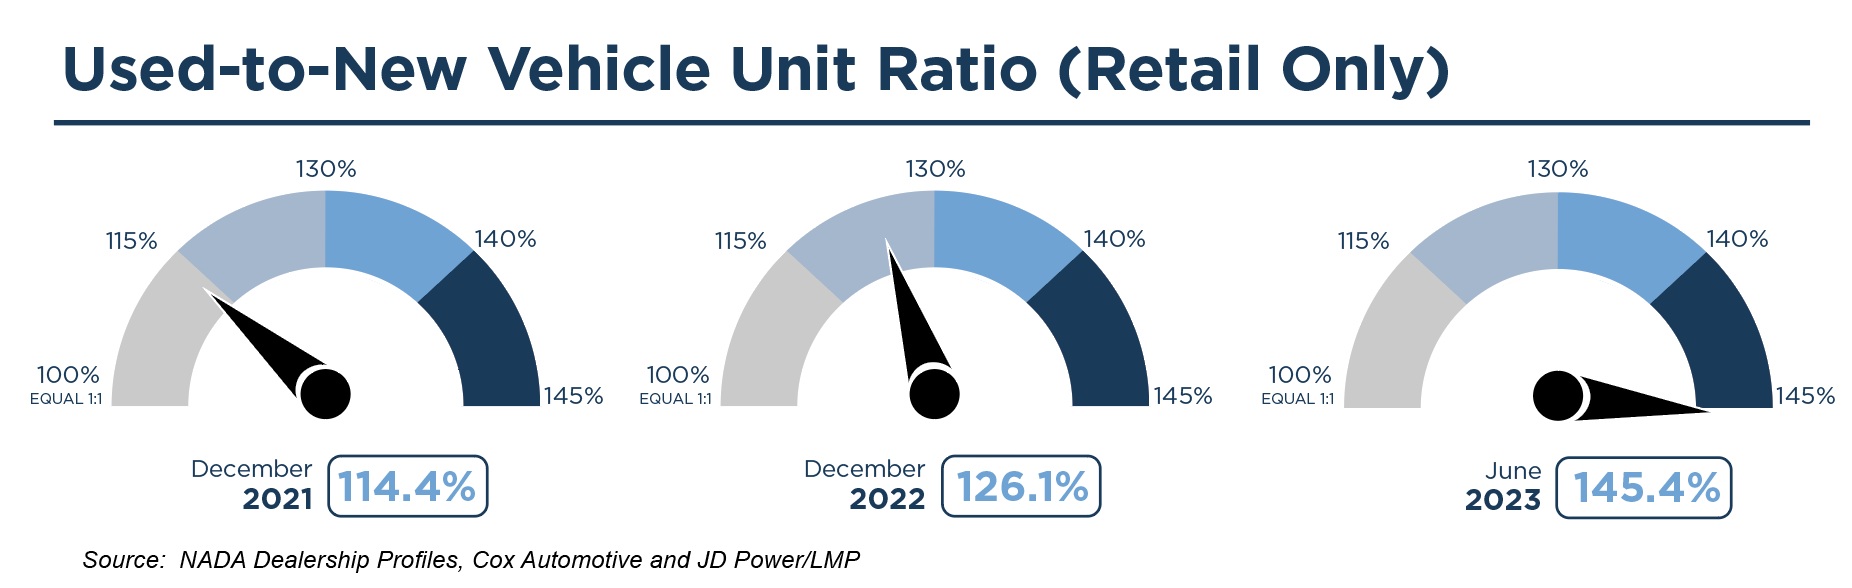
Historically, the gap between profits per unit earned on used and new vehicles was wider. For several years, auto dealers have made nearly as high margins on new vehicles as used vehicles. Despite improvements in production and supply, this ratio continues to be impacted by those conditions and the slow recovery from the microchip shortage. While average transaction prices for new and used vehicles continued to climb during the second half of 2022, average transaction prices for new and used vehicles have cooled slightly in the first half of 2023. With those conditions and the continued improvement in new vehicle supply in 2023, we expect the ratio of used to new vehicles to begin to decline in the coming years.
Fleet Sales
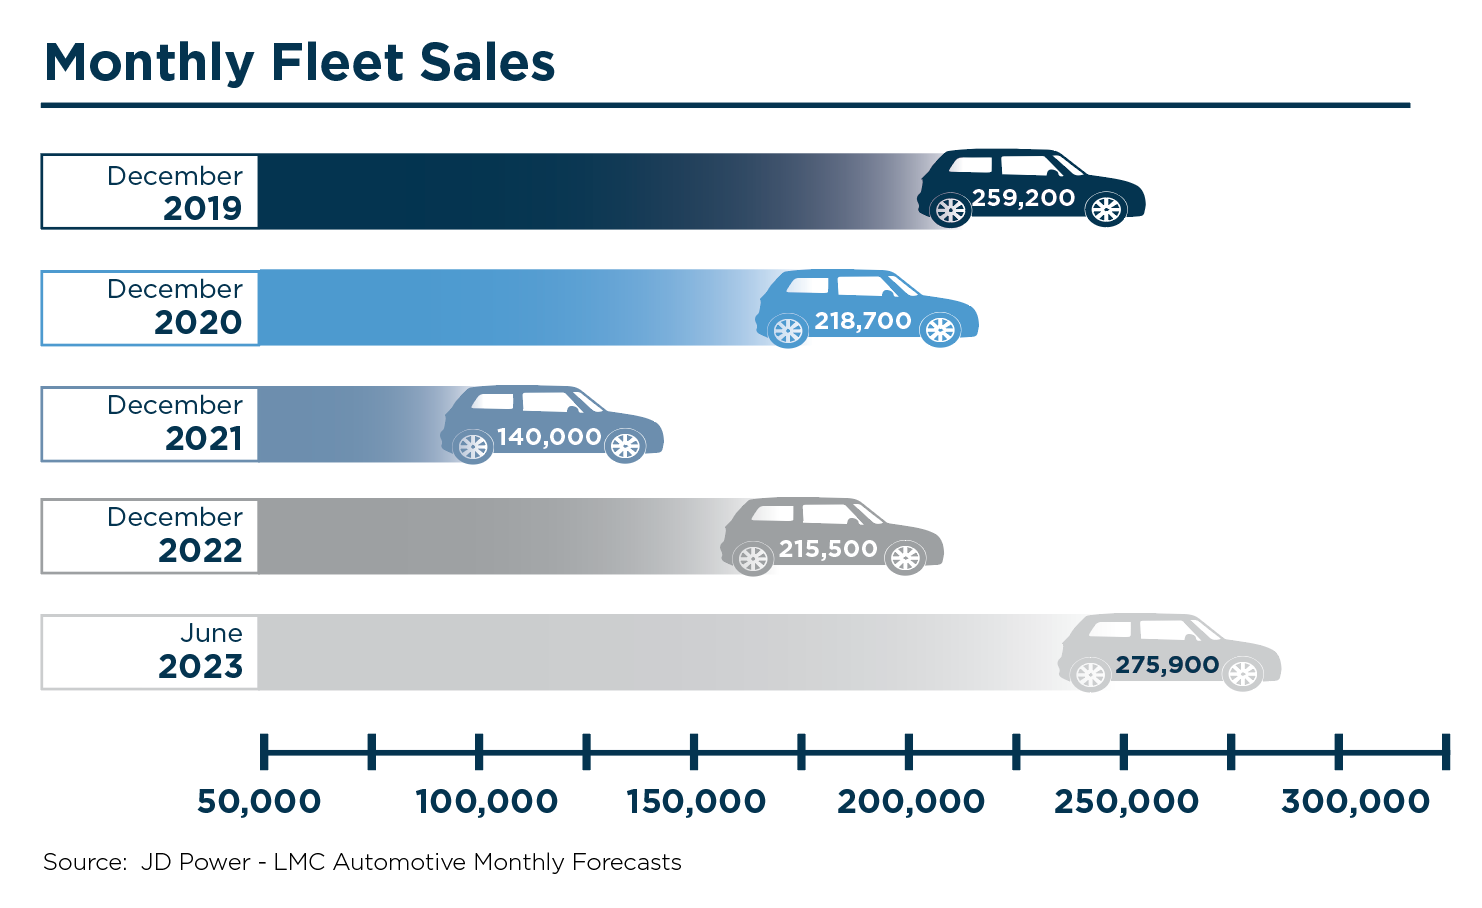
Fleet sales consist of sales to large rental car companies, commercial users, and government agencies. Historically, fleet sales allowed auto dealers to sell surplus inventory and larger blocks of units at a time. While fleet sales typically occurred at reduced margins compared to retail sales, they allowed auto dealers to put more vehicles in service. This would benefit the auto dealer’s fixed operations as those vehicles will eventually require service maintenance and parts. It also frees up capital for dealers to redeploy into inventory that will either sell at higher margins or turnover more quickly. Auto dealers anticipate that buyers of new vehicles will continue to return to the same dealership for those services during the lifetime of the warranty period and hopefully beyond.
During the height of the pandemic, fleet sales declined significantly. Rental car companies weren’t just canceling orders; they actively sold off their existing fleet to build up cash as cities endured temporary shutdowns and much of domestic travel was halted or significantly curbed. With travel returning and inventory supply improving, fleet sales are also steadily increasing. As seen in the graphic below, monthly fleet sales for June 2023 are estimated to be 275,900 units, the highest in the figures measured in the graph below:
Vehicle Miles Traveled
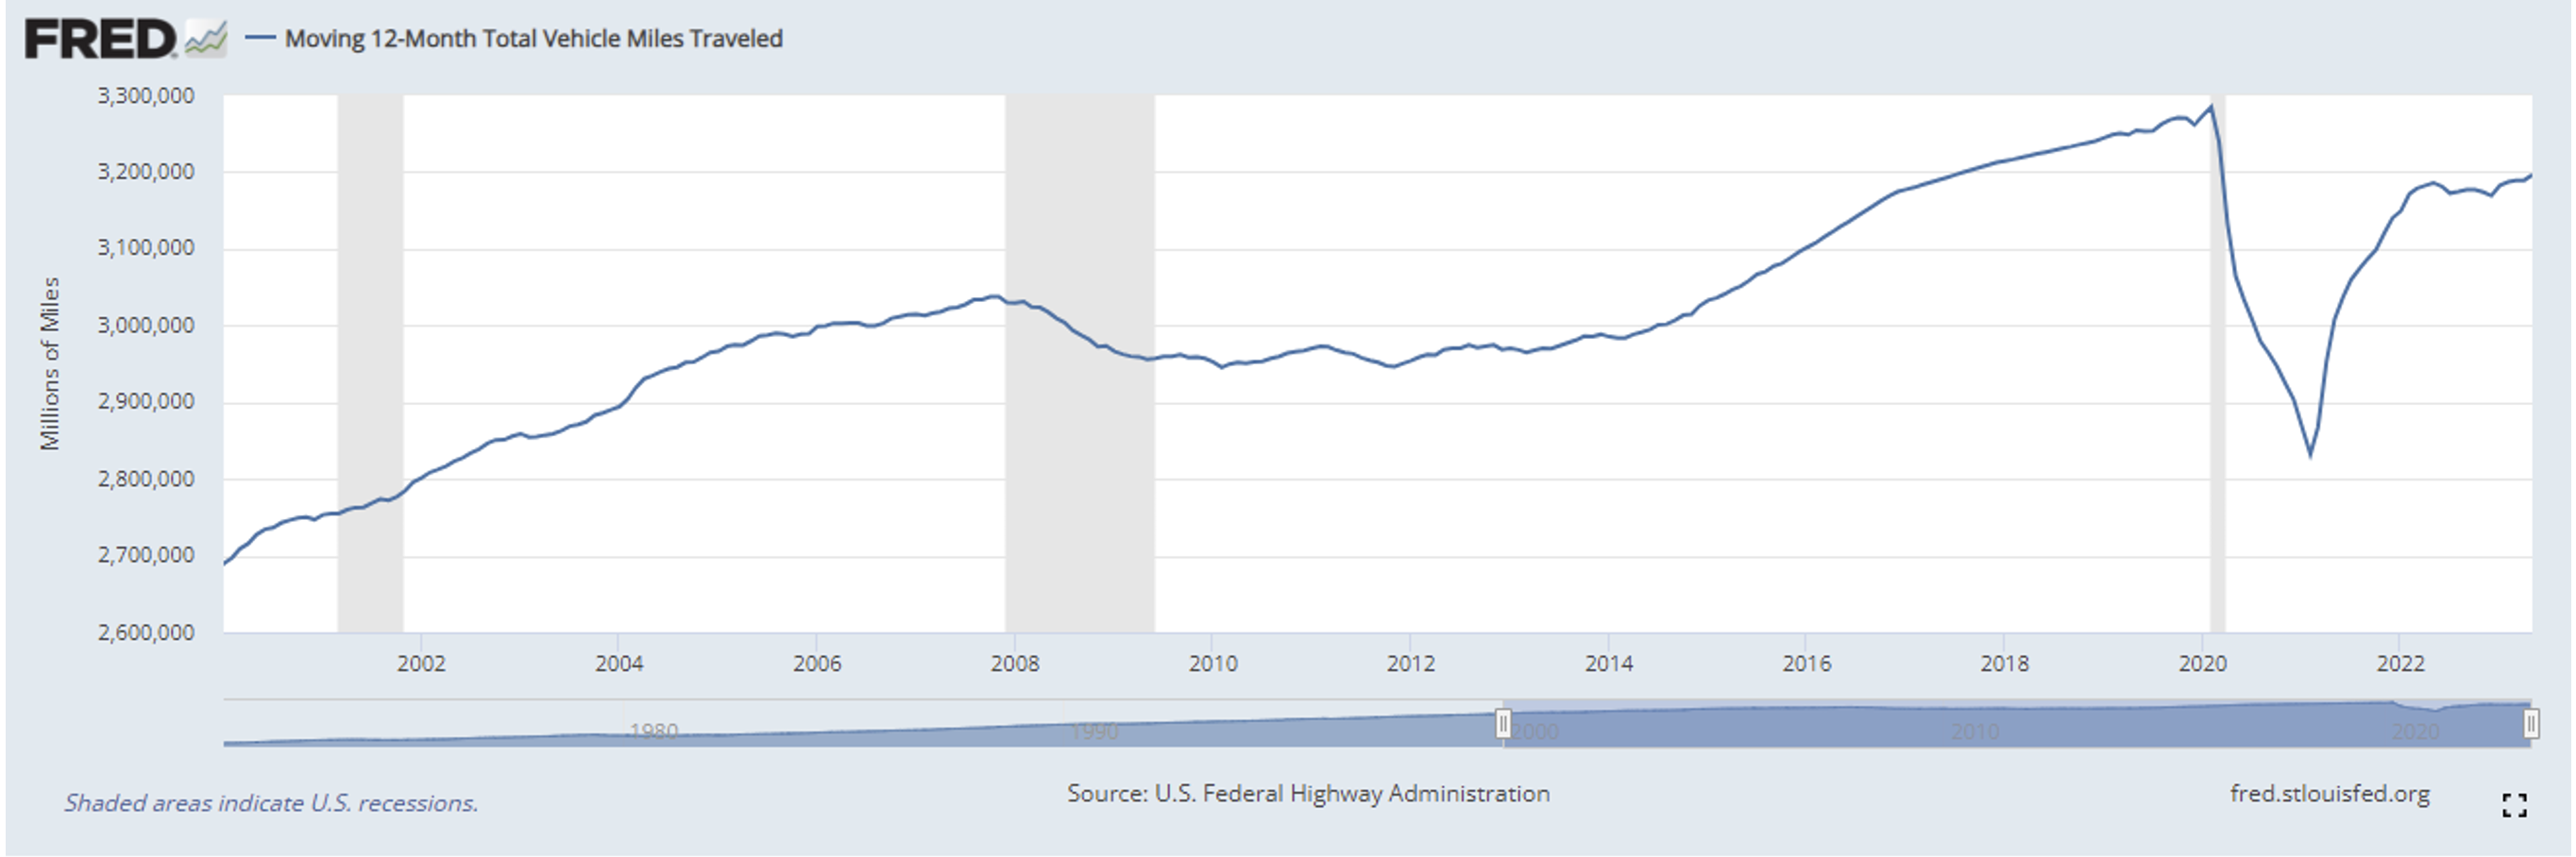
Another key indicator that portrays the health of the automotive industry is the number of miles driven or vehicle miles traveled ("VMT"). As with the number of vehicles in service, the number of miles driven contributes to the fixed operations of an auto dealer, as vehicles will require more parts and service when they are driven more frequently or for longer distances. Increased miles will also lead to the eventual purchase of a new vehicle from either new or used vehicle inventory. VMT has been tracked since 1971, and a graphical view of the rolling 12-month average from 2000 through current can be seen below.
Click here to expand the image above
Over time, VMT has generally increased as the population has grown and more vehicles have been serviced. Since 1971, there have only been a few occasions where the rolling-12 month average has declined, which, as you’ll note, tend to correlate with recessions: 1974, brief periods in the late 1970s and the early 1980s, the Great Recession in 2008 and 2009, and the pandemic in 2020. During the height of the pandemic, the rolling-12-month VMT average dropped below 3 trillion miles for the first time since mid-2014 and below 2.8 trillion for the first time since the early 2000s. The rolling-12-month average bottomed out in February 2021 at approximately 2.77 trillion miles but steadily climbed back to 3.23 trillion miles in March 2022, indicating almost a full recovery to the high-water mark of 3.28 trillion miles in February 2020.
So how has the rolling-12-month average fared in the first half of 2023? Vehicle miles traveled have actually remained fairly flat since May 2022, with a slight decline in the winter months of 2022. Perhaps this indicates the impacts following the great resignation and the increased number of workers working remotely full-time or part-time. Those workers have many fewer commuting miles than before the pandemic.
An auto dealership's service and parts department usually performs somewhat counter-cyclically to other departments during economic downturns and recessions. When consumers face pricing pressures, higher interest rates, and economic uncertainty, they often choose to hold on to their vehicles for a longer time—forcing the need for increased service work. Auto dealers would be wise to focus on the service and parts department if new and used vehicle sale profits are normalizing, as the service and parts department has historically performed as one of the highest profit centers in the overall dealership.
Conclusion
The first half of 2023 marked another very successful period for auto dealers. Most metrics have peaked off record highs and continued to decline or cool slightly. While this could appear as a doom and gloom prediction following the record years experienced by most auto dealers in 2021 and 2022, it’s all a matter of perspective. Despite cooling metrics in 2023, most key indicators are still well above pre-pandemic levels and, in most cases, in the magnitude of 1.5x-2.5x 2019 figures.
For an understanding of how your dealership is performing, along with an indication of what your dealership is worth, contact a professional at Mercer Capital to perform a valuation or analysis.