
We’ve all been on an airline flight nearing the destination when the captain comes on the intercom and informs us that we are about to start our final descent, finish our beverages, and return our tray tables to the upright and locked position. Instinctively, we know this announcement signals that we have been cleared for landing and will be landing soon.
As I reviewed the key automotive statistics this week in preparation for writing this blog, I couldn’t help but think, has the auto industry been cleared for landing after a three-year flight filled with periods of turbulence and smooth air?
In this post, we discuss several key metrics we have tracked in this space over the last several years: new vehicle profitability, the supply of new vehicles, average trade-in equity values of used vehicles, fleet sales, and vehicle miles traveled.
New Vehicle Profitability
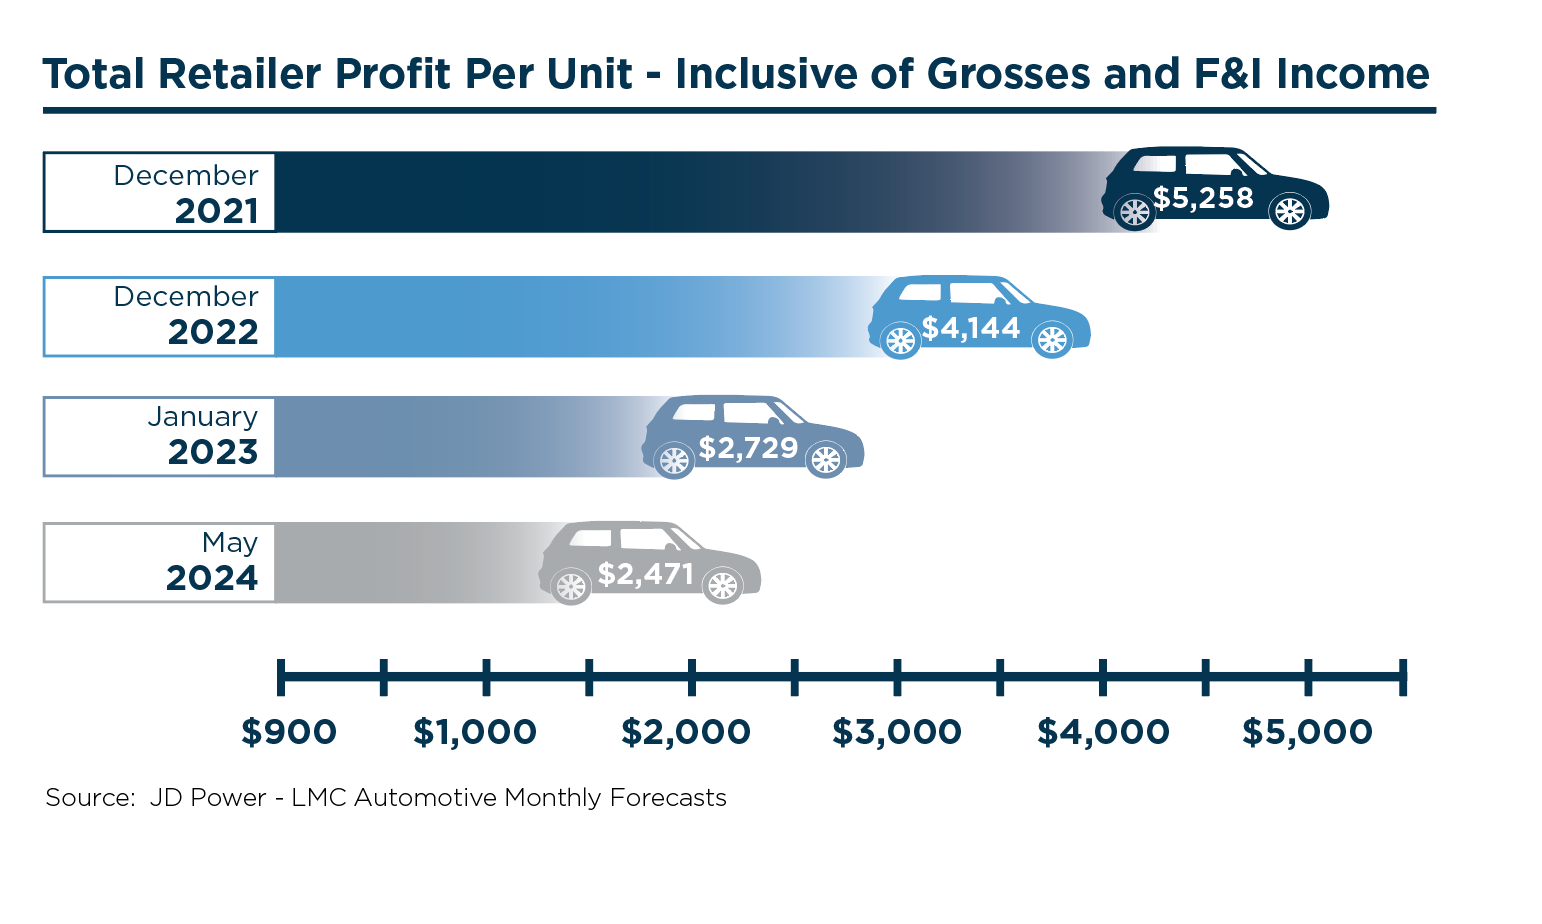
Total retailer profit per unit realized by auto dealers has continued to decline and normalize since an industry peak of $5,258 per unit in December 2021. But has this metric peaked?
The chart below, created with elements provided by the JD Power and LMC Automotive forecast, illustrates that the current profit per new unit retailed is $2,471, compared to the pre-Covid figure of $2,053.
The current figure has declined by 53% but still remains 20% higher than the pre-covid figure. Will this metric settle in at the current rates, or will it continue declining for a few more months before finally settling into the new or old normal?
 For context, JD Power reports that only 14.9% of new vehicles sold above MSRP in May 2024, compared to 50% of new vehicles selling above MSRP this time last June. If these trends continue along with increased incentives from manufacturers, average transaction prices for new vehicles will also continue to decline. Currently, the average transaction price for a new vehicle stands at $45,033, down $1,045 or 2.3% from May 2023.
Supply of New Vehicles
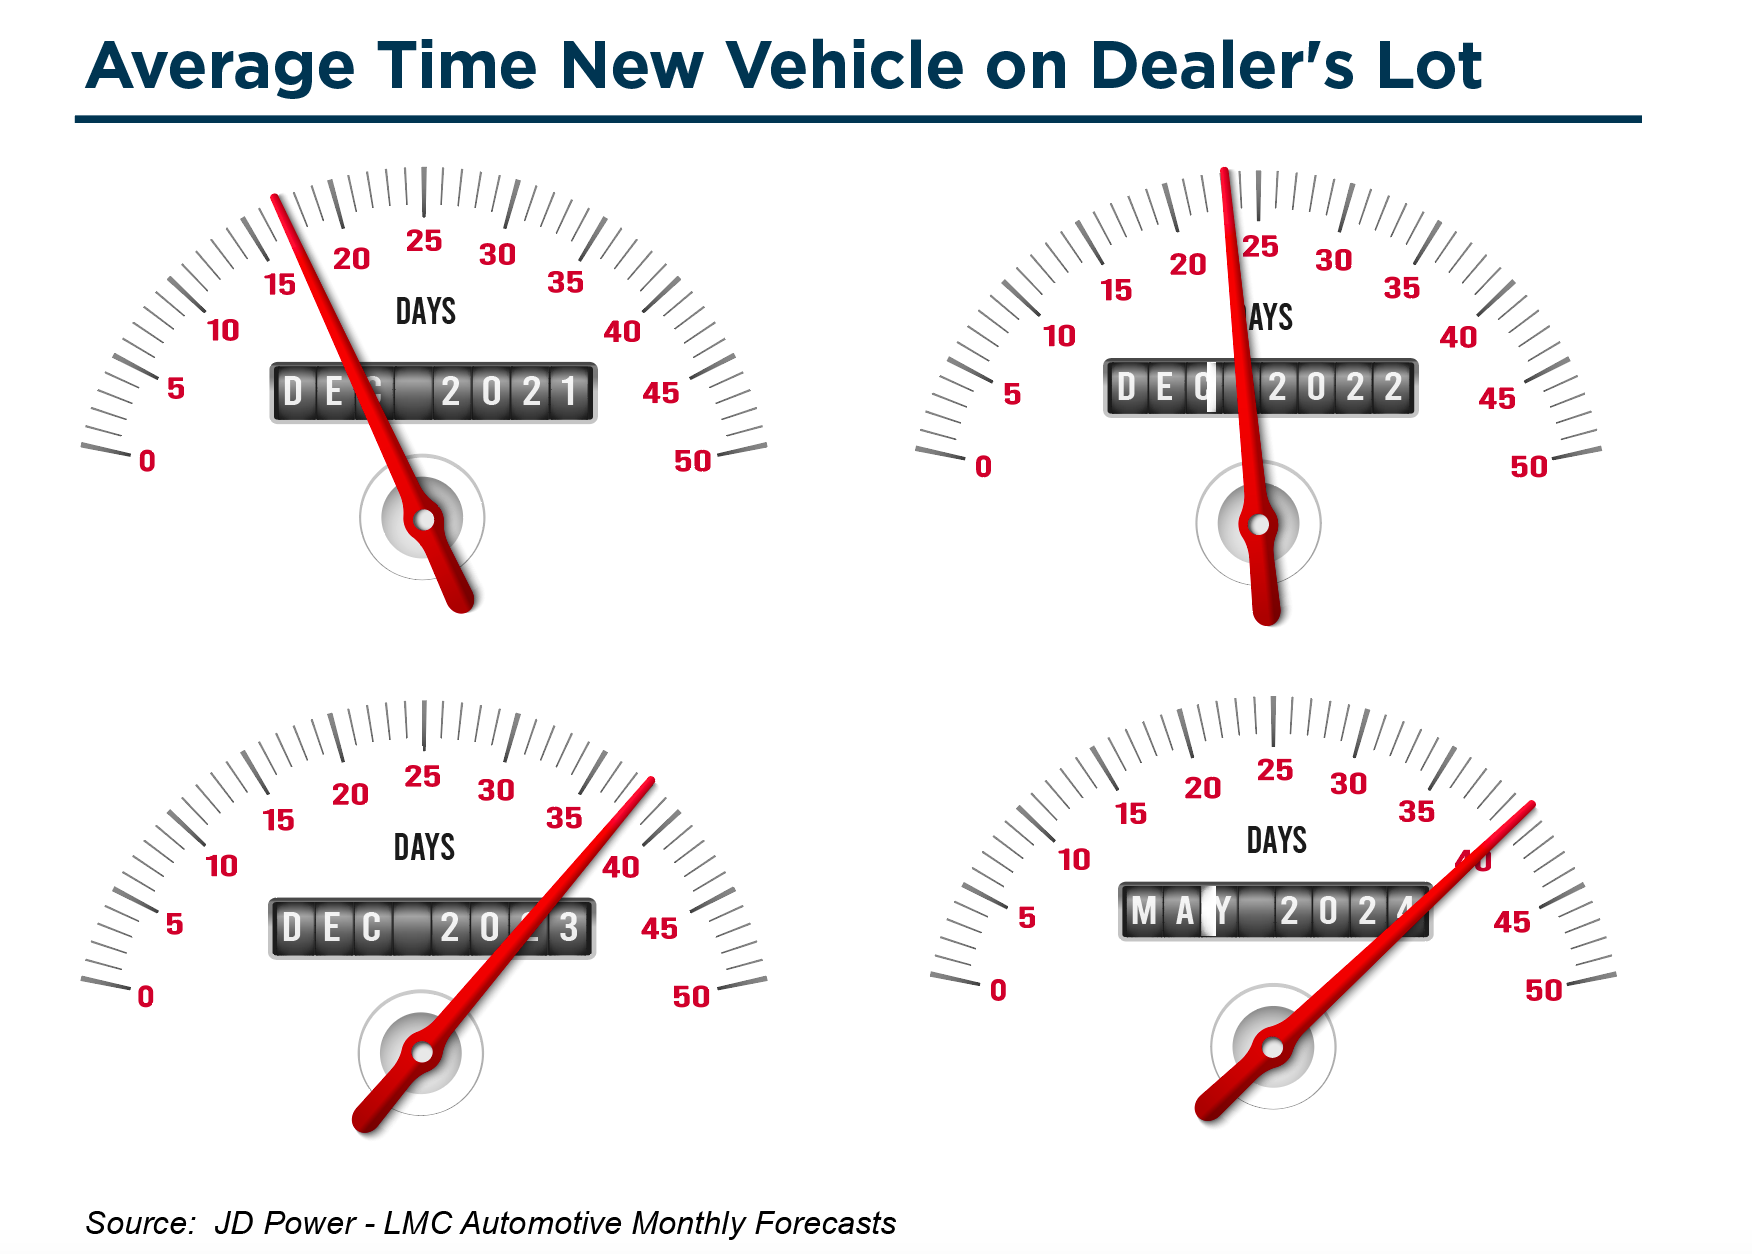
For the last couple of years, evidence of a tight supply of new vehicles could be seen in the lack of inventory on auto dealer lots across the country. We’ve written about average days’ supply for both new and used vehicles in this space on numerous occasions. We’ve also viewed this trend from a similar metric measuring the average time in days that a new vehicle sits on a dealer’s lot before it is purchased.
The monthly forecasts provided by JD Power/LMC Automotive report these figures as 38 days and 40 days as of December 2023 and May 2024, respectively. Both figures indicate a steady climb over the year-end low of 17 days in December 2021. Fortunately, this figure is still well below pre-pandemic levels of 71 and 72 days in December 2018 and 2019.
 Within these average day figures, dealers are pre-selling smaller portions of their vehicle allocations. JD Power indicates that 33% of new vehicles are selling within ten days of arriving on a dealer’s lot. For context, this percentage is down from 58% of new vehicles sold within the first ten days on the lot in March 2022. The 40-day mark is up 38% from this time last year when new automobiles were averaging just 29 days on dealers’ lots.
Average Trade-in Equity Used Vehicles
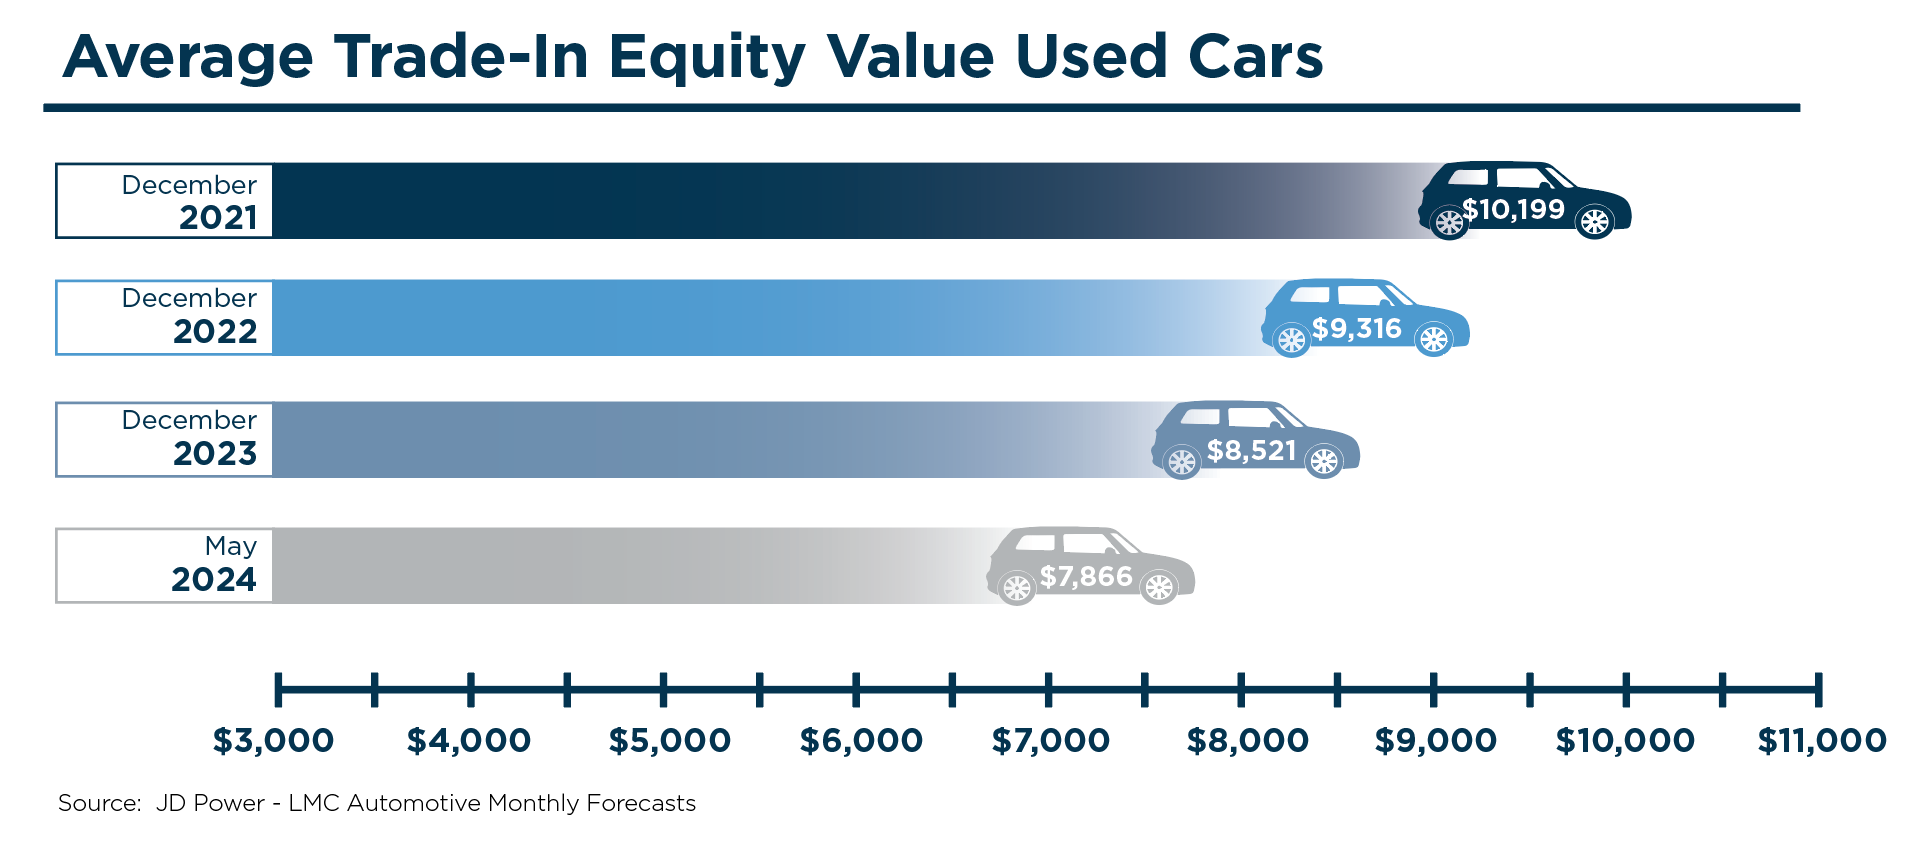
Like new vehicles, used vehicle transaction prices have also cooled in recent months compared to soaring prices in 2022. Since fewer new vehicle units have been available to sell over the last few years, fewer used vehicles have been traded into the dealer for reselling. Increased demand for used vehicles led the average trade-in equity value for used cars to climb during the same period. As we discussed, the average trade-in equity value for used vehicles has normalized in the last 18 months.
According to the monthly forecasts from JD Power/LMC Automotive, the average trade-in equity value totaled $7,866 for May 2024 compared to $8,521 and $9,316 in December 2023 and December 2022, respectively.
 With interest rates remaining at elevated levels, consumers tend to focus more on their monthly payments. Despite the cooling average used vehicle transaction prices, we anticipate many consumers will choose to hold on to their vehicles longer during this time.
Fleet Sales
Fleet sales consist of sales to large rental car companies, commercial users, and government agencies. Historically, fleet sales allowed auto dealers to sell surplus inventory and larger blocks of units at a time.
While fleet sales typically occur at reduced margins compared to retail sales, they allow auto dealers to put more vehicles in service. This benefits the auto dealer’s fixed operations as those vehicles will eventually require service maintenance and parts. It also frees up capital for dealers to redeploy into inventory that will either sell at higher margins or turnover more quickly.
Auto dealers anticipate that buyers of new vehicles will continue to return to the same dealership for those services during the lifetime of the warranty period and hopefully beyond.
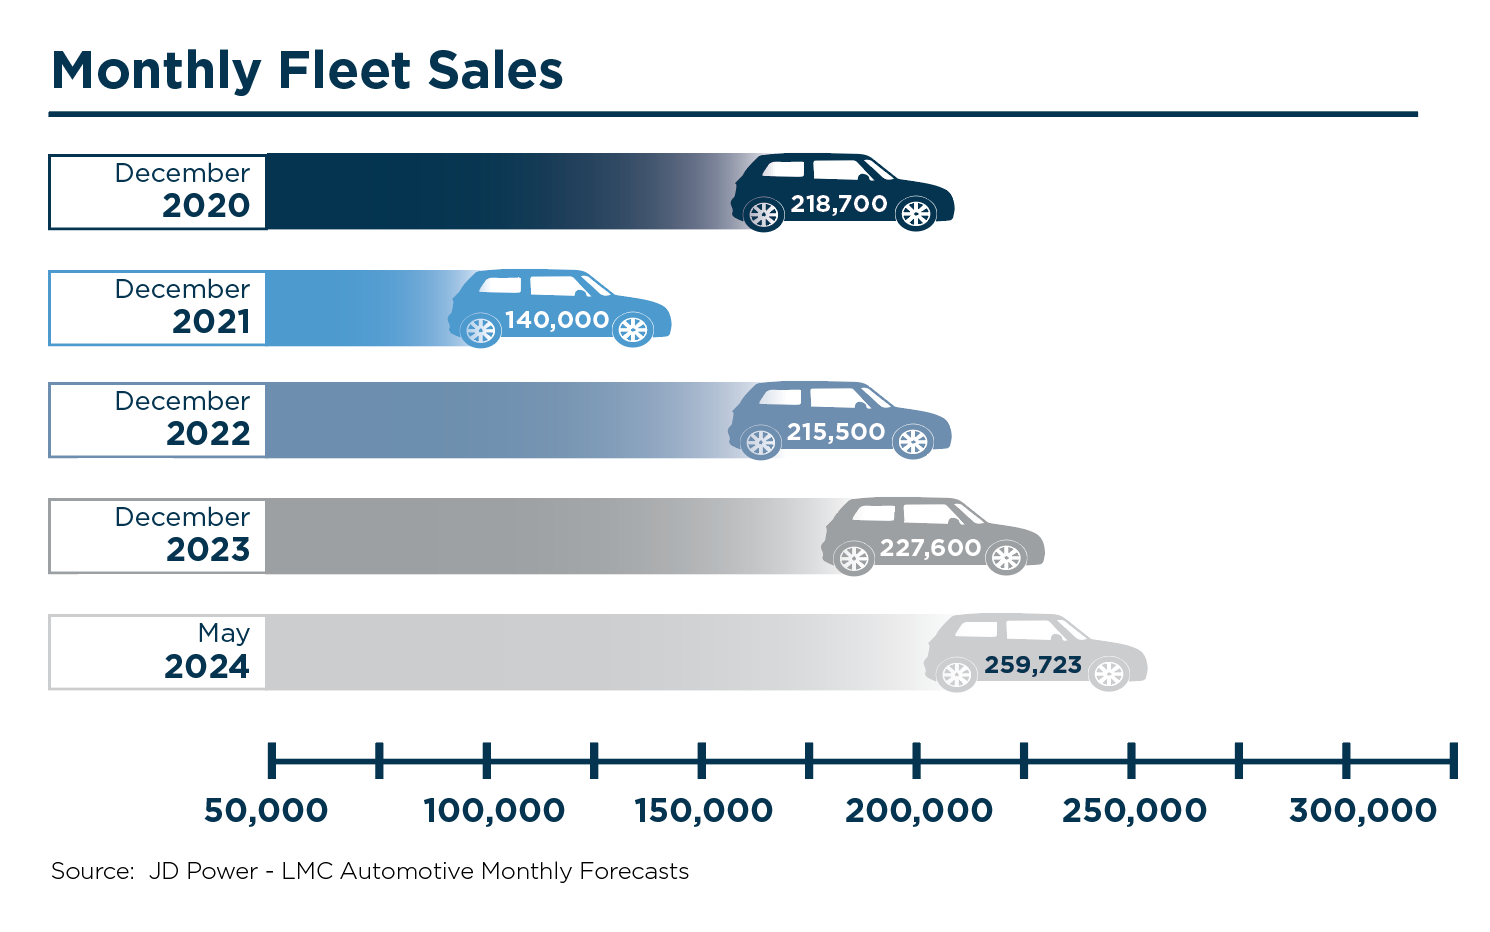
During the height of the pandemic, fleet sales declined significantly. Rental car companies weren’t just canceling orders; they actively sold off their existing fleet to build up cash as cities endured temporary shutdowns and domestic travel was halted or significantly curbed. With travel returning and inventory supply improving, fleet sales are also steadily increasing.
As seen in the graphic below, monthly fleet sales for May 2024 are estimated to be 259,200 units, a very comparable figure to amounts sold in December 2019 measured in the graph below:
Vehicle Miles Traveled
Another key indicator that portrays the health of the automotive industry is the number of miles driven or vehicle miles traveled (“VMT”).
As with the number of vehicles in service, the number of miles driven contributes to the fixed operations of an auto dealer, as vehicles will require more parts and service when they are driven more frequently or for longer distances. Increased miles will also lead to the eventual purchase of a new vehicle from either new or used vehicle inventory.
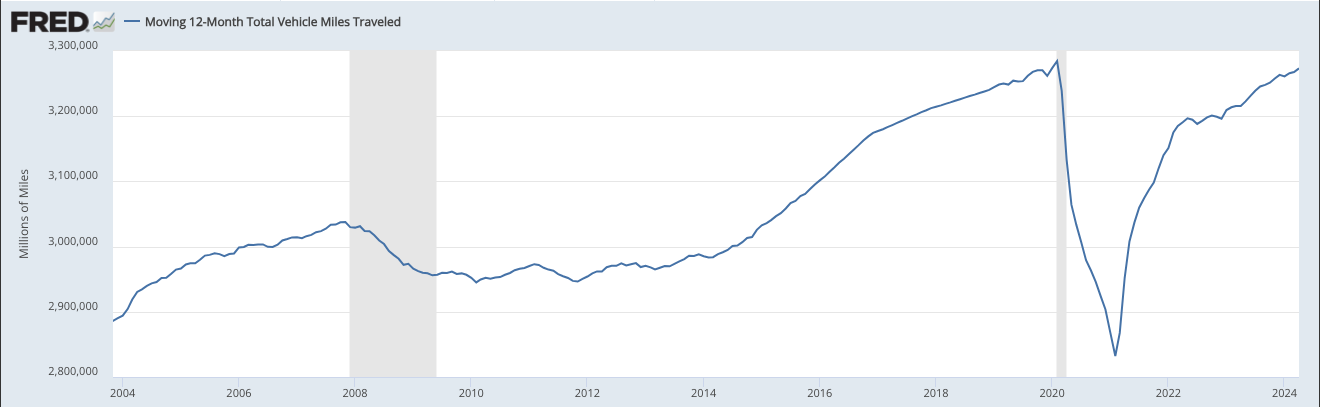
VMT has been tracked since 1971, and a graphical view of the rolling 12-month average from 2002 through the present can be seen below.
Click here to expand the image above
Over time, VMT has generally increased as the population has grown and more vehicles have been serviced.
Since 1971, there have only been a few occasions where the rolling-12 month average has declined, which, as you’ll note, tend to correlate with recessions: 1974, brief periods in the late 1970s and the early 1980s, the Great Recession in 2008 and 2009, and the pandemic in 2020. During the height of the pandemic, the rolling-12-month VMT average dropped below 3 trillion miles for the first time since mid-2014 and below 2.8 trillion for the first time since the early 2000s. The rolling-12-month average bottomed out in February 2021 at approximately 2.77 trillion miles but steadily climbed back to 3.26 trillion miles in December 2023, indicating almost a full recovery to the high-water mark of 3.28 trillion miles in February 2020.
So how has the rolling-12-month average fared in the first half of 2024? Vehicle miles traveled have actually remained fairly flat, with a slight increase from year-end. The current figure of 3.27 trillion is almost completely back to pre-pandemic levels.
An auto dealership's service and parts department usually performs counter-cyclically to other departments during economic downturns and recessions. When consumers face pricing pressures, higher interest rates, and economic uncertainty, they often choose to hold on to their vehicles for a longer time—forcing the need for increased service work.
Auto dealers would be wise to focus on the service and parts department if new and used vehicle sale profits are normalizing, as the service and parts department has historically performed as one of the highest profit centers in the overall dealership.
Conclusion
Based on our review of key metrics, is it time for the auto industry to fasten its seatbelt, put the tray tables up, and begin descent for a safe, soft landing? Or has the flight tower alerted the pilots to circle the airport before clearance for the final landing? It will be interesting to see where these metrics settle in the next few months — whether it’s a new normal or a return to the old normal.
For an understanding of how your dealership is performing and an indication of what your dealership is worth, contact a professional at Mercer Capital to conduct a valuation or analysis.