Public Auto Dealer Profiles: Asbury Automotive Group


As discussed in previous installments of this blog series, six primary publicly traded auto dealers own over 1,300 new vehicle franchised dealerships as of year-end 2022. In other words, that’s less than 10% of the total number of dealerships in the U.S. (approx. 16,750 as of NADA’s mid-year 2022 report). The proportion of total U.S. dealerships that these publics own has increased, though it still demonstrates how fragmented the industry continues to be.
Dealership M&A is almost exclusively all-cash asset sales. Sellers are less (or not at all) concerned about how their dealerships, or the buyers’ other dealerships, perform after the transaction.
Unlike other industries, such as banking, where part of the purchase price paid to sellers is the buyers’ stock, auto dealers are likely less concerned about performing due diligence on the buyer. For those interested or being offered stock as part of a transaction, you might find this article by colleague Jeff Davis helpful: “When a Buyer Offers You Stock.”
Our goal is to provide a reference point for private dealers who may be less familiar with the public players
Our goal in highlighting Public Profiles is to serve as a reference point for private dealers who may be less familiar with the public players, particularly if they don’t operate in the same market. Larger dealers may benefit from benchmarking to public players. Smaller or single-point franchises may find better peers in the average information formerly reported by NADA or more regional 20 Group reports but might still find value in staying plugged into public auto dealers’ performance.
We talk a lot about the differences between most privately held and publicly traded auto dealers. Scale, diversification, and access to capital make the business models different, even if store and unit-level economics remain similar. Public auto dealers provide insight into how the market prices their earnings, the environment for M&A, and trends in the industry.
Asbury Automotive Overview
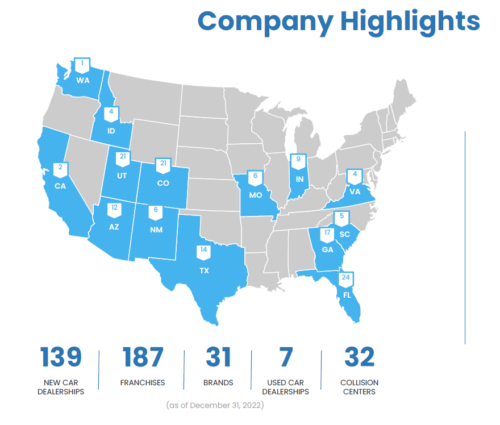
Asbury is the second smallest of the six publicly traded automotive retailers in the United States (behind Sonic). As of December 31, 2022, the company owned 186 new vehicle franchises at 139 stores located in the United States. The company owned and operated seven used car dealerships and 32 collision centers at year-end. In recent years, the company has grown considerably by acquisition, notably:
- December 2021: Acquired Larry H. Miller Dealerships (“LHM”) and TCA, consisting of 54 new vehicle dealerships, seven used car stores, and 11 collision centers
- August 2020: Acquired Park Place, consisting of 12 franchises and two collision centers
Locations
Asbury’s stores are fairly spread out across 14 states due to their various acquisitions in different markets, though there is a concentration in the southwest and southeast. The company has nine or more dealerships in Florida, Colorado, Utah, Georgia, Texas, Arizona, and Indiana. A map of all operational states and amount of dealerships is included below:
Brands
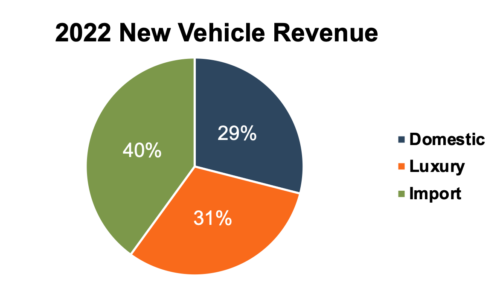
The company sells 31 new vehicle brands, with only Toyota (17%) and Stellantis (15%) making up more than 10% of new vehicle revenue in 2022. Other key brands include Lexus (9%), Mercedes-Benz (8%), Honda (9%), and Ford (9%). The company is seemingly brand agnostic, which makes sense given its massive scale and complications with franchise agreements, where OEMs don’t want too many dealerships to be controlled by one company. A breakdown of income by brand from Asbury’s Q4 2022 investor presentation can be seen below:
Dealership Groups
Another unique aspect of Asbury’s operations is that the company reports its new vehicle franchise retail network as having 15 locally branded dealership groups. Details are provided in the table below:
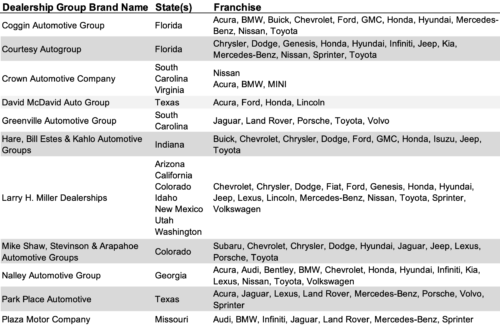
Click here to expand the image above
While retaining local branding post-acquisition is not necessarily abnormal, even if only for a limited time, Asbury is the only publicly traded retailer that holds onto its local branded dealership groups. Lithia mentions its acquisitions by dealer group and date of acquisition, but limited information is provided beyond this, and they appear more integrated from a branding perspective.
Perusing the websites of these groups, Asbury is only a footnote on their site pages, if noticeable at all. However, what ties these various dealer groups together is one of the key pillars of Asbury’s pitch to investors: Clicklane.
Asbury’s 2025 Plan
Asbury’s Q4 2022 Investor Deck calls out two fundamental principles to drive shareholder value: operational excellence and capital deployment. In plain terms, Asbury plans to make more significant acquisitions while continuing to integrate its technological investments (Click Lane and Total Care Auto) into current and future dealerships. The company’s 2025 plan has revenue increasing from $14.8B proforma in 2022 to approximately $32B by 2025.
Asbury plans to make more significant acquisitions while continuing to integrate its technological investments
Operational Excellence: Clicklane and Total Care Auto
Clicklane is the fully online transactional tool through which the company sold 27,500 vehicles in 2022. By 2025, Clicklane is forecasted to add $7 billion in revenue, including new and to-be-acquired dealerships. Many other public auto dealers have built out similar online selling capabilities. As dealers need to get larger to survive in the industry, these significant investments in online options are the main talking point when industry insiders discuss future consolidation.
The key company metrics highlighted to investors include volume, percentage of vehicles retailed, front-end GPUs, lender approval percentage, average time to complete transactions, and average delivery distance. It will be interesting to measure how the company performs in these areas over time and which metrics become more and less important. It’s unlikely that the metrics mentioned in the investor deck tell the whole story of the economics behind online retailing, which is still in its relative infancy.
Total Care Auto (“TCA”) is a stand-alone insurance company integrated into Asbury’s dealership, which is anticipated to improve F&I profits and hopefully improve customer retention. This was acquired as part of the LHM acquisition and is being integrated into Asbury’s other current and future locations.
Acquisitions
In 2022, the company divested $583M in annualized revenue, not including planned divestitures stemming from the LHM deal closed in late December 2021. We don’t recall the last time an auto dealer net-divested of dealerships in a full calendar year, and we believe this is an extreme example of how framework agreements can impact large auto groups seeking to balance out their mix of brands and markets. The executives of these companies can effectively operate as portfolio managers in this regard.
Asbury estimates $6.9 billion in revenue will be acquired in the next three years
According to the company’s investor deck, the company plans to reverse course by acquiring a significant amount of its revenue target by 2025. Asbury touts its “robust pipeline of strategically aligned acquisitions” and estimates $6.9 billion in revenue will be acquired in the next three years. This also represents the addition of at least 61 stores, as the company indicates that as of the beginning of 2023, its 139 stores will grow to greater than 200 in the next three years.
Back of the napkin math indicates they’re penciling in stronger than average revenue per store, and/or more than 60 stores will be acquired. It indicated that this revenue is not positively impacted by integrating Clicklane and also doesn’t include same-store sales growth, which they forecast at 6.9% annually through 2025, primarily driven by SAAR returning to ~17 million.
Implied Blue Sky Multiple
We’ve discussed how Blue Sky multiples reported by Haig Partners and Kerrigan Advisors represent one way to consider the market for private dealerships. Below, we quantify the implied Blue Sky multiple investors place on Asbury.
Asbury’s 3-year average Blue Sky multiple is 6.5x
Assuming that the difference between stock price and tangible book value per share is made up exclusively of franchise rights, their Blue Sky value per share is approximately $109.55. Given recent outperformance, Haig Partners prescribes a 3-year average to determine ongoing pre-tax income. However, this is troublesome for Asbury, given significant acquisitions and divestitures. Its 3-year average Blue Sky multiple is 6.5x, while its reported 2022 Blue Sky multiple is 4.1x.
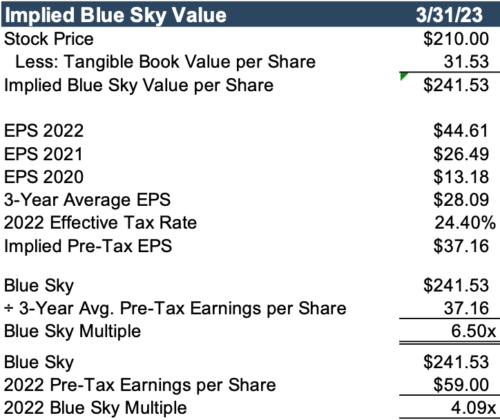
Because of recent, large acquisitions, Asbury’s tangible book value per share is -$31.53, by far the lowest of the six publics. Its earnings have also materially increased due to its scale, so attempting to smooth out the recent sector outperformance becomes much more nuanced than a simple average.
For reference, the company’s forward P/E multiple is about middle of the pack.
Conclusion
At Mercer Capital, we follow the auto industry closely in order to stay current with trends in the marketplace. Surveying the operating performance, strategic investment initiatives, and market pricing of the public new vehicle retailers gives us insight into the market that may exist for a private dealership.
To understand how the above themes may or may not impact your business, contact a professional at Mercer Capital to discuss your needs in confidence.