
As discussed in previous installments of this series, six primary publicly traded auto dealers own 1,342 new vehicle franchised dealerships as of year-end 2023. The most recent number of dealerships, 16,839, as reported by NADA, means the publics own only about 8% of the total number of dealerships in the U.S. The proportion of total U.S. dealerships that these publics own has increased, though it still demonstrates how fragmented the industry continues to be.
Our goal in highlighting public profiles is to serve as a reference point for private dealers who may be less familiar with the public players, particularly if they don’t operate in the same market. Larger dealers may benefit from benchmarking to public players. Smaller or single-point franchises may find better peers in the average information formerly reported by NADA or more regional 20 Group reports but might still find value in staying plugged into public auto dealers’ performance.
We talk a lot about the differences between most privately held and publicly traded auto dealers. Scale, diversification, and access to capital make the business models different, even if store and unit-level economics remain similar. Public auto dealers provide insight into how the market prices their earnings, the environment for M&A, and trends in the industry.
Group 1 Automotive Overview
Group 1 Automotive, Inc. is headquartered in Houston, Texas, and is the second smallest of the country’s six publicly traded auto retailers, ahead of only Sonic Automotive. As of December 31, 2023, Group 1 had a total of 144 dealerships and 28 collision centers in the United States, as well as 55 dealerships and 13 collision centers in the United Kingdom. Group 1’s U.K. presence makes up a significant portion of its market. The company used to own 17 dealerships in Brazil, but these were divested in 2022.
Financially, Group 1 has performed well during 2023, as its new vehicle-selling operations have remained resilient, used operations outperformed the greater market, and fixed operations have shown stability.
Locations
The company’s operations spanned 17 states in the U.S. and 34 towns and cities in the United Kingdom. Notable geographic concentrations for the company include Texas (38.4% of new vehicle unit sales), Massachusetts (9.0% of new vehicle unit sales), and the U.K. (18.7% of new vehicle unit sales). The company also has various dealerships throughout the South, Southeast, and Northeast, with seven additional locations in California.
See the map below for the company’s geographic footprint by number of franchises in each region.
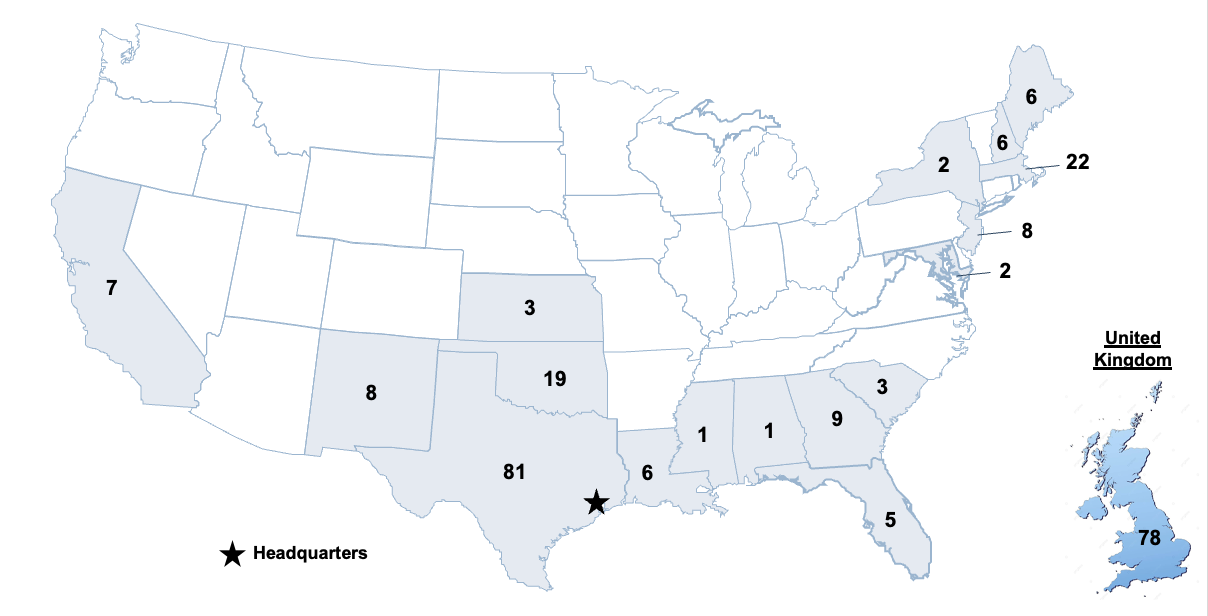 On a franchise basis, Group 1 reported a total of 267 franchises (or “flags”) at year-end 2023, which can be broken down to 189 franchises in the United States and 78 franchises in the United Kingdom. Given the total number of the company’s dealerships, the average number of flags per dealership was about 1.3 as of year-end 2023, as more than half of dealerships are single points.
Brands
Group 1 Automotive sells 35 different new vehicle brands. Comprehensive brand selection is important to Group 1, as it hopes to provide customers with a broad range of products. This is particularly important given its relatively heavy concentration in some key states. Furthermore, brand diversity reduces the risk of evolving consumer preferences. Profit amongst these brands has remained relatively stable over the company’s history. However, in recent years, the company has seen a slightly greater profit mix towards selling and servicing higher-margin luxury vehicles.
The company is seemingly brand agnostic, which makes sense given its massive scale and complications with franchise agreements, where OEMs don’t want too many dealerships to be controlled by one company. Therefore, the company’s brand mix is closely tied to the brand mix of the market as a whole.
A breakdown of revenue by segment and unit sales by brand from Group 1’s Q4 2023 investor presentation and 10-K can be seen below:
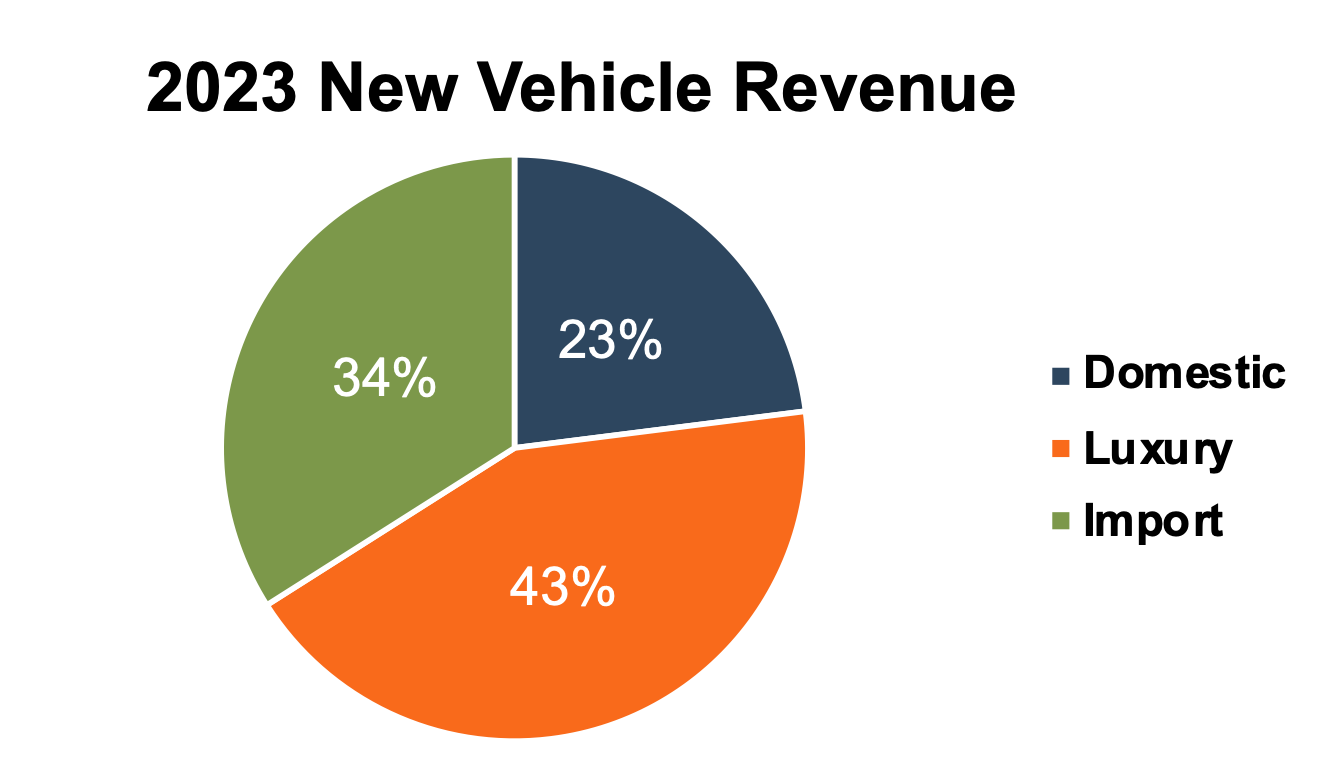
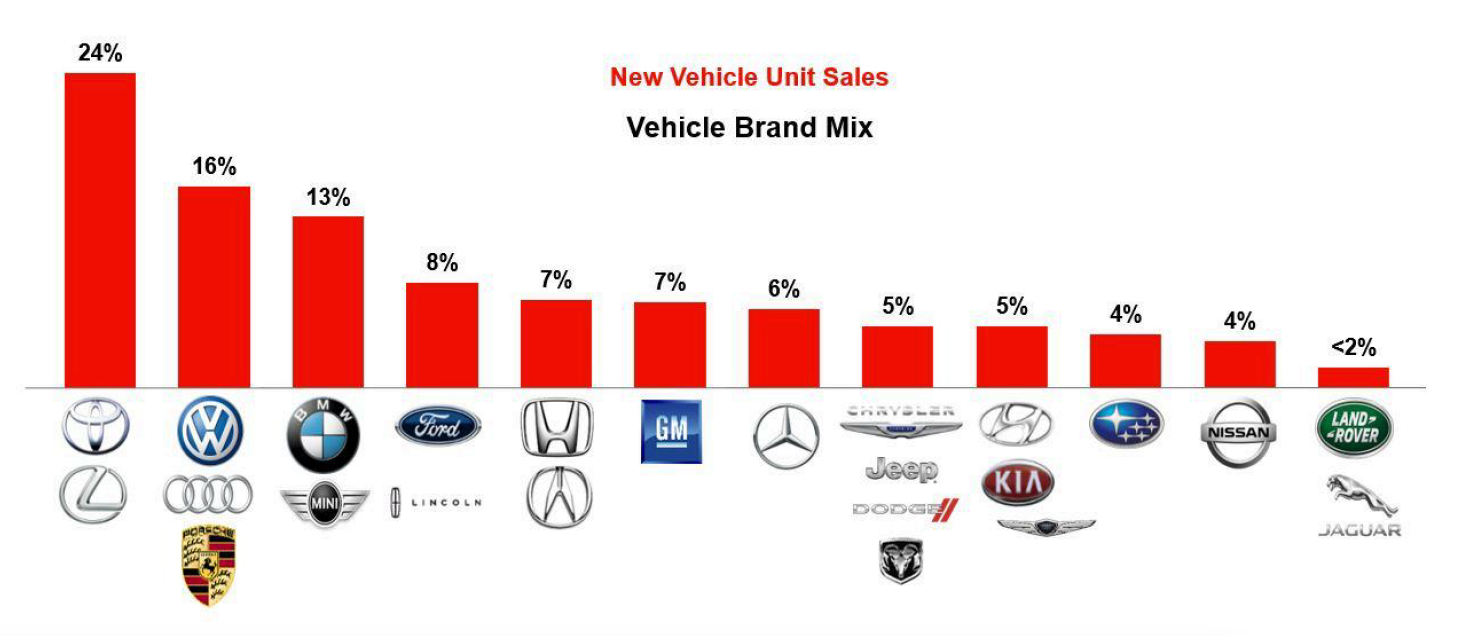 As you can see, it is difficult to slice and dice this information given the various combinations of brands in the bar chart above, which do not perfectly align with the revenue breakdown. For example, Toyota and Lexus comprise 24% of new vehicle units, but they are in different categories (import and luxury, respectively).
AcceleRide
In June 2019, Group 1 Automotive launched its online automotive purchasing platform, AcceleRide. When it was launched, the goal of AcceleRide was to provide a car buying experience that is as simple and convenient as browsing an online inventory of used vehicles, customizing vehicle options, selecting from various payment and financing options, and choosing a preference for vehicle delivery. Since 2019, AcceleRide has expanded its scope to include selling a vehicle online and scheduling service appointments online at any Group 1 dealership in the consumer’s region. However, their online platform does not have the national name recognition of competitors such as Carvana.
Acquisitions, Capital Allocation, and Dispositions During 2023
Acquisitions and Capital Allocation
According to the Group 1 investor presentation, the company acquired a total of nine franchises during 2023. The aggregate consideration paid for these franchises was $1.1 billion. Group 1 has been less aggressive in its acquisition activity over the last two years due to elevated acquisition multiples, especially when compared to Lithia and some of the other acquisition-heavy public dealers. However, its statement on M&A strategy from its 10-K supports a strategy of continued growth through acquisition going forward.
“We believe that there will continue to be opportunity for consolidation within the industry. Consistent with our acquisition activity in 2021, 2022, and 2023, we intend to pursue opportunities in growth-positioned or economically stable markets, or that are economically accretive to our existing markets in 2024 and beyond, specifically focusing on brands, large dealership operations and/or dealership clusters that will provide attractive returns to our portfolio. Acquisitions completed within our existing markets allow us to better capitalize on economies of scale and provide for cost savings opportunities.”
See below for a summary of Group 1’s capital allocation history over the last five years. This table was sourced from the company’s Q4 2023 investor presentation.
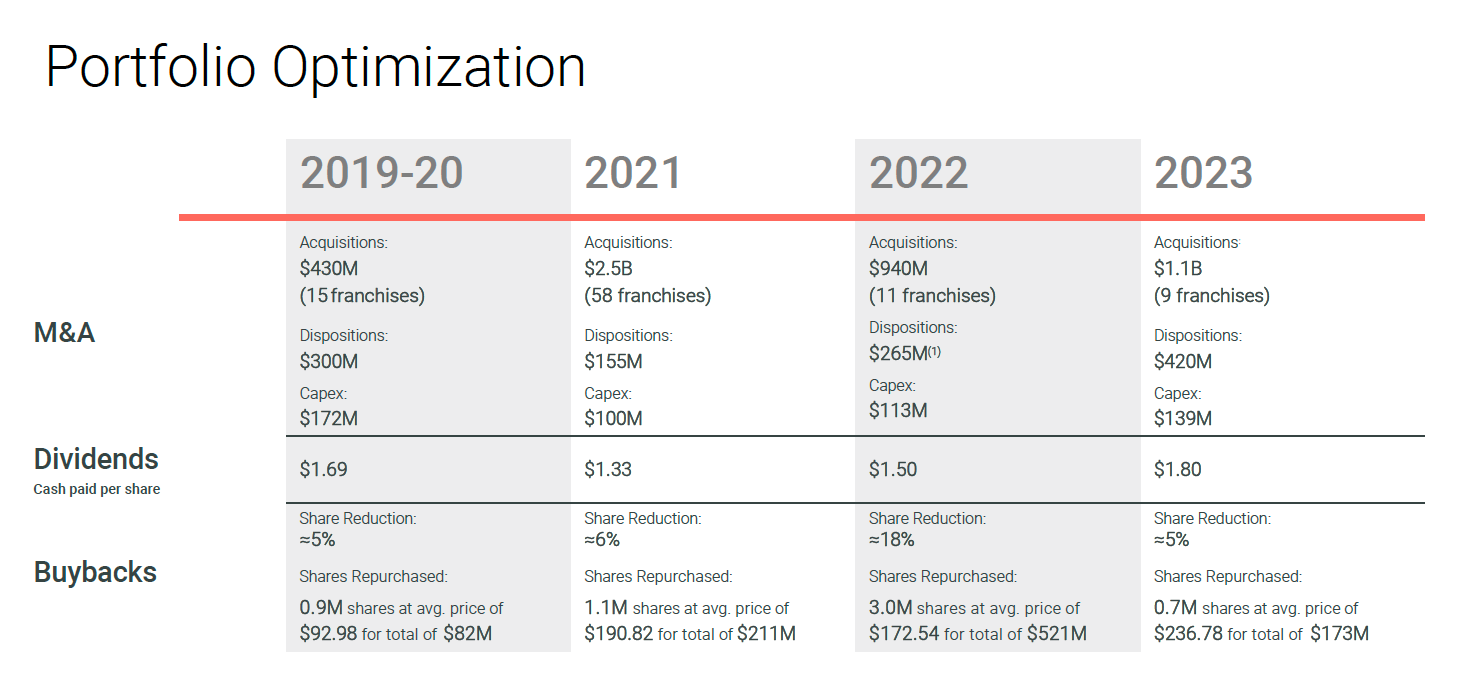
Click here to expand the image above
Dispositions
Over the last few years, the company has gone through the process of discontinuing its Brazilian operations. Management indicated that there were more attractive investment opportunities than its opportunities in Brazil when it announced the divestiture in November 2021. The disposition process has been completed except for a remaining receivable balance of $21.1 million that will likely be used to settle any remaining liabilities associated with the disposition.
Implied Blue Sky Multiple
We’ve discussed how Blue Sky multiples reported by Haig Partners and Kerrigan Advisors represent one way to consider the market for private dealerships. Below, we quantify the implied Blue Sky multiple investors place on Group 1 Automotive. Assuming that the difference between stock price and tangible book value per share is made up exclusively of franchise rights, their Blue Sky value per share was approximately $257 as of this writing.
Given recent outperformance during the last several years, Haig Partners prescribed a trailing 3-year average of pre-tax income for Blue Sky calculations. However, since then, the three-year guidance has been updated to reflect that no uniform methodology makes sense for most dealers across the country. Therefore, buyers and sellers must determine the most appropriate one, given the circumstances of each dealership and its market.
See the table below for calculations of Group 1’s Blue Sky multiples on a 3-year average basis as well as 2023 and forecast 2024.
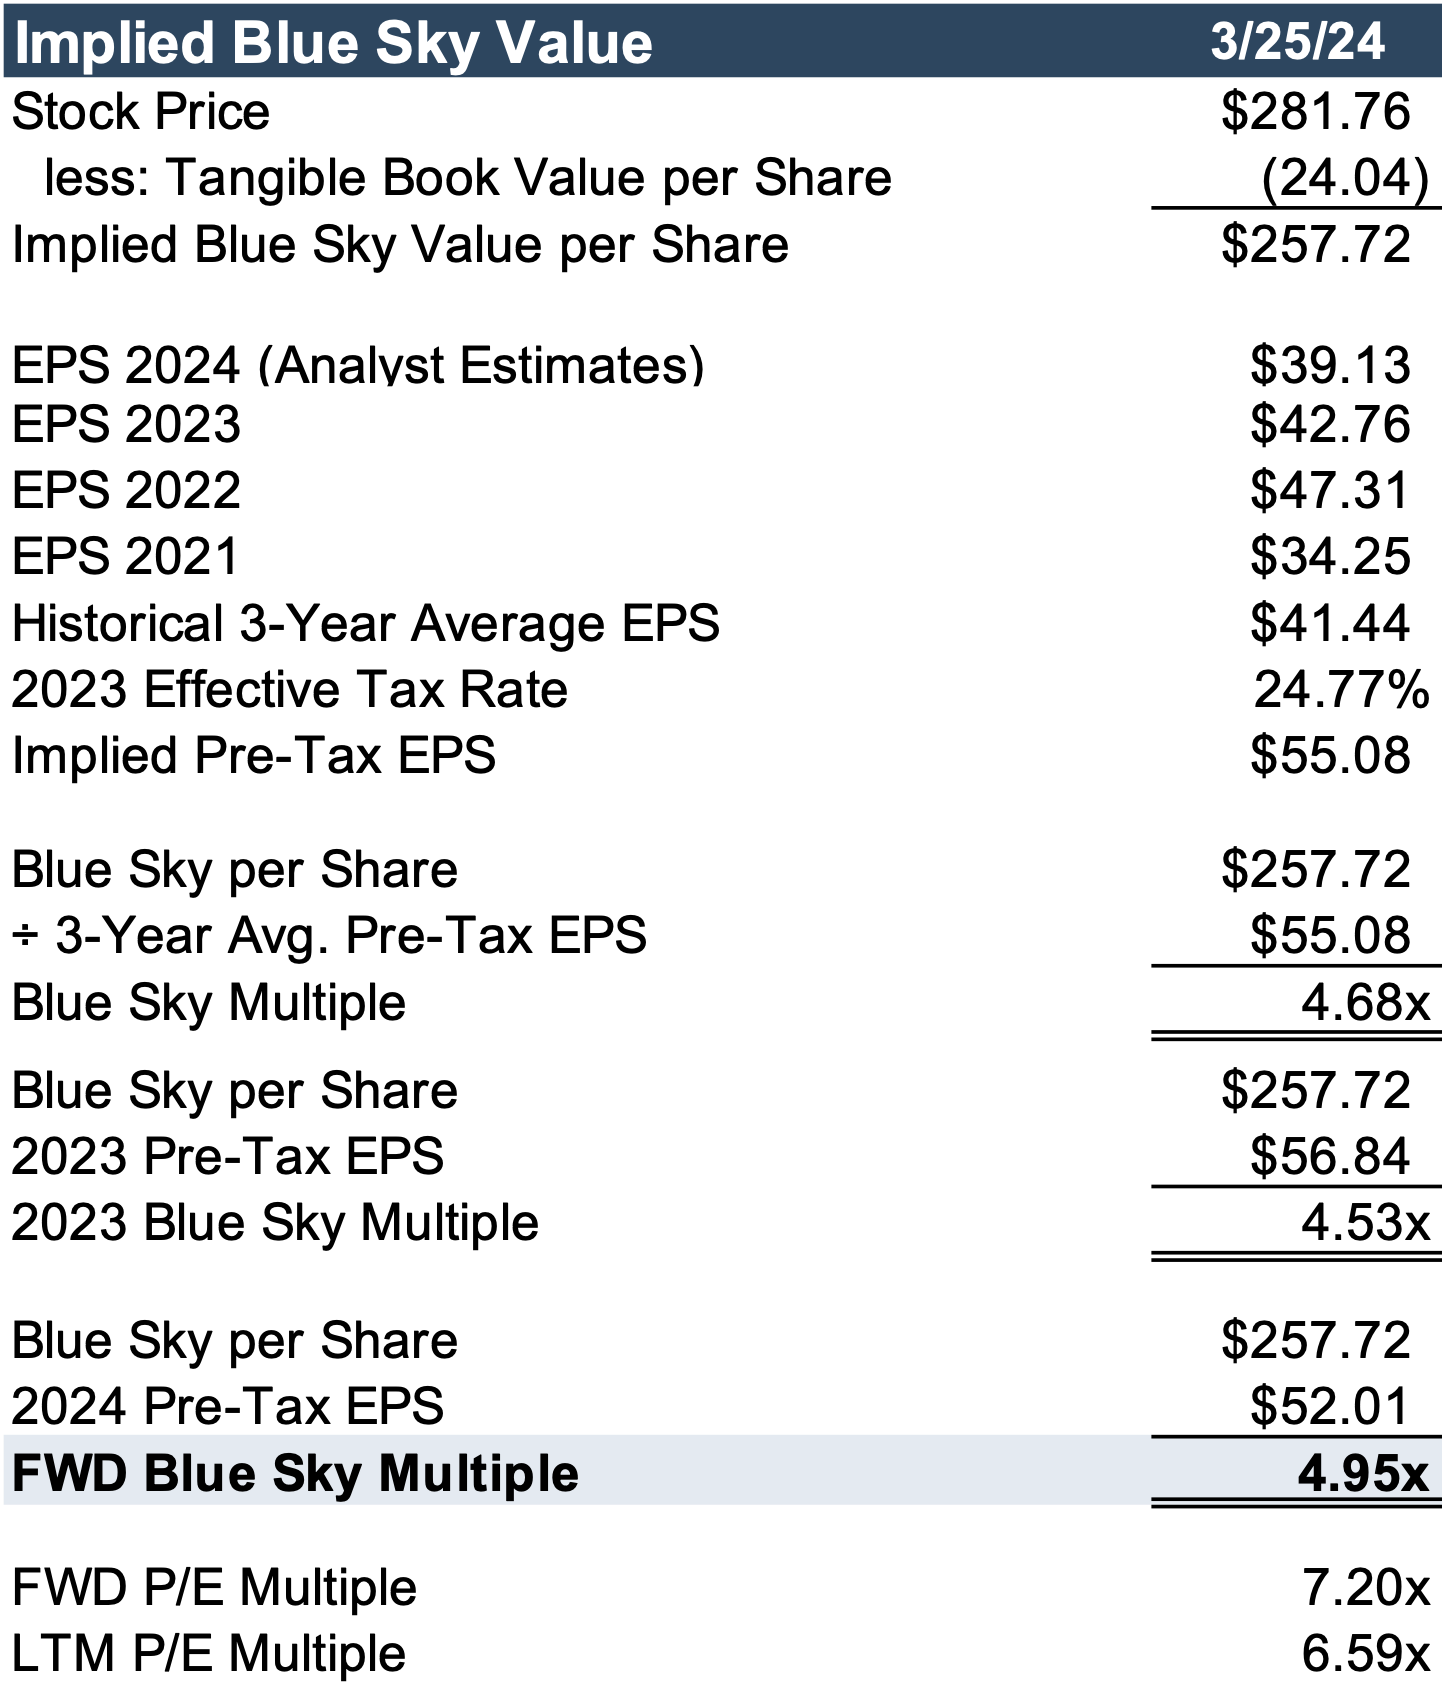 In 2023, Blue Sky multiples converged to the 3-year average multiple for all six publicly traded auto dealers, and Group 1 was no exception. Furthermore, Blue Sky multiples have also appeared to normalize after years of volatility in earnings metrics. Compared to the other dealers, Group 1’s Blue Sky multiples are comparable to Lithia and AutoNation at around 5.0x but below Sonic, Penske, and Asbury, which are closer to 6.0x – 7.0x.
See the table below for a look at Group 1’s multiples compared to the rest of the public dealers.
In 2023, Blue Sky multiples converged to the 3-year average multiple for all six publicly traded auto dealers, and Group 1 was no exception. Furthermore, Blue Sky multiples have also appeared to normalize after years of volatility in earnings metrics. Compared to the other dealers, Group 1’s Blue Sky multiples are comparable to Lithia and AutoNation at around 5.0x but below Sonic, Penske, and Asbury, which are closer to 6.0x – 7.0x.
See the table below for a look at Group 1’s multiples compared to the rest of the public dealers.

Conclusion
At Mercer Capital, we follow the auto industry closely to stay current with marketplace trends. Surveying the operating performance, strategic investment initiatives, and market pricing of the public new vehicle retailers gives us insight into the market for a private dealership.
To understand how the above themes may or may not impact your business, contact a professional at Mercer Capital to discuss your needs in confidence.