March 2020 SAAR
When Might Things Return to Normal?


The term “24-hour news cycle” doesn’t do justice to the rate at which new information becomes available and is consumed by people trying to understand the significant impact COVID-19 is having on all of us. Stay-at-home orders have created a huge demand shock, which is particularly harmful to a largely service-based economy. In this post, we contextualize some of the fallout that has been experienced and try to answer the question “when will things return to normal?”.
March SAAR
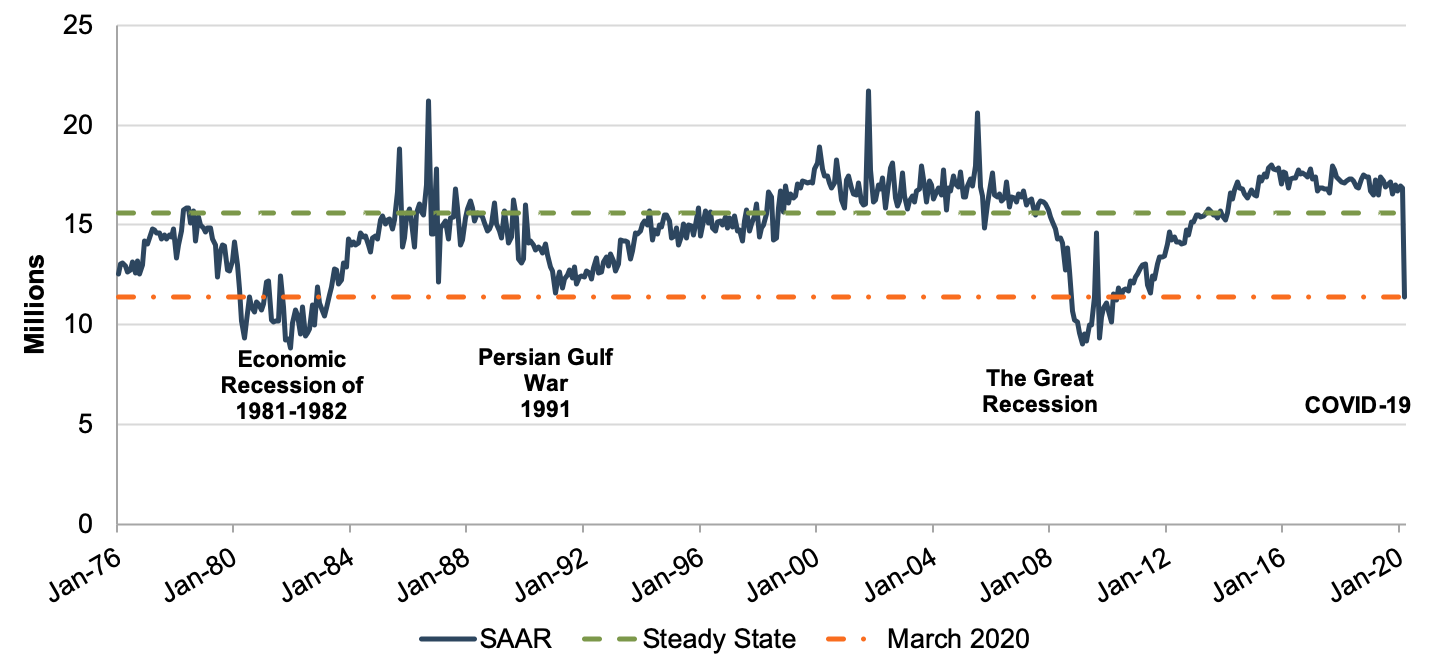
SAAR came in at 11.372 million, the lowest level since April 2010.
As expected, SAAR (a measure of Light-Weight Vehicle Sales: Autos and Light Trucks) declined considerably in March as the early effects of COVID-19 began to impact just about every industry across the globe. SAAR came in at 11.372 million, the lowest level since April 2010. This also represented a decline of 32.4% from February. The 32.4% decline was only the fourth time since 1976 (when the SAAR was first recorded) that a 30% month-over-month decline has occurred. The first two instances were during a 6-month period of extreme volatility between September 1986 and February 1987, including three monthly increases of over 22% and two declines of 31.6%. Despite these anomalies, the only other significant month-over-month decline occurred in September 2009 when SAAR declined 35.8%. However, SAAR had increased by 14.2% and 28.1% in the two preceding months, so that September’s steep decline was only 6.1% below the preceding June.
While the huge drop in volumes in March was certainly historic, it included a couple of weeks that were relatively unscathed by stay-at-home orders. April is likely to show further declines with significant uncertainty about when we will reach the bottom.
Putting it in Perspective
While there have been many sharp one-month declines in the SAAR, we note that even seasonally adjusting the data can fail to capture certain calendar anomalies, specifically when one month has an extra selling weekend. In looking at other significant events, such as the stock market crash in ’87 and 9/11, the drop caused by the market crash was relatively short-lived and auto volumes actually spiked in the month following 9/11 as the country braced for war. To better understand where we might be headed and when things might return to some level of “normal,” we analyzed prolonged declines, focusing on the 1981-1982 recession, the Persian Gulf War, and the Great Recession. Though these events do not align perfectly with COVID-19, observing how periods of economic turmoil affect the industry and examining the length of recovery time historically can provide future insight as we seek to climb out of the current crisis.
There are numerous ways to measure recovery. For purposes of this post, we measure “recovery” as how long it takes to return to a “steady state” of vehicle sales. We use a steady state figure of 15.6 million annual sales from a 2015 paper written by Austan D. Goolsbee (University of Chicago) and Alan B. Krueger (Princeton University). The paper analyzed the restructuring of General Motors and Chrysler. The inputs into the regression model used in the paper include:
- Real GDP Growth
- The unemployment rate
- Population growth
- The Federal Reserve’s Senior Loan Officers’ Survey (SLOOS) measuring willingness to lend to consumers
- Log of average real price of a gallon of gasoline (for the preceding quarter)
- Standard deviation of gas prices over the preceding four quarters
In every year since the paper was published, industry sales have surpassed 17 million, indicating the steady state may be biased upwards if rerun today. However, the data stops in 2007 just before the Great Recession, and because auto sales are procyclical, any increase in the steady state figure would likely be due in part to the longest economic expansion in the country’s history over the past 11 years. Further, since vehicle sales are positively correlated with population growth, we would expect a long-term figure to be higher than early years and lower than more recent years. Ultimately, we find a steady state figure of 15.6 million to be reasonable for this analysis.
A Long Term View of SAAR
A long-term view of SAAR is presented in the graph below:
The 1981 Recession
At the time, the 1981 recession was the worst economic downturn in the U.S. since the Great Depression. Triggered by a combination of monetary and global energy issues, unemployment reached 11%. While the effects of the recession were widespread, the manufacturing, construction, and auto industries were particularly affected. Auto manufacturers ended 1982 with 24% unemployment. The industry saw 4 straight years of year-over-year declines in sales from 1979 to 1982 with the largest annual decline in 1980 at 19%. SAAR bottomed out in October 1981 with only 9,209,000 annualized vehicle sales; from there, SAAR increased 17% in both 1983 and 1984. SAAR reached over 15.6 million sales in August 1985, approximately 7 years after it first dropped below this threshold in September 1978.
As noted previously, population growth likely indicates the 15.6 million is a high threshold for this period, particularly since SAAR was only above this for a brief period in 1978. The precipitous decline at the beginning of 1980 appears to have been restored by the end of 1983, indicating just 4 years before recovery.
The Persian Gulf War
The Persian Gulf War, precipitated by Iraq’s invasion of Kuwait, caused the oil shock of 1990. Though less severe than oil shocks that occurred in the 1970s, oil prices initially soared from a pre-invasion price of around $18 a barrel to above $40 in the late fall of 1990, leading to declining revenues for the auto industry. At the same time, the Fed was tight on interest rates, endangering an already weak economy. This combination of oil prices and economic policy brought the U.S. into a recession that hit the auto industry particularly hard. Vehicle sales declined each year from 1989 through 1991, with the biggest decrease in 1991 at 11%. It took until April 1994 for SAAR to reach 15.6 million again, about 4 years after it first began to drop.
The Great Recession
Arguably the most impactful event on the industry in recent history was the Great Recession (2007-2009). Precipitated by a financial crisis caused by a severe contraction of liquidity in global markets, businesses were forced to reduce their expenses and investments and layoffs resulted. From December 2007 to June 2009, real GDP declined by 4.3% and unemployment increased from 5% to 9.5%, peaking at 10% in October 2009.
The auto industry and other industries reliant on consumer loans (e.g., housing) suffered significant losses. In 2006 and 2007, vehicle sales volumes decreased about 2.5% consecutively, and the auto industry hourly workforce was reduced from over 90,000 to approximately 40,000. Conditions worsened through 2008 and 2009, as sales declined 18% and 21%, which is the largest year-over-year decrease of any time period. SAAR dropped to just a little over 9 million in February 2009, 6.6 million below the steady state SAAR. However, through the assistance of the government in the Troubled Asset Relief Program (TARP) and the end of the recession in 2009, the industry survived and returned to its steady state of 15.6 million vehicle sales in 2013, 5 years after it first dropped below that level in January 2008.
COVID-19
There are some positive takeaways from looking at these past events.
Although economic conditions currently point to a difficult period of uncertain length, there are some positive takeaways from looking at these past events. Periods of high growth have followed periods of low sales as consumers who delayed purchases in rough times returned to the market. SAAR increased 17% consecutively in both 1983-1984, following the 1981 recession. There were increases of 8% in both 1993 and 1994 following the Persian Gulf War. Finally, the auto industry experienced 5 years of expansion following the Great Recession, reaching similar sales as before the crisis and further set new highs in the 5 years after that.
Again, it may take a while to return to the 17 million in sales seen in the past few years, but that is above the long-term average and should not necessarily be the level from which we measure recovery. NADA expects it could take three or more years to return to this level, which would be reasonable given historical recovery times.
Conclusion
The auto dealer industry is resilient through tough times. We hope dealers are once again able to navigate both the known and unknown problems facing us today. Dealers must grapple with how to continue to pay their employees, alter their sales channels on the fly, and potentially even help teach their children at home.
Mercer Capital stands ready to partner with dealers in their time of need. Prior to the nationwide lockdowns, we were anxiously awaiting the NADC Conference in Florida at the end of April as well as the TAA/KYADA Conferences in June. We had hoped to launch this blog in happier times, but we still plan to offer our unique perspective as valuation experts as the pandemic impact unfolds. Working from home, we have more time to write these blogs, and we hope they are interesting to you. Feel free to reach out to us if you have valuation questions as to how your dealership may be affected.
Mercer Capital is a financial services firm specializing in business valuation. We also provide litigation support and transaction advisory services for clients big and small. Contact one of our professionals to discuss your needs in confidence. And stay safe.


