

The September 2024 SAAR came in at 15.8 million units, 3.3% higher than last month and in line with September 2023. At their September meeting, the Federal Reserve cut benchmark interest rates by 50 basis points and highlighted a slight rise in unemployment. This won’t directly or dramatically impact the industry, but we do expect to see the effects of this rate cut (and likely forthcoming cuts) within the industry over the next couple of months and into 2025. As an aside, our auto team had the distinct pleasure of seeing Chair Powell’s speech at the NABE conference in Nashville at the end of last month to get a firsthand listen to Chairman Powell’s expectations going forward.
Unadjusted Sales Data
On an unadjusted basis, the industry sold 1.17 million units during September 2024, a 17.9% decrease from last month and a 12.8% decrease from this time last year. The steep declines from both last month and last year may appear alarming but were likely influenced by the Friday and Saturday of Labor Day weekend falling in August instead of September. On a combined, unadjusted basis, August and September 2024 were just 2.5% lower than August and September 2023.
This month’s unadjusted sales fell short of the nine-year September average (2016 – 2024), which includes four years prior to the pandemic. See the chart below for a look at unadjusted sales over the last nine Septembers:
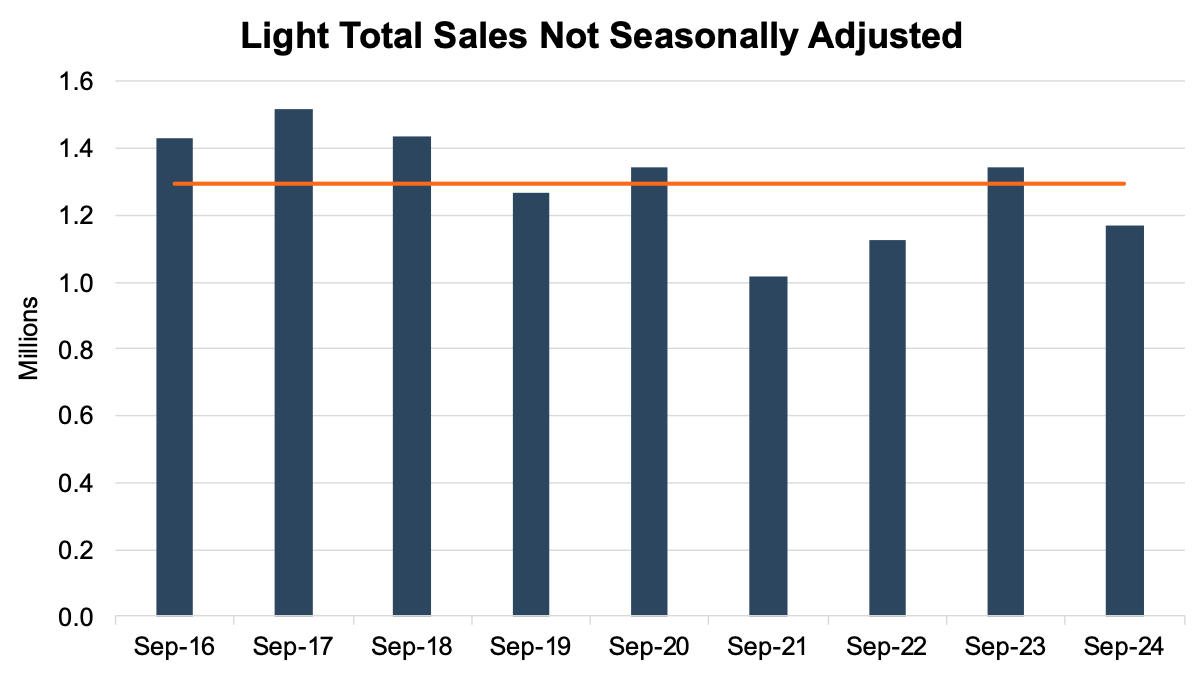 This chart does a good job of illustrating the cyclicality of the industry. Whether it be chip shortage, COVID, inflation, etc., the industry ebbs and flows with the economy.
Days’ Supply
An inventory-to-sales ratio greater than 1.0x indicates that the seasonally adjusted inventory level at the end of the month was greater than reported sales; this data tends to lag by a month or two. In August 2024, the industry’s inventory-to-sales ratio dipped to 1.36x from 1.60x in July 2024. While the month-over-month drop in the inventory-sales ratio appears major, the August metric is in line with pre-cyberattack levels. Looking at the longer-term trends, it is clear that inventories across most brands have been recovered for some time now as dealers are holding more inventory than they are selling in any given month. The chart below illustrates the industry’s inventory-to-sales ratio over the last three years.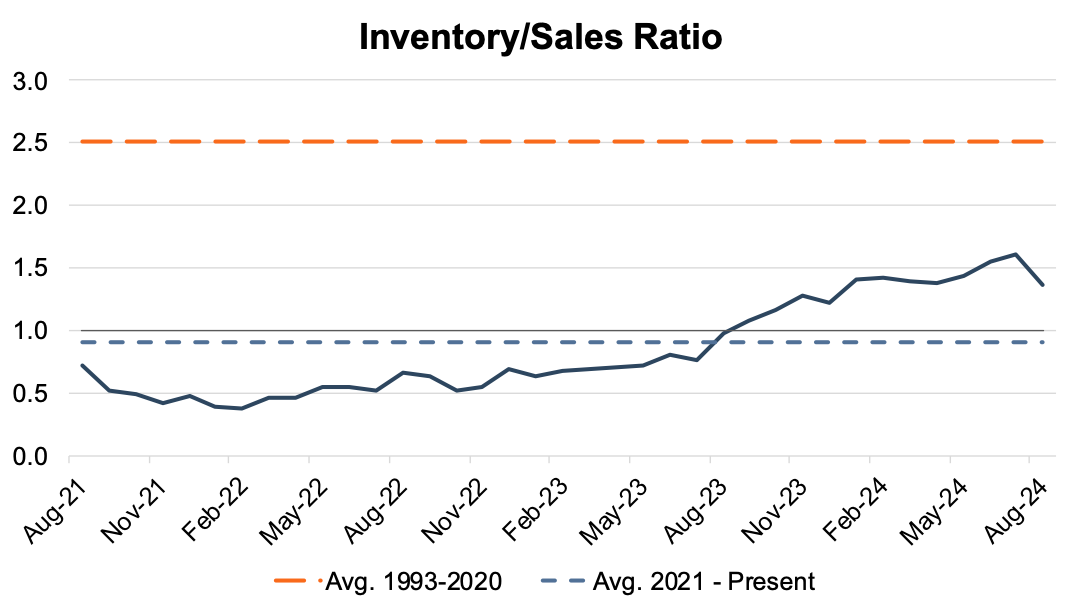 Taking a different look at inventory levels, days’ supply came in at 55 days in September 2024. Compared to days’ supply of 40 in September 2023, we see that the global supply chain has made significant progress in building inventory levels up; however, it is important to note that inventory levels vary greatly from brand to brand. The chart below presents days’ supply for U.S. light vehicles over the past 24 months (per Wards Intelligence).
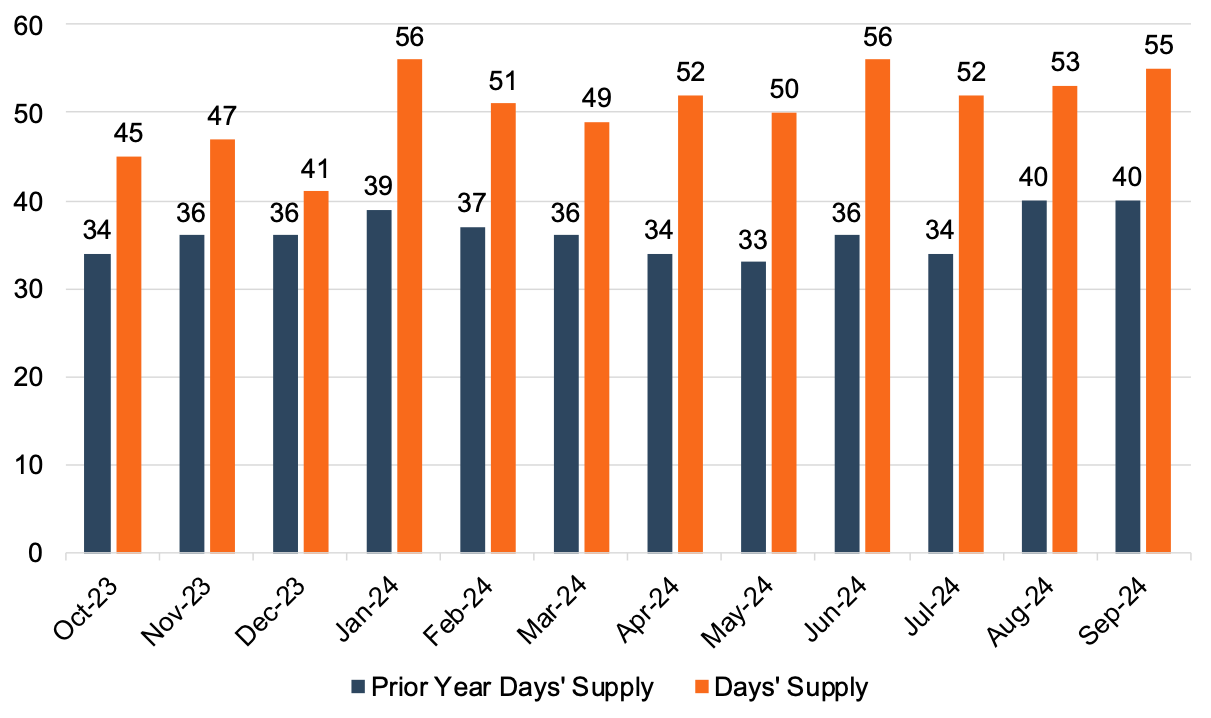
Transaction Prices
Thomas King, the president of data and analytics at J.D. Power, discussed the factors impacting average transaction prices for new vehicles in September:
“The average new-vehicle retail transaction price has fallen from a year ago due to higher manufacturer incentives, larger retailer discounts, and increased availability of lower-priced vehicles. Transaction prices are trending towards $44,467—down $1,296 or 2.8%—from September 2023. The combination of lower retail sales and lower transaction prices means that buyers are on track to spend nearly $40.4 billion on new vehicles this month—16.8% lower than September 2023.”
It is also important to note that dealerships have faced reduced profitability over the past year as inventory levels rise and prices soften. When consumers trade down, they also cut back on add-ons where dealers can typically pick up additional margin.
Incentive Spending and Profitability
Compared to the last three years, 2024’s pricing and inventory environment has been very different than the years following the COVID-19 pandemic (2020 – 2023). For example, approximately 13.6% of new vehicles transacted above MSRP in September 2024, sending total retailer profit per unit to $2,294. This figure represents a drop of 29% from this time last year. Moving forward, profitability will likely look different for dealers in this post-pandemic environment as the industry approaches pre-COVID levels of profitability and margin.
Because OEMs typically use incentive spending as a tool to increase volumes at the expense of profitability, incentive spending from manufacturers is typically inversely related to per-unit profitability. Particularly for over-inventoried brands, manufacturers will likely continue to utilize incentives as the primary method to sell units and normalize inventory levels. J.D. Power notes that average incentive spending per unit in September 2024 is expected to be $3,047, up a staggering 63.2% from September 2023. Incentive spending as a percentage of the average MSRP is expected to reach 6.2% during September 2024, an increase of 2.4 percentage points from this time last year.
October 2024 Outlook
Mercer Capital expects the October 2024 SAAR to land within the 15.5 to 16 million range. We expect the average transaction price to continue to moderate in the final quarter of 2024. However, vehicle purchasing for many consumers may receive a boost from recent rate cuts as most consumers are looking to afford monthly payments into their budgets, and falling interest rates can help them avoid trading down.
Mercer Capital provides business valuation and financial advisory services, and our auto team helps dealers, their partners, and family members understand the value of their business. Contact a member of the Mercer Capital auto dealer team today to learn more about the value of your dealership.