What Is the Car Parc Makeup?


Each quarter, Experian releases an Automotive Market Trends report. This report includes vehicle registration data from each state’s Department of Motor Vehicles, vehicle manufacturers, and captive finance companies. This week, we summarize the data from the Q3 2023 report and add insights for our dealership audience.
Vehicles in Operation
The makeup of vehicles in operation (“VIO”) in the U.S. and Canada can be a leading indicator of what to expect from automotive sales over the medium term. For example, VIO can inform industry-wide estimates of what models are currently the most popular to own, how many of those models should be manufactured, and, inevitably, how many should be marketed and sold. These estimates can be made based on changes in VIO, the average age of VIO, and what vehicle segments and brands makeup VIO.
Changes in Total VIO Over the Past Year
As of Q3 2023, VIO in the United States and Canada was 337 million. This includes light vehicles (cars, pickup trucks, SUVs, etc.) as well as medium and heavy-duty vehicles (large vans, delivery trucks, RVs, etc.) and power sports vehicles (motorcycles, snowmobiles, etc.). While tracking total VIO can be a valuable insight from a macroeconomic perspective, light vehicle totals are the most relevant to our auto dealer clients.
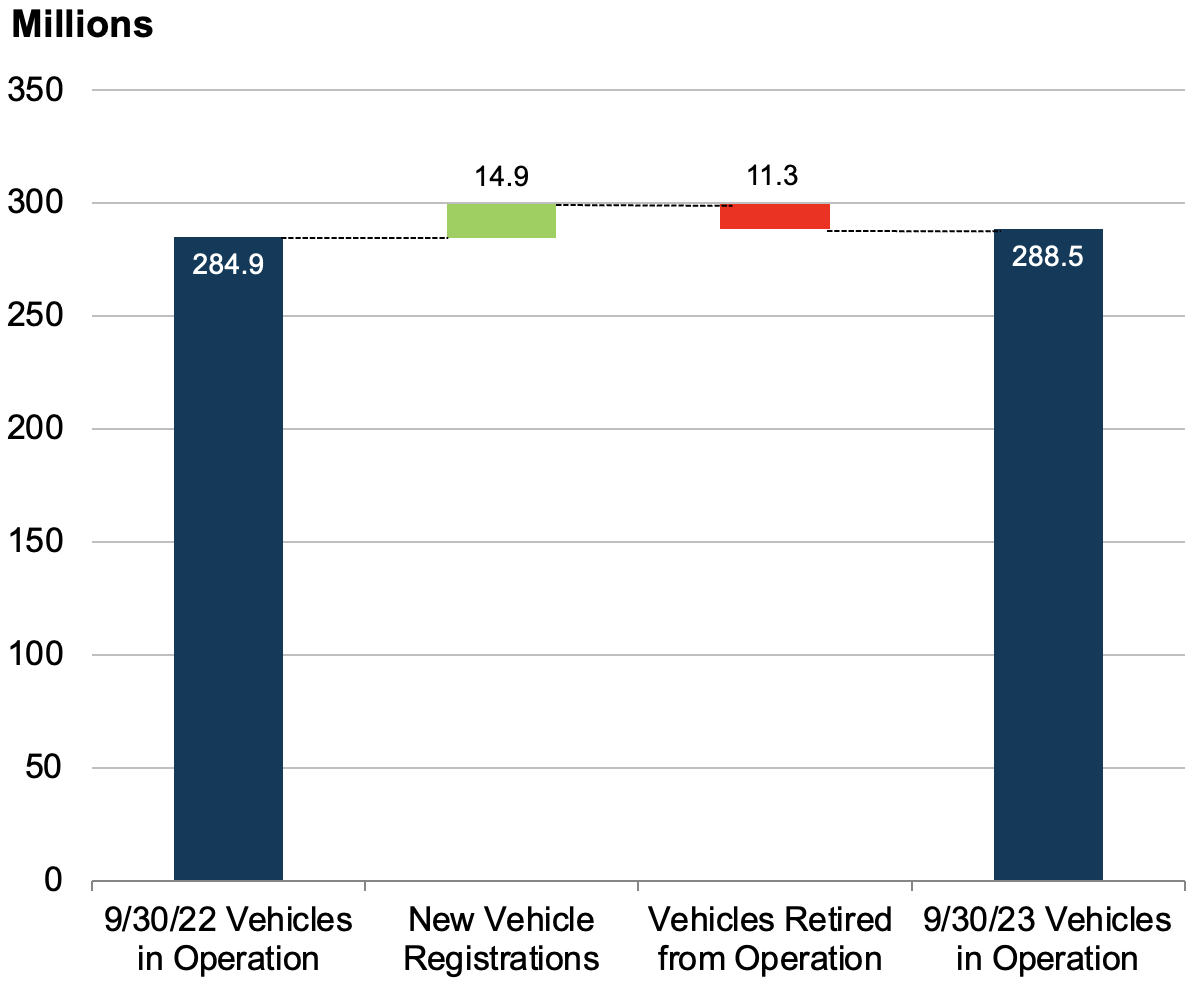
In the U.S. and Canada, light duty vehicles in operation were 288.5 million on September 30, 2023, a positive difference of 3.6 million units or 1.3% higher than the same figure in Q3 2022. The light vehicle VIO changes over the last twelve months are 14.9 million new vehicle registrations minus 11.3 million vehicles taken out of operation. See the chart below for a visualization of the change in VIO over the last year.
New vehicle registrations were up 13% to 11.5 million through nine months of 2023, while used vehicle registrations were down 2% to 29.3 million during the same period. These proportions tell the story of the past year for the auto dealer industry, as new vehicle inventories have finally recovered after a pandemic-disrupted 2021 and 2022.
As one might expect, used vehicle transactions do not directly affect VIO. These types of transactions do not add new vehicles to the Car Parc but rather represent existing vehicles changing hands. Over the past year, approximately 38 million used vehicles changed owners. When you combine the retirement of used vehicles and used vehicle changing-of-hands transactions, 17.3% of the total Car Parc was involved in a used vehicle transaction or retirement over the past year.
VIO by Model Year
Over the past decade, drivers have been holding on to their vehicles for longer, partially due to improved longevity in modern vehicles and partially due to market conditions like availability and pricing of new and used vehicles. In fact, according to Business Insider, the average age of a vehicle on the road hit 12.5 years in May 2023, which is up more than three months from 2022’s average and marks the sixth year in a row that the average age of vehicles on the road has increased. Despite the aging Car Parc, most of the country’s VIO is still newer than 20 years old. As of Q3 2023, 87% of total VIO were less than 20, and 95% were less than 25 years old.
According to the Automotive Market Trends report, there is an aftermarket “sweet spot” for the age of used vehicles, namely six to twelve years. This sweet spot is close to when most vehicles age out of general manufacturer warranties for repairs. As of Q3 2023, 35.8% of total VIO were within the used vehicle sweet spot (model years 2012 – 2018). This proportion is 4% higher than last year and 22.9% higher than this time in 2019 before the pandemic-related supply chain issues and production stoppages. Going forward, Experian expects the sweet spot to continue growing until 2026; it’s not a coincidence that it will stop growing six years after 2020. It is also worth mentioning that navigating negative equity and leases with fewer vehicles in the “newly used” category will be paramount for dealers during this time.
From the perspective of auto dealers, the ever-increasing average age of VIO is a double-edged sword. On one hand, a higher average age is likely to increase the volume of parts and service departments across the country. Parts and service margins are among the most favorable of a dealership’s profit centers, and dealers should look forward to increased work. On the other hand, a higher average age means consumers are purchasing vehicles less often, which could put slight pressure on selling departments going forward.
VIO by Vehicle Segment
Looking at the makeup of VIO by vehicle type, 52% of light-duty VIO were import models, and 48% were domestic models. Furthermore, SUVs/Crossovers (36% of total light-duty VIO), passenger cars (36%), and light trucks (27%) each makeup roughly a third of total light-duty VIO.
These broad vehicle types can be broken down into around 20 vehicle segments. Despite light trucks’ position as the least popular vehicle type, the full-size pickup truck segment is the most popular in the United States, representing 16.4% of total VIO. Full-size pickup trucks are followed by midsize cars (13.5%), midsize crossovers (11.7%), and compact cars (7.4%).
This data tells us something we already knew: consumers in the United States love to buy SUVs and pickup trucks. The mix of utility and freedom that comes with owning an SUV or pickup truck is very attractive to consumers across the country. However, these models are more expensive than their sedan counterparts and have less favorable gas mileage and other upkeep costs. As dealers know, rising and falling gas prices impact these decisions on the margins as a period of higher gas prices is likely followed by consumers purchasing more fuel-efficient options, be they EV, hybrid, or simply cars instead of crossovers. It bears noting that oil prices fell off a cliff in the latter part of 2014, with crude oil prices dropping from $108/bbl. in June 2014 to $44/bbl. in January 2015. It’s not a coincidence larger vehicles have become more popular since that time.
Consumers have gravitated toward this vehicle segment in the last several years despite the expenses. Car and Driver released an article in May 2020 highlighting the first month in recorded history that dealers sold more pickup trucks than cars, a trend that started in 2014 and has not slowed down since then. Furthermore, as of Q3 2023, the Ford F-150 (3.7% of total VIO) and the Chevrolet Silverado 1500 (2.7%) were the two most popular models on the road.
VIO gives a longer-term perspective and is a good reminder that the industry is cyclical. From January to November 2023, SAAR for light vehicles is 3.32 million import vehicles (21.5%) and 12.12 million domestic vehicles (78.5%), considerably more tilted to domestic than the total VIO. Car SAAR in 2023 is 3.1 million (20.1%) compared to 12.34 million light truck SAAR (79.9%), which includes SUVs/crossovers. While there has certainly been a trend towards larger vehicles, if sales revert to longer-term trends based on VIO, dealers should expect greater sales of imports and passenger cars in coming years.
VIO by Manufacturer
VIO by manufacturer is another way that the Car Parc can be analyzed. See the chart below for a look at VIO by manufacturer market share.
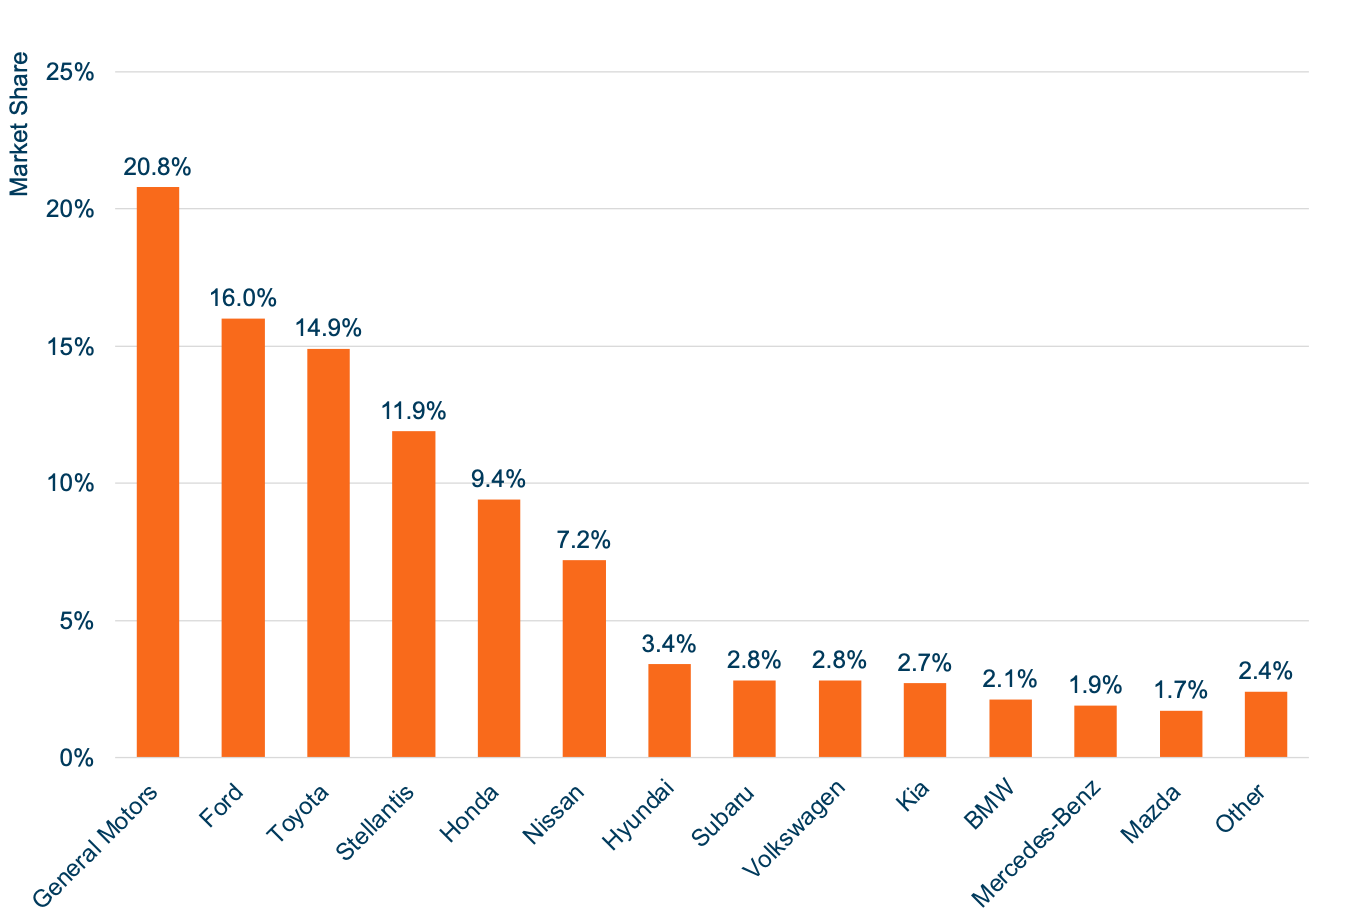
General Motors, Ford, and Toyota are the most popular manufacturers in this cross-sectional data snapshot. VIO by manufacturer data represents what vehicles are currently on the road and includes vehicles of all ages, not just new vehicles. This data does not reflect consumer satisfaction or current sales trends and is lagged and long-term. Therefore, this data is best viewed as a rearview mirror rather than a windshield for the industry. Going forward, we expect these proportions to slowly shift towards prevailing sales trends.
The Automotive Market Trends report also breaks down VIO by manufacturer for strictly new vehicles. This data is still lagged but can be much more prescriptive than the total VIO by manufacturer. For new vehicles, GM continues to lead the way (16.9% of total new registrations). Toyota is in the second-place spot (14.3%) and has been gaining over the last couple of years from a total VIO perspective. Perhaps we may see Toyota jump Ford and approach GM in total VIO soon.
This data is evidence of healthy operations for certain manufacturers and can reflect positively on dealerships for those brands. For example, relatively favorable performance in Toyota sales has translated to increased dealership values and is reflected in Blue Sky multiples for auto dealerships. The Q3 2023 Haig Report, an industry publication that provides updates on dealership values, increased their Blue Sky range for Toyota dealerships by 0.25x during the quarter, citing increased sales, increased acquirer interest, and favorable relationships with the manufacturer.
About Us
Mercer Capital provides business valuation and financial advisory services, and our auto team helps dealers, their partners, and family members understand the value of their business. Contact a member of the Mercer Capital auto dealer team today to learn more about the value of your dealership.