What Is the Makeup of the Car Parc?
Each quarter, Experian releases an Automotive Market Trends report. This report includes vehicle registration data from each state’s Department of Motor Vehicles, vehicle manufacturers, and captive finance companies. This week, we summarize the data from the Q3 2024 report and add insights for our dealership audience.
Vehicles in Operation
The makeup of vehicles in operation (“VIO”) in the U.S. and Canada can be a leading indicator of what to expect from automotive sales over the medium term. For example, VIO can inform industry-wide estimates of what models are currently the most popular to own, how many of those models should be manufactured, and, inevitably, how many should be marketed and sold. These estimates can be made based on changes in VIO, the average age of VIO, and what vehicle segments and brands make up VIO.
Changes in Total VIO over the Past Year
As of Q3 2024, VIO in the United States and Canada was 341.9 million. This includes light vehicles (cars, pickup trucks, SUVs, etc.) as well as medium and heavy-duty vehicles (large vans, delivery trucks, RVs, etc.) and power sports vehicles (motorcycles, snowmobiles, etc.). While tracking total VIO can be a valuable insight from a macroeconomic perspective, light vehicle totals are the most relevant to our auto dealer clients.
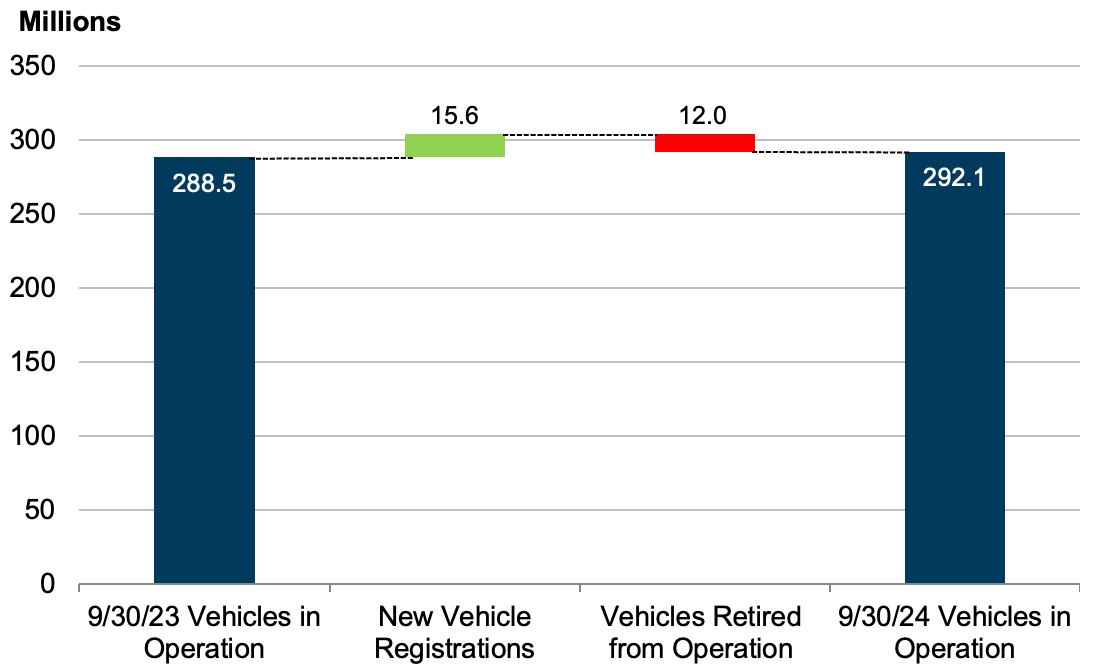
In the U.S. and Canada, light duty vehicles in operation were 292.1 million on September 30, 2024, a positive difference of 3.6 million units or 1.2% higher than the same figure in Q3 2023. In fact, light-duty VIO has increased by 3.6 million units for two years in a row. These two consecutive, identical increases may have happened by chance but certainly highlight a longer-term trend of expansion in the car parc due to increased manufacturing activity post-COVID and fewer retirements due to longer-lasting vehicles. A segment of consumers being financially stretched also contributes to an increasing age of VIO. The specific components of light vehicle VIO change over the last twelve months are 15.6 million new vehicle registrations minus 12.0 million vehicles taken out of operation. See the chart below for a visualization of the change in VIO over the last year.

New vehicle registrations were up 5.3% to 4.0 million during the third quarter of 2024, while used vehicle registrations were up 2.0% to 10.1 million. These positive growth rates over the third quarter tell the story of the past two years for the auto dealer industry: new vehicle inventories have been recovered for some time now after the pandemic and ensuing disruption from the chip shortage in 2020-2022 when registrations of both new and used vehicles fell before changing course and normalizing over the last two years.
As one might expect, used vehicle transactions do not directly affect VIO. These types of transactions do not add new vehicles to the car parc but rather represent existing vehicles changing hands. Over the past year, approximately 38.9 million used vehicles changed owners. When you combine the retirement of used vehicles and used vehicle changing-of-hands transactions, 17.4% of the total car parc was involved in a used vehicle transaction or retirement over the past year.
VIO by Model Year
Over the past decade, drivers have been holding on to their vehicles for longer, partially due to improved longevity in modern vehicles and, at times during the pandemic, due to market conditions like availability and pricing of new and used vehicles. Factors are also at play, such as persistently high transaction prices for new vehicles and consumer worries over the shift to electric vehicles.
The average age of a vehicle on the road hit 12.6 years in May 2024, according to Business Insider, which is up from 2023’s average and marks the seventh year in a row that the average age of vehicles on the road has increased. In the context of an aging car parc, most of the country’s VIO is still newer than 20 years old. As of Q3 2024, 83.9% of total VIO was less than 20, and 93.1% were less than 25 years old.
According to the Automotive Market Trends report, there is an aftermarket “sweet spot” for the age of used vehicles, namely six to twelve years. This sweet spot is close to when most vehicles age out of general manufacturer warranties for repairs. As of Q3 2024, 36.2% of total VIO were within the used vehicle sweet spot (model years 2013 – 2019). This proportion is 0.4 percentage points higher than last year and 5.3 percentage points higher than the same time in 2020 when the pandemic was in full swing. Going forward, Experian expects the sweet spot to continue growing until 2026. It is not a coincidence that the sweet spot is expected to stop growing six years after 2020, as pandemic-affected manufacturers released fewer vehicles during the pandemic years than before.
From the perspective of auto dealers, the ever-increasing average age of VIO is a double-edged sword. On one hand, a higher average age is likely to increase the volume of parts and service departments nationwide. Parts and service margins are among the most favorable of a dealership’s profit centers, and dealers should look forward to increased work. On the other hand, a higher average age means consumers are purchasing vehicles less frequently, which could put slight pressure on selling departments.
VIO by Vehicle Source, Type, and Segment
Looking at the makeup of VIO by domestic vs import, 58% of light-duty VIO were import models, and 42% were domestic models during Q3 2024. This represents a notable change from 52% import / 48% domestic just one year ago and emphasizes struggles by domestic manufacturers in recent years. Domestic automakers have lost market share to imports due to consumer perceptions of better reliability, technology, and fuel efficiency from foreign brands. Furthermore, challenges like a slower adaptation to trends such as electric vehicles have further hindered competitiveness between domestic and import brands.
Splitting light-duty VIO by type, SUVs/Crossovers (56.7% of total light-duty VIO), passenger cars (20.8%), and light trucks (22.5%) all contribute to light-duty VIO. SUVs and crossovers have exploded over the last few years, making up a larger share of light-duty VIO each period. These vehicles have gained market share from cars due to their versatility, higher seating position, and increased cargo space, which appeals to families and consumers with active lifestyles. The improved fuel efficiency of these models in recent years has made them more practical, while their perceived safety has also drawn consumers away from traditional sedans.
These broad vehicle types can be divided into around 20 more specific vehicle segments. The full-size pickup truck segment is the most popular in the United States, representing 16.4% of total VIO. Full-size pickup trucks are followed by midsize cars (13.0%), midsize crossovers (12.7%), and compact cars (8.1%). In recent years, midsize cars have lost some of their share to crossovers and compact cars. Looking at trucks specifically, as of Q3 2024, the Ford F-150 (3.7% of total VIO) and the Chevrolet Silverado 1500 (2.7%) were the two most popular models on the road.
VIO by Manufacturer
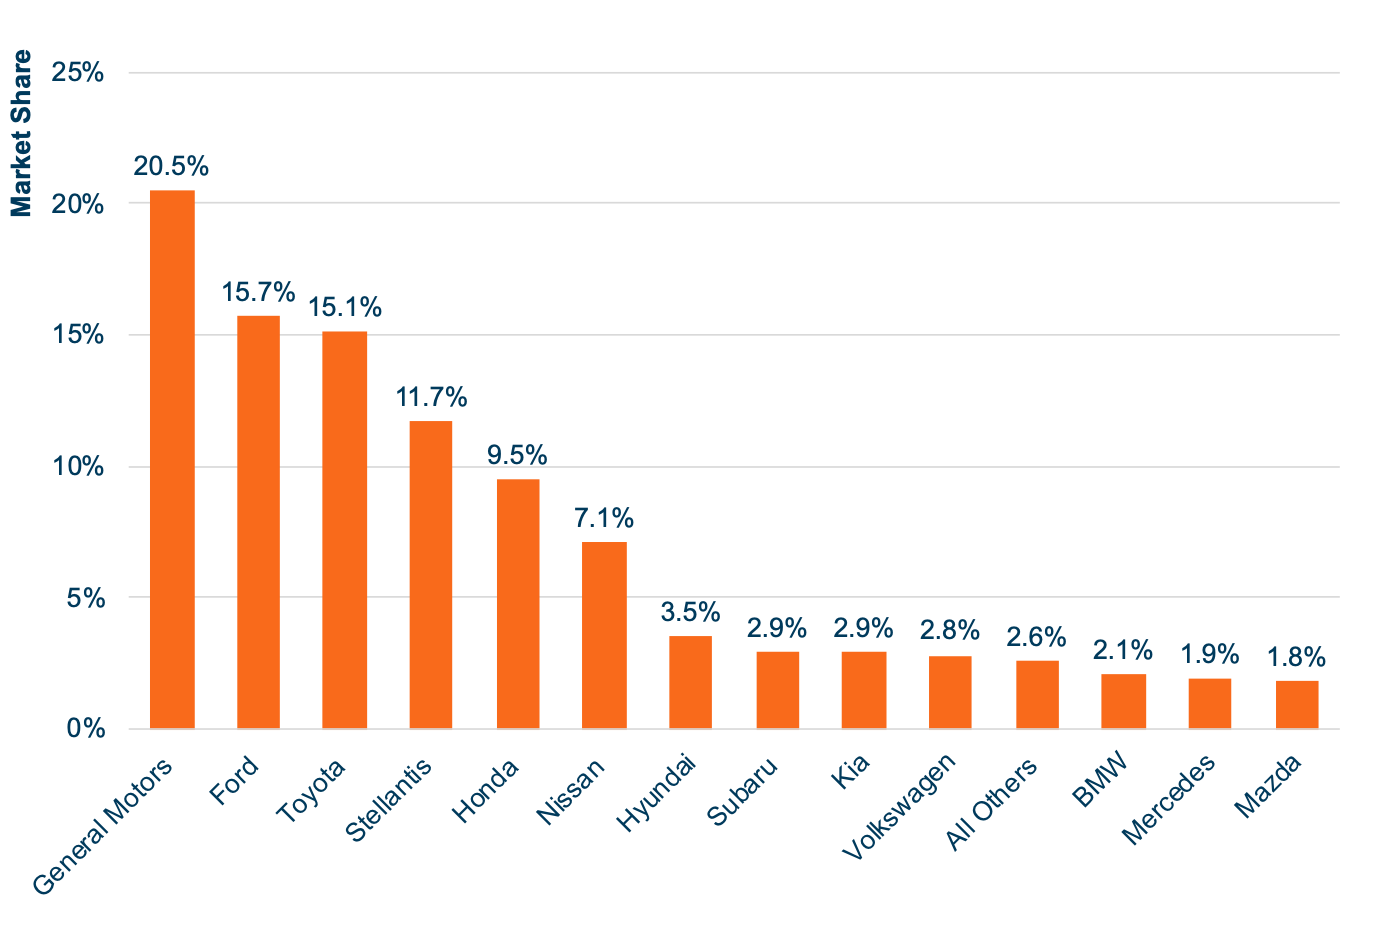
VIO by manufacturer is another way that the car parc can be analyzed. See the chart below for a look at VIO by manufacturer market share.

General Motors, Ford, and Toyota are the most popular manufacturers in this cross-sectional data snapshot. VIO by manufacturer data represents what vehicles are currently on the road and includes vehicles of all ages, not just new vehicles. This data does not reflect consumer satisfaction or current sales trends but typically lags because it is more long-term focused. Therefore, this data is best viewed as a rearview mirror rather than a windshield for the industry, though it gives an eye into parts and service departments today. Going forward, we expect these proportions to slowly shift towards prevailing sales trends.
GM and Ford continue to lead the way, representing 20.5% and 15.7% of total VIO, respectively. However, these two domestic manufacturers have slowly lost market share to import brands in recent years. The best example is Toyota, which has gained over the last couple of years but still lags behind Ford and GM. Perhaps we may see Toyota jump Ford and approach GM in total VIO soon. Kia is another notable mover on this list over the last year, as it gained two percentage points and jumped one spot from tenth to ninth.
In some ways, this data reflects what we’ve seen with auto dealership values. For example, Toyota has outperformed, as seen in the graph above, which has translated to higher dealership values as reflected in Blue Sky multiples.
About Us
Mercer Capital provides business valuation and financial advisory services, and our auto team helps dealers, their partners, and family members understand the value of their business. Contact a member of the Mercer Capital auto dealer team today to learn more about the value of your dealership.
 Auto Dealer Valuation Insights


