What’s in a Multiple?
Blue Sky Multiples Improved in 2020 After a Rocky Start, and Buyers Weigh Multiple Years of Earnings


Multiples and Methodologies Moved Considerably Through 2020
Prior to the tumultuous 2020, Blue Sky multiples for many brands could be relatively stable over numerous quarters. As seen in later charts, multiples don’t tend to shift dramatically on a quarterly basis. Multiples are dependent on numerous factors, though brand desirability is chief among them. This is usually tied to product lineup and the overall effectiveness of the OEM. However, the Covid-19 pandemic increased volatility in the economy to such a level that Blue Sky multiples reacted in a similar fashion regardless of brand. While multiples changed on a quarterly basis throughout 2020, notably, so did the earnings stream to which buyers applied the Blue Sky multiples.
According to Haig Partners, buyers have historically focused on adjusted profits from the last twelve months, which has been viewed as the best indication of expectations for the next year. Throughout most of 2020, Haig’s reported Blue Sky multiples were applied to 2019 earnings as these were viewed as the best indication of a dealership’s “run rate” prior to any COVID impact. When profitability improved and uncertainty began to decline around June 2020, multiples applied on these 2019 earnings rebounded. Now into 2021, Haig reports that buyers are using a three-year average of adjusted profits from 2018 through 2020 as the best prediction of future profits. This comports better with the approach taken by Mercer Capital. Given the longer product life cycles, we have historically and continue to take a more long-term approach when assessing the ongoing earning power of an auto dealership.
Given the longer product life cycles, we have historically and continue to take a more long-term approach when assessing the ongoing earning power of an auto dealership.
Dealers will likely need to ramp back up staffing levels and advertising to support sales, but strong demand relative to constrained supply has led to higher gross profits for dealers. While dealers are optimistic that the cost savings will be “sticky,” we note ten years of slow, consistent growth since the Great Recession led dealers to such an environment where there were excesses that could be cut out of the cost structure. We see earnings and sales levels normalizing which only bolsters the need to consider earnings in a multi-period context.
Illustrative Example: Lexus
To show the variance in Blue Sky values in 2020, we’re going to take pre-tax earnings for average luxury dealerships as reported by NADA and apply them to the appropriate multiple. Since Lexus was one of the largest movers and has the widest range, we’re cherry picking them as the best illustrative example.
In Q4 2019, Haig Partners reported a Blue Sky multiple range of 6.5x to 8.0x for Lexus dealerships. With 2019 pre-tax earnings of $2.2 million for the average luxury dealership, implied Blue Sky value for the average franchise would range between $14.5 million and $17.9 million. In Q1 2020, the multiple declined by 0.50x on the top and bottom end, dropping implied Blue Sky values to a range of $13.4 million to $16.7 million. By Q4 2020, multiples and earnings each increased significantly, and Lexus was up to a range of 8.0x to 10.0x as seen on the below graph.
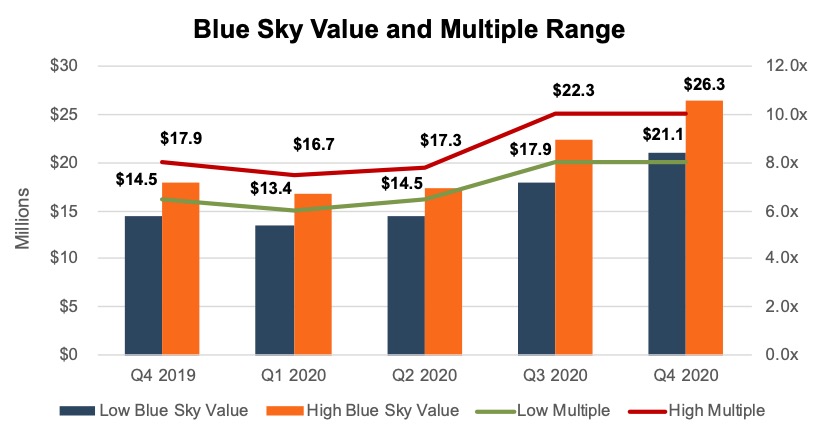
We note the range for Lexus dealerships has widened to two full turns of pre-tax earnings, or rather, two full years of profits. Applied to the three year average pre-tax earnings of the average luxury dealership, the difference in an 8x or 10x multiple represents a $5.3 million difference. High end multiple dealerships would have seen a value increase of $9.6 million ($16.7 million to $26.3 million) in that time, or 57.3%. While this appears high and all dealerships have their own unique characteristics, for context, the S&P 500 index was up 45.3% from March 31 to December 31.
Without any context on the reported multiples (the red and green lines above), one might think that values were stagnant in Q4. However, the multiples reported by Haig are now being applied to 3-year average earnings instead of 2019 earnings. For the average luxury dealership, 2019 pre-tax earnings were $2.2 million, which were below 2018. Factoring in the higher earnings of $3.4 million in 2020, the 3-year average is $2.6 million. So, as seen on the graph, a dealership on the top end of the range saw their value increase by approximately $4 million as higher earnings are applied to multiples that held firm.
Multiples reported by Haig are now being applied to 3-year average earnings instead of 2019 earnings.
Deal Activity Can be Positively Correlated to Multiples
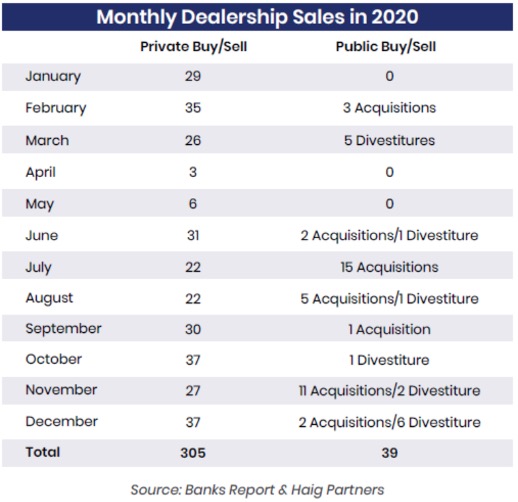
A multiple is a function of risk and growth, and certainly the outlook in March 2020 was higher risk than in in quarters prior to the pandemic. However, as seen below, very few transactions actually occurred during the initial economic decline as sellers were less interested in disposing of their most valuable asset at bargain prices. We note deal activity in 2020 was positively correlated with multiples, which makes intuitive sense and indicates a seller’s market in the back half of the year.
Blue Sky Multiples
In Q1, virtually every brand covered in the Haig Report saw a decline in their Blue Sky multiple. Fortunately, as SAAR rebounded, heightened levels of uncertainty abated, and dealers and the country at large embraced and adapted to the new normal, valuations partially recovered in Q2. With reduced uncertainty and higher profits, every brand except Volvo and VW received a higher blue sky multiple in Q3 2020 than Q4 2019 (pre-pandemic). In Q4 2020, the only multiple range that changed was that for Toyota which crept into the lead for mid-line imports.
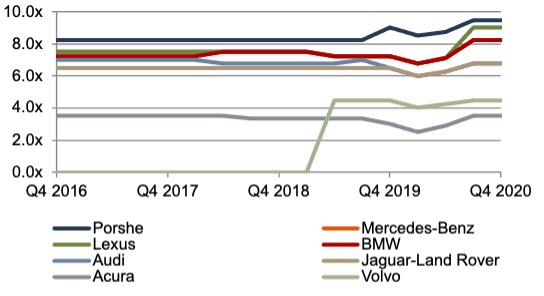
Luxury Brands
Luxury Blue Sky multiples followed the overall trend described above with drops in Q1, partial rebounds in Q2, then improved multiples in Q3, all relative to Q4 2019 multiples and earnings. Lexus saw the highest increase, from 6.0-7.5x in Q1 2020 to 8-10x in Q4. On the other end of the spectrum, Infiniti, Cadillac, and Lincoln continue to languish as brands without multiples, commanding a Blue Sky value range of up to $1.5 million. Each of these brands suffers from a myriad of issues, including costly facility upgrade requirements, which tend to weigh on Blue Sky values.
Mid-Line Import Brands
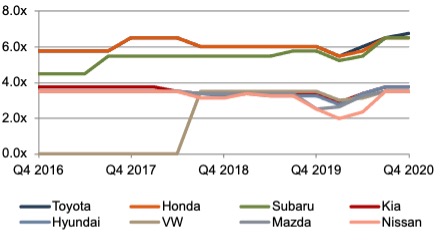
Mid-Line Imports multiples also followed the overall trend, as only VW’s Q4 wasn’t higher in 2020 than 2019 (each 3.0x – 4.0x). Nissan’s Blue Sky multiple in Q1 2020 declined to a paltry 1.5x on the low end, the lowest ever reported by Haig for any brand dating back to 2013. This was driven by troubles that began before the pandemic as corporate turmoil and an aging lineup weighed on dealer profits. At Q4 2020, this had rebounded to 3.0x – 4.0x, the highest for the brand since Q2 2018. Dealers that held on during the last few years have been rewarded. As noted previously, at the top end of mid-line imports, Toyota snuck its nose ahead of Honda, to pace the segment at 6.25x – 7.25x, on par with Jaguar/Land-Rover and Audi. Q2 and Q4 2020 were the only two quarters on record in which Toyota dealers have outpaced Honda, albeit only at a quarter turn multiple difference. Meanwhile, Subaru has caught up to Honda at 6.0x – 7.0x, a gap that has steadily narrowed since Subaru was closer to a 4.0x-5.0x multiple in 2016.
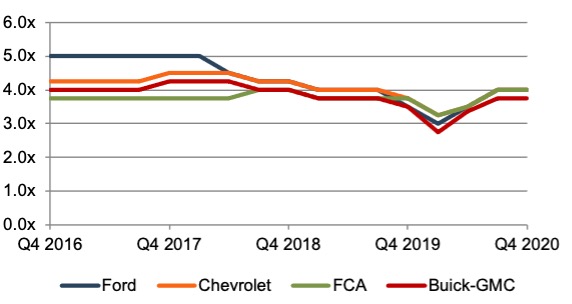
Domestic Brands
Domestic franchises continue to move largely in lockstep with each other as Buick-GMC remains just below the others who command a 3.5x to 4.5x multiple. Domestics continue to outpace many of the mid-line imports, reminding everyone that vehicle pricing power is not the sole consideration in these multiples. Luxury vehicles frequently receive the highest multiples. However, three luxury brands continue to not even receive a multiple while Volvo and Acura are on par or below their domestic counterparts.
Conclusion
Blue Sky multiples provide a useful way to understand the intangible value of a dealership and its corresponding franchise rights. These multiples provide context for someone familiar with the auto dealer space but perhaps not the specific dealership in question. Buyers don’t directly determine the price they are willing to pay based on Blue Sky multiples; they analyze the dealership and determine their expectation for future earnings capacity (perhaps within the context of a pre-existing dealership where synergies may be present) as well as the risk and growth potential of said earnings stream. The resulting price they are willing to pay can then be communicated and evaluated through a Blue Sky multiple, and if a dealer feels they are being reasonably compensated, they may choose to sell.
For dealers not yet looking to sell, Mercer Capital provides valuation services (for tax, estate, gifting, and many other purposes) that analyze these key drivers of value. We also help our dealer clients understand how their dealership may, or may not, fit within the published ranges of Blue Sky multiples. Contact a Mercer Capital professional today to learn more about the value of your dealership.