
On a recent client engagement, I was asked the question, “Why are Haig and Kerrigan’s multiples so far apart?” I’ve never really viewed them that way, as the blue sky multiples published in their quarterly newsletters tend to cluster reasonably close together.
While their multiples are usually within 1x of each other, this difference can be more pronounced on the lower end of the range as the decline in value from a 4x multiple to a 3x multiple is 25%.
In this week’s post, we reached out to our friends at the premier auto dealer investment banks to hear what they had to say.
What Is Blue Sky and Why Does It Matter?
“Blue sky” is the industry term for the intangible value associated with the sales and service agreements that dealers have with a particular brand
“Blue sky” is the industry term for the intangible value associated with the sales and service agreements that dealers have with a particular brand, also known as the original equipment manufacturer (“OEM”). The term blue sky is ubiquitous in the industry and is included in the vast majority of Letters of Intent (LOI) and Asset Purchase Agreements (APA) in the auto dealership M&A space.
A valuation report for an auto dealership that does not mention the term blue sky should be a red flag that the practitioner does not have sufficient industry experience. Where that experience becomes expertise is knowing how to incorporate blue sky into a valuation.
A blue sky multiple is applied to pre-tax income. If a dealership’s pre-tax earnings are $1,000,000 and the appropriate multiple is 5x, then the blue sky intangible value of the dealership operations would be $5,000,000. This is added to the assessed fair market value of tangible assets (real estate, equipment, etc.) to determine the total value of the dealership.
A shorthand way to think of a multiple is that it serves as a proxy for the payback period, or the number of years a buyer believes it will take to recoup the money paid for the acquisition.
Valuation multiples (blue sky or multiples in other industries) reflect the underlying risk and growth profile of the expected cash flows of the business. Higher multiples reflect less risky and/or faster-growing companies. For auto dealerships, risk and growth expectations are significantly, but not entirely, dependent on the brand.
What Do the Numbers Say?
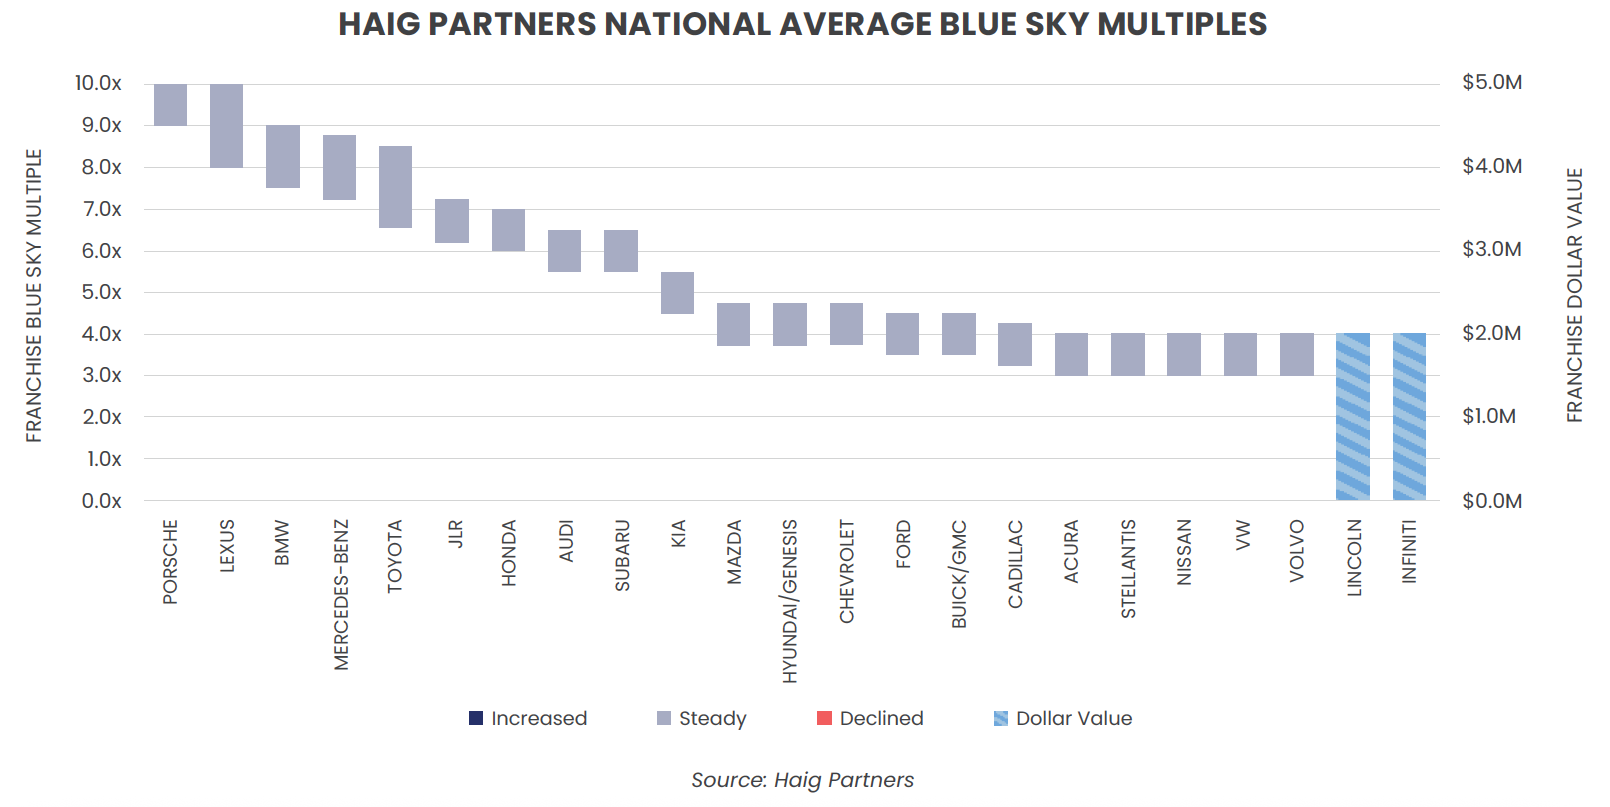
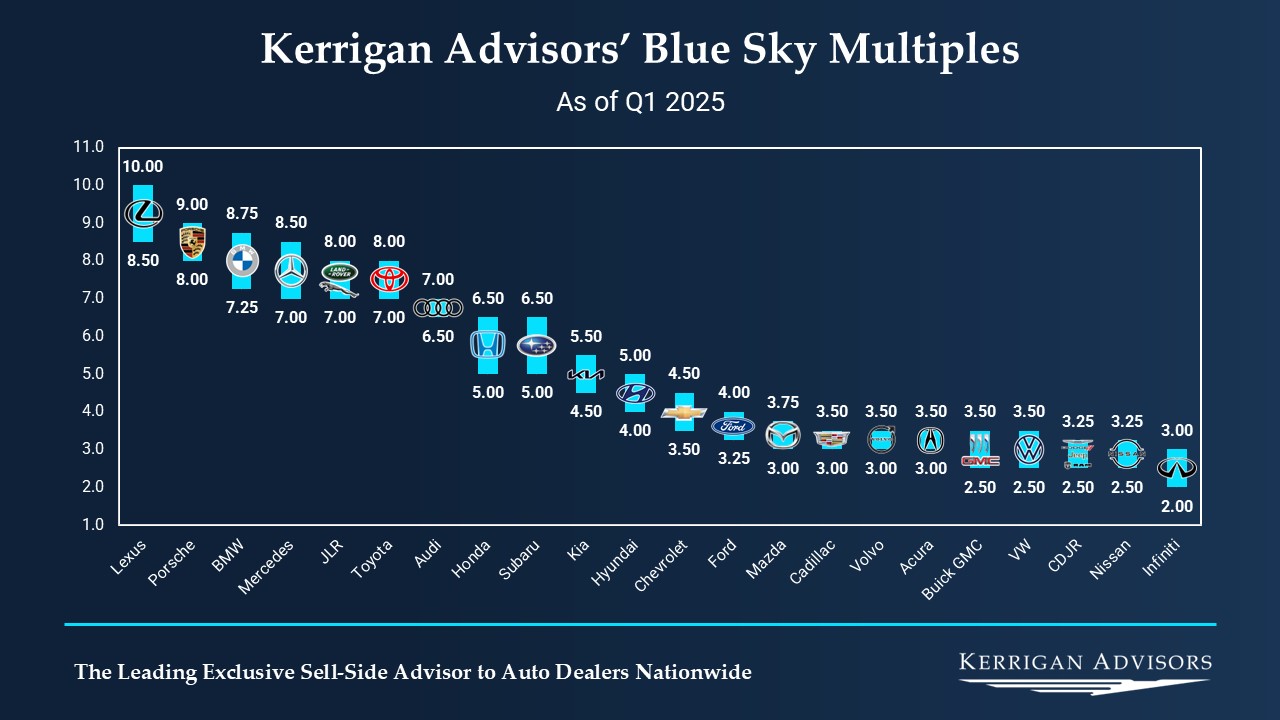
For this analysis, we are reviewing the recently released Q1 2025 editions of The Haig Report from Haig Partners and The Blue Sky Report from Kerrigan Advisors. For perspective, Haig’s and Kerrigan's multiple ranges are provided in the graphs below:
Click here to expand the image above
Click here to expand the image above
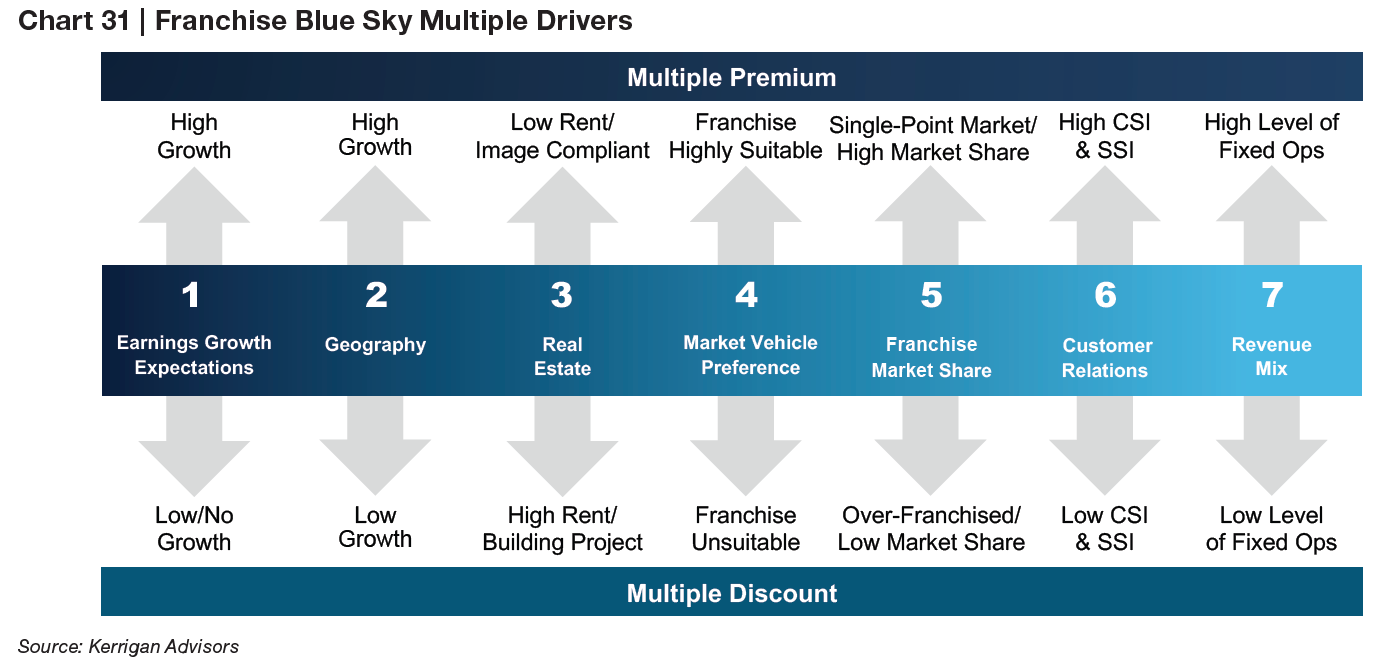
If you aren’t already subscribed, I highly recommend them, as the two newsletters provide significantly more insights than just blue sky multiples. They cover each brand individually, as well as discuss key performance metrics and industry trends. They also provide the factors they believe are most likely to indicate whether a store will transact on the upper or lower end of the range or even above or below the range. For example, Kerrigan’s seven factors for franchise value are shown in the chart below:
 Kerrigan also provides a factor assessment at the auto group level, which offers an important insight for groups that carry multiple rooftops. Both groups publish a range of blue sky multiples by franchise that can be as narrow as 0.5x (e.g., 6.5x-7x) or as wide as 2x (e.g., 8x-10x). The wider the range, the larger the perceived differences, depending on various attributes of the dealership in question. Taking the mid-point of their ranges, Haig and Kerrigan happen to agree on Kia (4.5x-5.5x) and Toyota (average of 7.5x), though Haig’s range for Toyota is wider than Kerrigan’s. The “largest” differences come on opposite ends of the spectrum, where Haig is one turn higher than Kerrigan for the average Porsche dealership (9.5x vs 8.5x) and Buick-GMC dealership (4x vs 3x).
The average difference between the two ranges is minimal at only 0.27x
While Haig’s multiples are more frequently higher than Kerrigan’s, it’s not by much. The average difference between the two ranges is minimal at only 0.27x. For 10 of the 21 brands covered by both groups, the multiple ranges are within 0.25x of each other.
Haig is higher than Kerrigan for 15 brands, they agree on two, and Kerrigan has a higher average range for four brands. We should also note that the Presidio Group publishes multiples that are within less than 1x of Haig or Kerrigan, except Subaru, which they are more bullish on.
Even at the widest gaps, the ranges provided for average dealerships are reasonably similar. Because these groups develop their multiples independently of each other, the similarity in the published ranges gives us confidence as valuation practitioners that we can reliably consider these multiples in our valuation approaches.
One important factor to consider is that transaction data for auto dealerships is sparse and typically consists of sales from multiple rooftops or brands at once.
Even when transaction information is reported, it’s normally on an aggregate basis. In an industry where the franchise is the most significant driver in what a buyer will pay, and many deals include multiple franchises, it’s essential to be able to disaggregate in this way using blue sky multiples for each brand
When we spoke to both Haig and Kerrigan, they both emphasized that their blue sky multiple ranges are guideposts or averages. By definition, there will be stores that transact above and below the average range; not every Kia store will trade from 4.5x-5.5x. One of the main benefits, in our opinion, is that these ranges demonstrate that buyers are willing to pay more for certain franchises than others, a fact that is not widely known. The comparisons between franchises may be even more instructive than the specific ranges of various franchises (e.g., a Toyota store could be 3x a Cadillac).
Why the Differences?
There are several reasons why Haig and Kerrigan’s multiples might be different. For example, domestic brands have significantly more locations than imports. While some GMC stores in prime locations and markets will trade at much higher multiples, when you consider there are over 1,650 GMC stores nationwide, the denominator effect can weigh on the average multiple.
Another potential reason for the differences is the level of activity within a brand
Another potential reason for the differences is the level of activity within a brand.
Stores that are being bought and sold in significant volume throughout the country provide more data points.
If there are fewer transactions, it can be harder to have real-time data, and bankers must rely on their expertise and other resources at their disposal. For example, if there are not many Acura stores that transact in a given year, it would be more difficult to have a nuanced opinion about how the average multiple may (or may not) have changed.
Both Haig Partners and Kerrigan Advisors are in constant communication with dealers, attorneys, accountants, and others in the industry so they can extend their knowledge base beyond just the deals they’re working on first-hand. Even on larger deals with numerous franchises, blue sky values may be identified on a per-store basis, yielding many more data points than you might otherwise think. One transaction could provide insight into many more franchises, both on an absolute and relative basis, depending on how the purchase price is structured and negotiated.
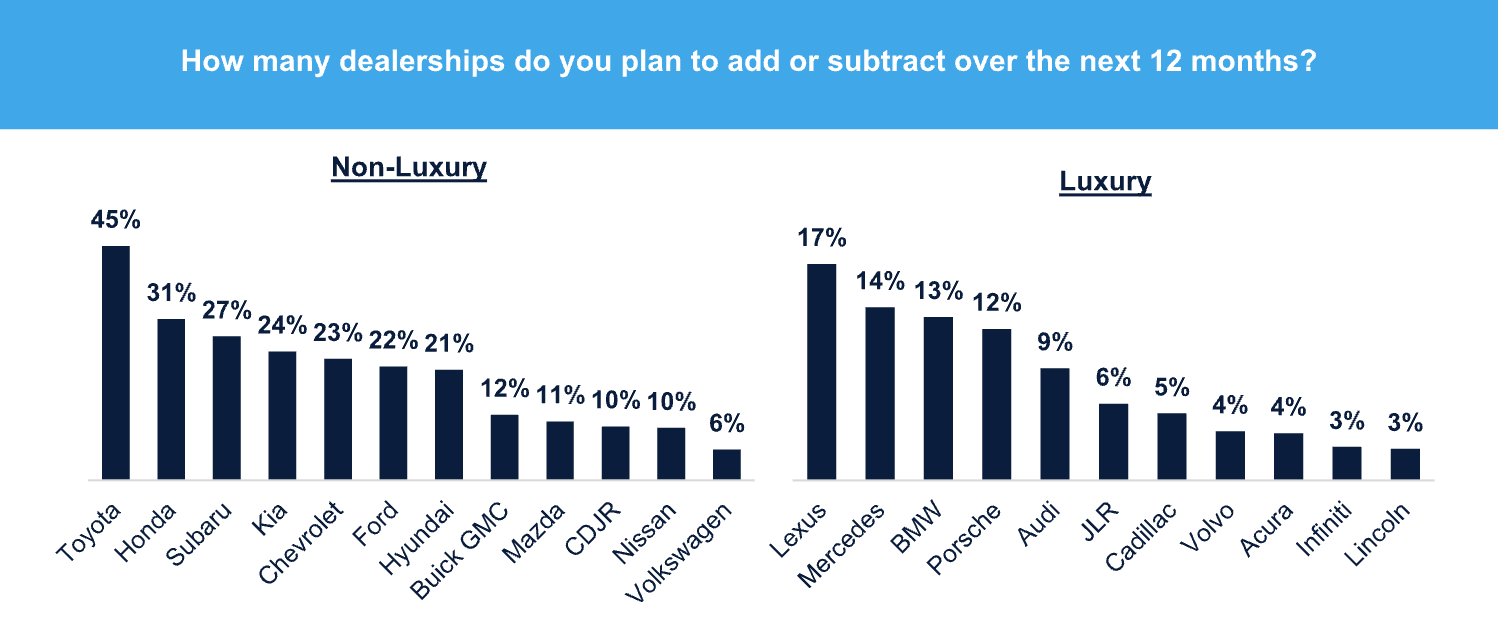
As another example, The Kerrigan Dealer Survey polls 600-800 dealers annually on a variety of topics. The most pertinent to this discussion is shown below. Lexus and Toyota are the most desirable franchises that dealers want to add, which lines up with the conversations we’ve had with our clients. This is an example of the market telling you what they’re willing to buy, and this graph aligns nicely with the published blue sky multiples.
Another Perspective
To balance this discussion, we also reached out to the Dave Cantin Group, which specializes in automotive M&A but does not publish multiples. Instead, they have their own internal database (Jump IQ) that leverages AI and considers a wide range of performance metrics to help triangulate what they believe a buyer might be willing to pay.
DCG believes there are inherent flaws in the multiple approach but recognizes how common they are.
In a recent article, they articulated why there may be flaws surrounding the multiple approach, particularly in light of the volatility seen in the post-COVID chip shortage environment, where a significant divergence in opinions emerged on what ongoing earnings would look like once things normalized. In this regard, we believe earnings may be the more volatile or subjective piece of the valuation puzzle than the multiple, but that’s certainly up for debate. We’ll discuss how each group thinks about developing ongoing earnings in an upcoming post.
Whose Multiples Are Right?
Whose multiples are “right”? This may be anticlimactic, but we don’t think there’s a good answer.
Your dealership may be a brand that Haig believes is more valuable than Kerrigan or vice versa. That still doesn’t mean your dealership will transact in the middle or even in that range. If you reached out to both of them, their preliminary estimates of valuation may be reversed based on different perspectives.
Blue sky value is in the eye of the beholder
A comment at a recent NADC conference that stuck with me was that no two used car managers would offer the same amount for a used vehicle trade-in. Why should you expect to receive the same value estimate from different investment banks?
As the title of the blog suggests, despite the average ranges, blue sky value is in the eye of the beholder. And the right advisor will hopefully introduce you to the buyer who will find your dealership the most beautiful.
Conclusion
Everyone I spoke to agreed that it is important to set the right expectations with clients from the outset, as nobody wants a reputation for overpromising and underdelivering. And because the sale of a dealership can be the most consequential economic event of a dealer’s life, it’s essential they have appropriate representation to protect the investment they’ve grown.
Something we’ve noticed over the years as we have been performing dealership valuations is that there aren’t always significant changes in multiples from quarter to quarter. If you think about it, this makes sense as these investments have longer holding periods, and the long-term value perception of a franchise tends to change much more gradually than quarterly. With new model years arriving annually and significant changes to their various models occurring even less frequently, the core product undergoes gradual changes over a long period. Layer that dynamic on top of how long it takes to invest capital into factories building electric vehicles, and you see further support for why multiples don’t change as frequently.
We want to thank DCG, Haig, and Kerrigan for speaking with us for this post. If you’re not looking to sell, contact a member of Mercer Capital’s auto dealership team to get a third-party perspective of where your dealership may (or may not) fall within these ranges.