Many people believe that the win/loss ratio doesn’t have much effect on revenues and attendance. They believe the local team has loyal fans who will attend games despite their performance. We investigate that assumption in this article focusing on Major League Baseball (MLB) by sampling a top tier, middle tier, and lowest tier team.
We analyze average season attendance of the league over the last five years and then track the three-team sample’s attendance and on-field performance.
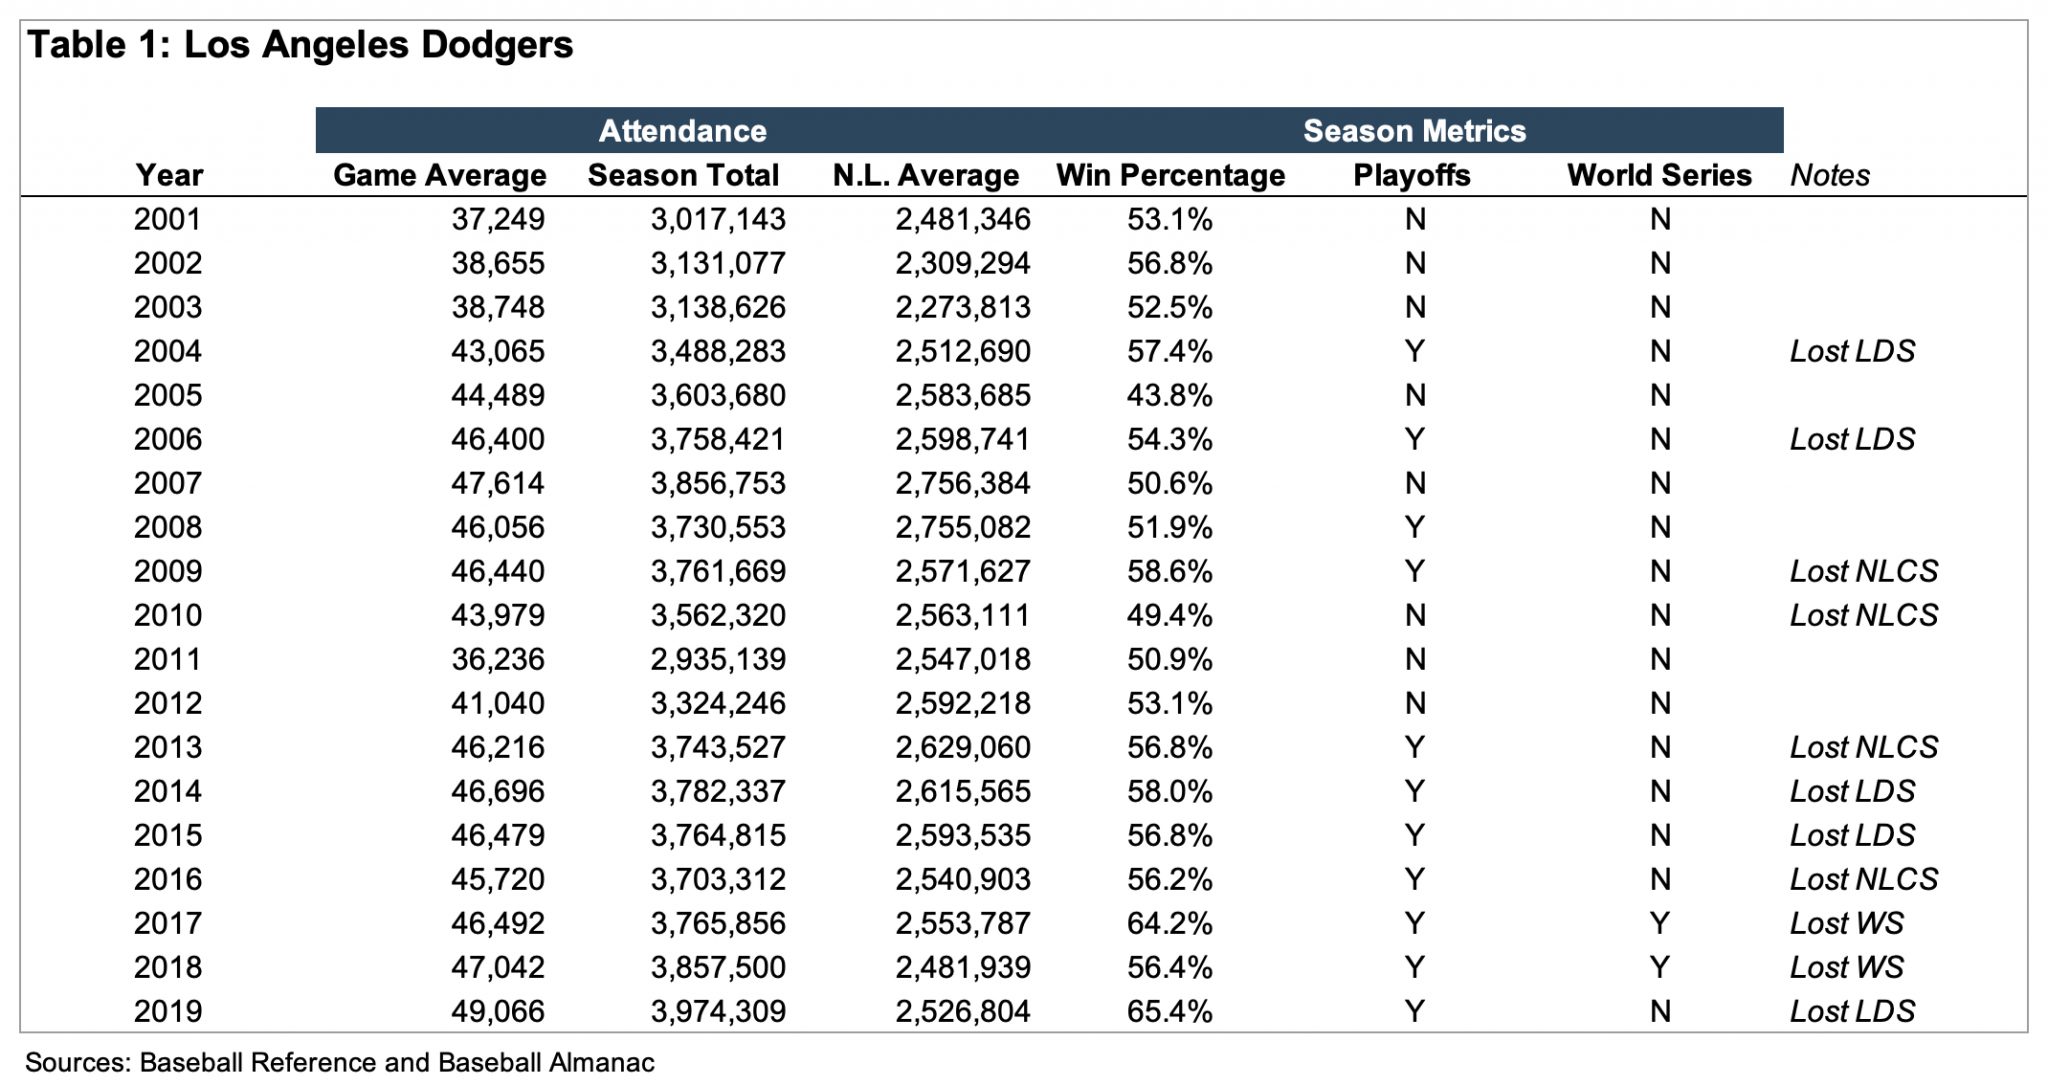
We have selected three teams to review their attendance vs. winning percentage, along with their playoff and World Series performance. Our sample consists of the Los Angeles Dodgers, the Texas Rangers and the Miami Marlins.
As a reference point, average season attendance for the MLB reached a peak in recent years at 2.5 million in 2007 for the American League and 2.8 million for the National League. The MLB averages dropped in the subsequent years and were finally steady around 2.3 million for the A.L. and 2.5 million for the N.L. during the next ten years. League attendance average declined, however, by 140,000 to 2,161,376 in 2018 and 2,039,521 in 2019.
The Dodgers attendance in 2007 was 3.9 million and stayed above 3.4 million for three years. This figure dropped to 2.9 million in 2011 yet returned to 3.7 million by 2013. Recently, season attendance has slowly climbed to approximately 4 million in 2019, marking an all-time team high.
This growth was greatly influenced by the Dodgers being in the World Series in 2017 and 2018, which helped push 2019 to a record high attendance. (See Table 1 for details)
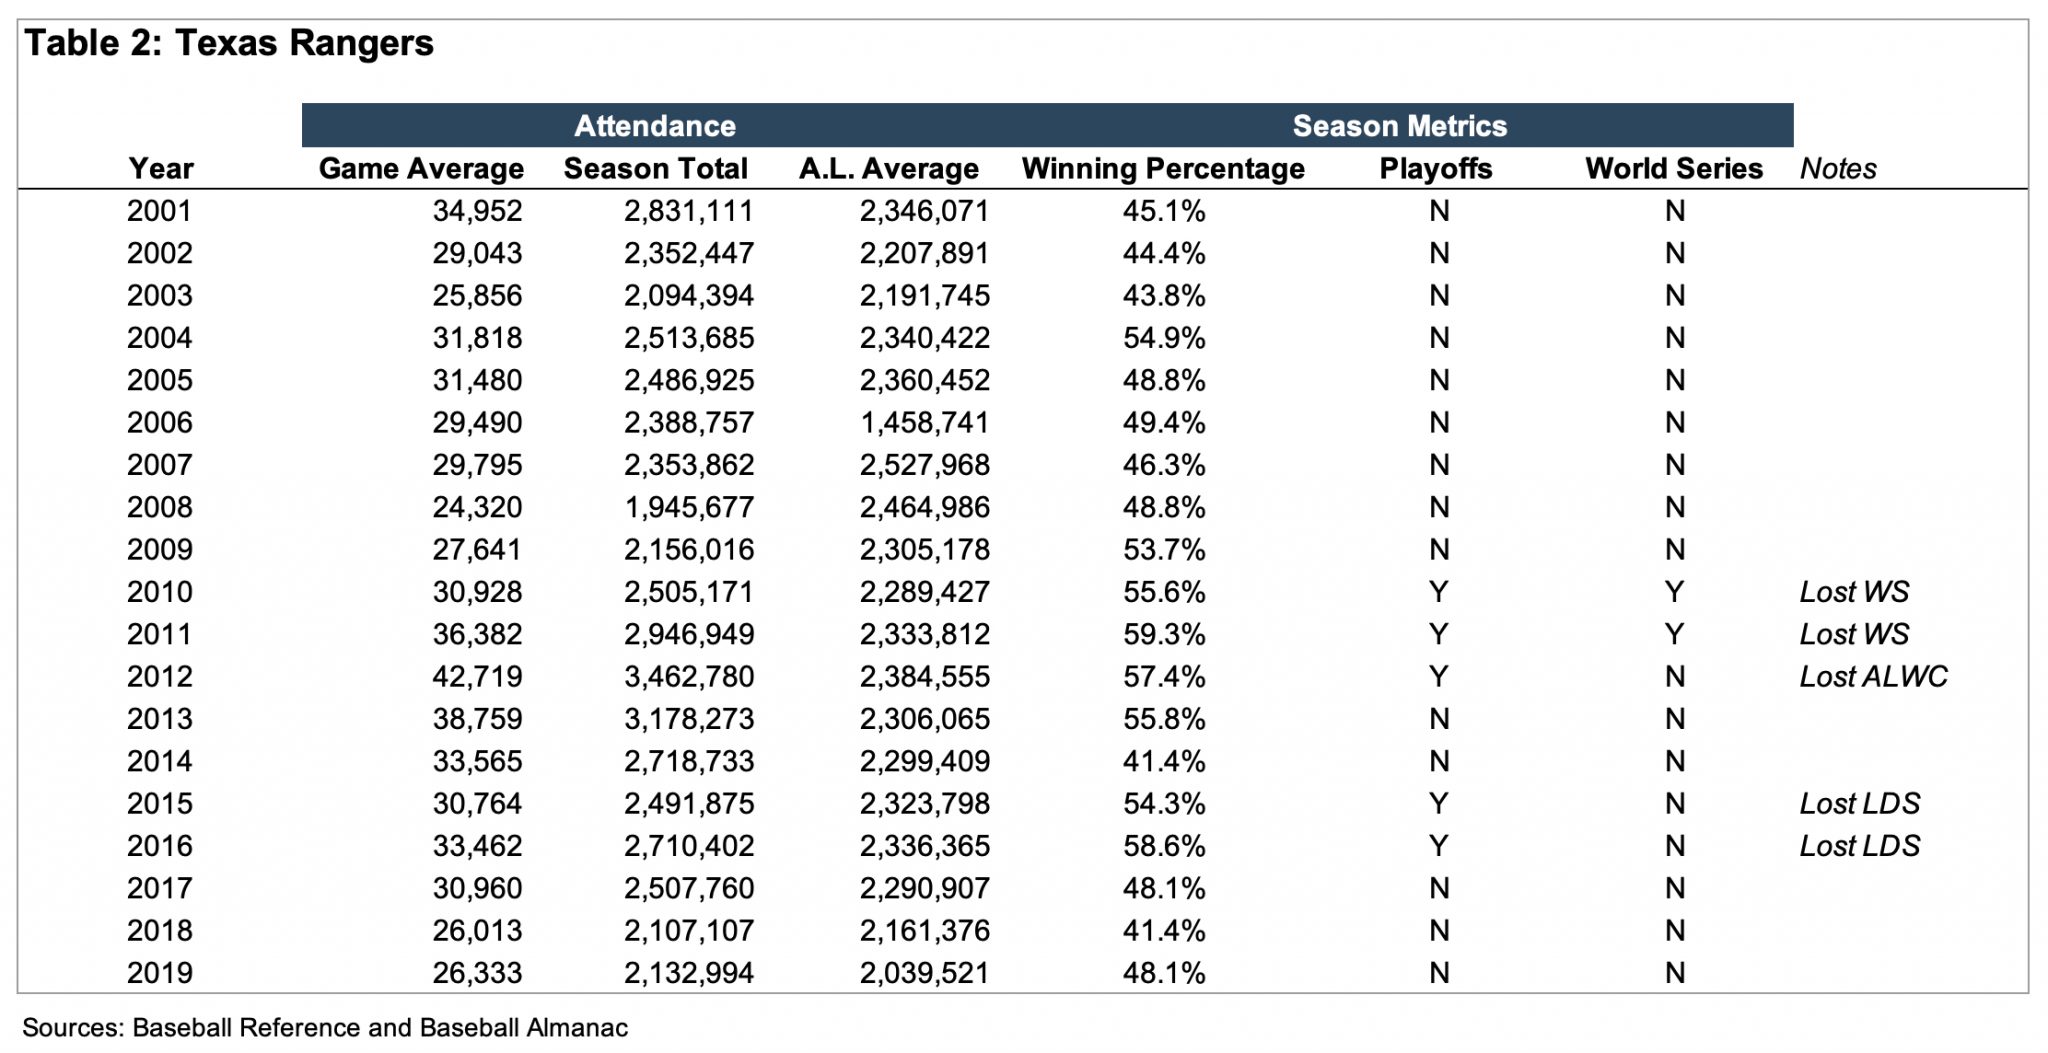
The Texas Rangers have experienced a different attendance history. They peaked in 2012 at 3.5 million after playing in the World Series in 2011 and the playoffs in 2012. The team didn’t make the playoffs in 2013 and 2014 and attendance dropped to 3.2 million and 2.7 million, respectively. The win/loss record dropped significantly from about 59% in 2011 to 41% in 2014.
Attendance followed the same trend by dropping 450,000 to 2.7 million in 2014. Even when the team made the playoffs in 2015, attendance fell to 2.5 million as a result of their poor record in 2014. The team’s 2015 win/loss ratio was near 59% and they made the playoffs, but not the World Series. In the following year, attendance increased to 2.7 million. The win/loss ratio dropped below 50% in 2017 to 2019 and they missed the playoffs each year. As a result, attendance dropped steadily to 2.1 million in 2019, a decrease of over 1.3 million people, or 38% from their peak in 2012. (SeeTable 2 for details)
The Miami Marlins clearly represent the bottom tier of the MLB in many categories. They built a brand-new state of the art ballpark in 2012 and attendance averaged about 1.7 million from 2014 to 2017. In the fall of 2017, the Derek Jeter group bought the team. and the new owners quickly traded notable high-priced players to other teams, including the NY Yankees, in order to reduce their losses. The new ownership group was hoping to stabilize attendance near the 1.7 million mark, but instead dropped to 811,000 in both 2018 and 2019; 367,000 less than the next worst attendance in MLB, which was Tampa Bay, and about 500,000 less than the third worst team, the Baltimore Orioles. (SeeTable 3 for details)

Without attempting to do a statistical analysis, what does the data mean? Yes, the quality of the players counts – especially if the win/loss record corresponds, however, winning percentage also impacts the ability to get into the playoffs and ultimately the World Series. It is clear from our experience and from the three-team sample that win/loss ratios have a major effect on MLB home stadium attendance.
The In Game Leaders (IGL) Winter Summit took place January 3, 2020 at the esports Stadium Arlington. IGL originated as a capstone project for summer interns at esports Stadium Arlington. The primary purpose of the Summit was to “[provide] the opportunity to learn from industry professionals and collegiate leaders as they speak about the various career paths in esports. IGL strives to teach parents and students how to develop a sustainable career in the rapidly-growing esports field.”
This second event (the first Summit was held on August 19, 2019) consisted of several panels that addressed collegiate esports, professional esports, as well as marketing and event management. The event drew approximately 150 people. We recap a few key panels below.
Alex Rocha (UT Arlington), Eric Aaberg (UT Dallas), Austin Espinoza (UT), Dylan Wray (UNT)
Traditional sports and esports at the collegiate level share some similarities. For example, not only do the teams practice and compete, but they workout and train in order to play to their potential. The players are one piece of the team, as there are also managers, coaches, and streamers that add value to the organization. Several universities across the country offer partial and full scholarships. As of December 2019, there were over 125 schools around the United States with esports programs.
Collegiate esports programs generally fall into two categories: club or varsity. Varsity esports programs enjoy the administrative and financial support of their educational institution while club esports organizations are student-run and have limited financial backing from their educational institution. The primary goal of most collegiate esports clubs is to become a varsity sport at their school.
A distinction between esports and traditional sports stems from the recruiting platform. In collegiate esports, recruiting currently consists of attracting students who are already on campus as opposed to recruiting from high schools. Although the recruiting landscape is less structured than in traditional sports, esports teams have had success in gaining interest from active students.
The main games played in collegiate esports include: Overwatch, League of Legends, Rocket League, Hearthstone, Super Smash Brothers, and Call of Duty. The teams encourage the gaming community on campus to join the organization, whether it be as an analyst, coach, or player. The teams emphasize that there is a position for everyone and that a student does not have to be the best at every game to bring value and compete.
Kyle Bautista (COO, Complexity), Hector Rodriguez (CEO, NRG/Huntsmen), Mike Rufail (Founder/CEO, Envy)
The esports industry is turning heads and opening eyes as it becomes compared to the traditional sports leagues. The panelists, often recognized as leaders in the industry, emphasized their passion for the rapidly growing esports space. They highlighted that because esports is relatively new, and because games have shorter shelf lives, it is harder to gain significant experience.
esports is categorized as a sector in the media and entertainment industry because it is able to capitalize on the vast audience that is watching or streaming. The panelists each recalled their favorite esports events, and all described those events as having the same euphoric feel as a traditional sports game. The crowd erupts for clutch play in a Call of Duty World Championship the same as a huge play in a Super Bowl. Each panelists has been a part of the evolution of the space and all see it heading in the right direction with time.
The franchise model that has developed in traditional sports has made its way to the esports platform. The industry is attempting to follow the blueprint of the major professional sports leagues. The industry leaders agreed that the structure is beneficial, but also emphasized that time, competition, and the willingness to learn and collaborate will take esports to the next level.
Simon Bennett and Markel Lee (AOE Creative)
As the esports industry experiences rapid growth, it is important for teams and companies to consider their brand identity. Bennett and Lee illustrated the struggles that companies within the industry often face when attempting to establish a brand or marketing initiative. Rather than simply making a brand logo that looks “cool,” Bennett and Lee challenge players in the industry to create a brand that captures the message they are attempting to create.
Simply put, “Do not build a brand, build a legacy.” – Markel Lee
Bennett and Lee were excited about the power of community marketing. Community marketing enables a vast audience to connect and establish a relationship with the message or objective that is being conveyed. The example given was the Marshmello Fortnite concert – the most attended concert in history. The concert was able to be seen by the virtual community that was playing Fortnite at the time of the event. This brilliant marketing scheme was able to capture over 10 million players at once.
Kyle Stephenson (Gearbox), John Davidson (PRG), Justin Varghese (Dreamhack)
Stephenson, Davidson, and Varghese explained the challenges and satisfactions of creating events in the esports space. With sponsorships providing the biggest source of revenue in the industry, events are extremely important to execute well. Creating a debut event or launching a new destination is a complicated process that takes exceptional diligence both before and after it occurs. In order to measure the success of the event, it is important to first set expectations. The three panelists agreed that expectations must be accurate going into an event.
Attracting a digitally native audience can be difficult, but it requires creating a “fear of missing out” (FOMO) in order to capture as many people as possible. For those unable to attend the first event, attracting them to the second event is also important.
A specific industry challenge is that most esports do not have a defined end. With no set run-time for most games, event managers must be prepared for every scenario. There can also be challenges that arise at an event such as power outages, which causes a delay in the audience’s experience. Putting the challenges aside, the key to executing a successful event is creating a fair and pure playing environment and enjoyable fan experience by providing an exceptional experience to as many people as possible.
The second IGL Summit built upon the success of the first. There was increased attendance and intriguing panel discussions. The overarching theme communicated by the panelists was that as an industry, esports is still developing. Due to the relative immaturity of the industry, best practices are not concrete and player movement mechanisms are nebulous. However, there was a general sense of optimism for the industry. esports has made great strides over the past few years but still has plenty of room to grow. According to an article by Syracuse University, the number of projected esports viewers in the U.S. will reach 84 million in 2021, second only to the NFL. There has been an increase in transactions within the industry as well with one esports organization acquiring another for approximately $100 million.
As we find ourselves at the end of the decade, many pundits are considering what sector will be most heavily influenced by the disruptive impact of technology in the 2020s. Financial services and the potential impact of FinTech is often top of mind in those discussions. As I consider the potential impact of FinTech in the coming decade, I am reminded of the Mark Twain quote that “History doesn’t repeat itself but it often rhymes.”
A historical example of technological progress that comes to mind for me is the combine, a machine designed to efficiently harvest a variety of grain crops. The combine derived its name from being able to combine a number of steps in the harvesting process. Combines were one of the most economically important innovations as they saved a tremendous amount of time and significantly reduced the amount of the population that was engaged in agriculture while still allowing a growing population to be fed adequately. For perspective, the impact on American society from the combine’s invention was tremendous as roughly half of the U.S. population was involved in agriculture in the 1850s and today that number stands at less than 1%.
As I ponder the parallels between the combine’s historical impact and FinTech’s potential, I consider that our now service based economy is dependent upon financial services, and FinTech offers the potential to radically change the landscape. From my perspective, the coming “combine” for financial services will be not from one source or solution, but from a wide range of FinTech companies and traditional financial institutions that are enhancing efficiency and lowering costs across a wide range of financial services (payments, lending, deposit gathering, wealth management, and insurance). While this can be viewed as a negative by some traditional incumbents in the space, it may be a saving grace as we start the decade with the lingering effects of a prolonged historically low and difficult interest rate environment, and many traditional players are still laden with their margin dependent revenue streams and higher cost, inefficient legacy systems. Similar to the farmers adopting higher tech planting and harvesting methods through innovations like the combine, traditional incumbents like bankers, RIAs, and insurance companies will have to determine how to selectively build, partner, or acquire FinTech talent and companies to enhance their profitability and efficiency. Private equity and venture capital investors will also continue to be attracted to the FinTech sector given its potential.
As the years in the 2020s march on, FinTech acquirers and traditional incumbents face a daunting task to evaluate the FinTech sector. Reports vary but generally indicate that over 10,000 FinTechs have sprouted up across the globe in the last decade and separating the highly valued, high potential business models (i.e, the wheat) from the lower valued, low potential ones (i.e., the chaff) will be challenging. Factor in the complicated nature of the regulatory/compliance overlay and investors, acquirers, and traditional incumbents face the daunting task of analyzing the FinTech sector and the companies within it.
As a solution to this potential problem, the efficient operations and historical lessons learned in the agricultural sector from the combine may again provide insights for buyers of FinTech companies to learn from. For example, the major professional sports leagues in the U.S. all have events called combines where they put prospective players through drills and tests to more accurately assess their potential. In these situations, the team is ultimately the buyer or investor and the player is the seller. Pro scouts are most interested in trying to project how that player might perform in the future for their team. While a player may have strong statistics in college, this may not translate to their future performance at the next level so it’s important to dig deeper and analyze more thoroughly. For the casual fan and the players themselves, it can be frustrating to see a productive college player go undrafted while less productive players go highly drafted because of their stronger performance at the combine.
While not quite as highly covered by the fans and media, a similar due diligence and analysis process should take place when acquirers examine a FinTech acquisition target. This due diligence process can be particularly important in a sector like FinTech where the historical financial statements may provide little insight into future growth and earnings potential for the underlying company. One way that acquirers are able to better assess potential targets is through a process similar to a sports combine called a quality of earnings study (QoE). In this article, we give a general overview of what a QoE is as well as some important factors to consider.
What is a Quality of Earnings Study? A QoE study typically focuses on the economic earning power of the target. A QoE combines a number of due diligence processes and findings into a single document that can be vitally helpful to a potential acquirer in order to assess the key elements of a target’s valuation: core earning power, growth potential, and risk factors. Ongoing earning power is a key component of valuation as it represents an estimate of sustainable earnings and a base from which long term growth can be expected. This estimate of earning power typically considers trying to assess the quality of the company’s historical and projected future earnings. In addition to assessing the quality of the earnings, buyers should also consider the relative riskiness of those earnings as well as potential pro-forma synergies that the target may bring in an acquisition.
Analysis performed in a QoE study can include the following:
These areas are broad and may include a wide array of sub-areas to investigate as part of the QoE study. Sub-areas can include:
For high growth technology companies where the analysis and valuation is highly dependent upon forecast projections, it may also be necessary to analyze other specific areas such as:
This article discusses a number of considerations that buyers may want to assess when performing due diligence on a potential FinTech target. While the ultimate goal is to derive a sound analysis of the target’s earning power and potential, there can be a number of different avenues to focus on, and the QoE study should be customized and tailored to the buyer’s specific concerns as well as the target’s unique situations. It is also paramount for the buyer’s team to keep the due diligence process focused, efficient, and pertinent to their concerns. For sellers, a primary benefit of a QoE can be to help them illustrate their future potential and garner more interest from potential acquirers.
Mercer Capital’s focused approach to traditional quality of earnings analysis generates insights that matter to potential buyers and sellers. Leveraging our valuation and advisory experience, our quality of earnings analyses identify and focus on the cash flow, growth, and risk factors that impact value. Collaborating with clients, our senior staff identifies the most important areas for analysis, allowing us to provide cost-effective support and deliver qualified, objective, and supportable findings. Our goal is to understand the drivers of historical performance, unit economics of the target, and the key risk and growth factors supporting future expectations. Our methods and experience provide our clients with a fresh and independent perspective on the quality, stability, and predictability of future cash flows.
Our methodologies and procedures are standard practices executed by some of the most experienced analysts in the FinTech industry. Our desire is to provide clients with timely and actionable information to assist in capital budgeting decisions. Combined with our industry expertise, risk assessment, and balanced return focus, our due diligence and deal advisory services are uniquely positioned to provide focused and valued information on potential targets.
Originally published in Mercer Capital’s Value Focus: FinTech Industry Newsletter, Year-End 2019.
Bank fundamentals, which are discussed in more detail below, did not change a lot between 2018 and 2019; however, bank stock prices and the broader market posted strong gains as shown in Table 1 following a short but intense bear market that bottomed on Christmas Eve 2018. Our expectation is that 2020 will not see much change in fundamentals either, while bank stocks will require multiples to expand to produce meaningful gains given our outlook for flattish earnings.

The primary culprit for the 4Q18 plunge and subsequent 2019 rebound in equity prices was the Fed, which has a propensity to hike until something breaks according to a long standing market saw. A year-ago the Fed had implemented its ninth hike in short-term policy rates that it controls despite the vocal protests of the President and, more importantly, the credit markets as reflected in widening credit spreads and falling yields on Treasury bonds and forward LIBOR rates.
One can debate how much weight the Fed places on equity markets, but it has always appeared to us that they pay close attention to credit market conditions. When the high yield bond and leverage loan markets shutdown in December 2018, the Fed was forced to pivot in January and back away from rate hikes after forecasting several for 2019 just a few months earlier. Eventually, the Fed was forced to reduce short rates three times and resume expansion of its balance sheet in the fourth quarter after halting the reduction (“quantitative tightening”) in mid-year.
Markets lead fundamentals. Among industry groups bank stocks are “early cyclicals,” meaning they turn down before the broader economy does and tend to turn up before other sectors when recessions bottom. One take from the price action in banks is that the economy in 2020 will be good enough that credit costs will not rise dramatically. Otherwise, banks would not have staged as strong a rebound as occurred.
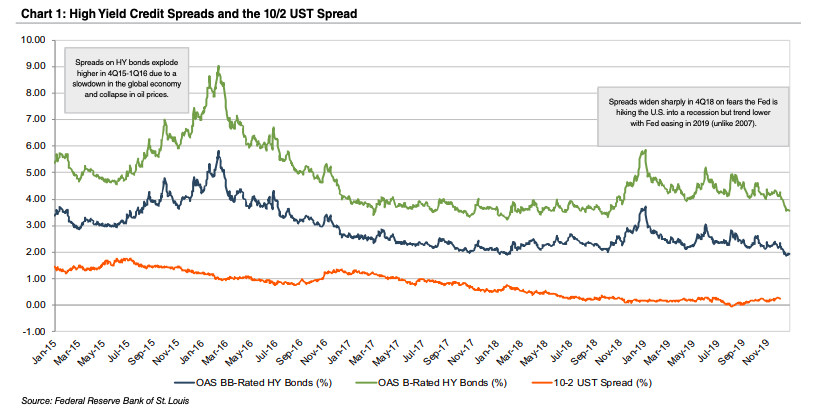
Likewise, somewhat tighter spreads on B- and BB-rated high yield bonds relative to U.S. Treasuries (option adjusted spread, “OAS”) since the Fed eased is another data point that credit in 2020 will not see material weakening. The stable-to-tighter spreads in the high yield market today can be contrasted with 2007 when OAS began to widen sharply even after the Fed began to cut rates and the U.S. Treasury curve steepened as measured by the spread between the yield on the two-year and 10-year notes.
Bank fundamentals are in good shape even though industry net income for the first three quarters of 2019 increased nominally to $181 billion from $178 billion in the comparable period in 2018. On a quarterly basis, third quarter earnings of $57 billion were below the prior ($63 billion) and year ago ($62 billion) quarters. Not surprisingly, earnings pressure emerged during the year as what had been expanding NIMs during 2017 and 2018 began to contract due the emergence of a flat-to-inverted yield curve, a reduction in 30/90-day LIBOR which serves as a base rate for many loans, and continuation of a highly competitive market for deposits. Also, loan growth slowed in 2019—especially for larger institutions.
As shown in Table 2, core metrics such as asset quality and capital are in good shape, while profitability remains high. Our outlook for 2020 is for profitability to ease slightly due to incrementally higher credit costs and a lower full year NIM although stabilization seems likely during 2H20. Nonetheless, ROCE in the vicinity of 10- 11% and ROTCE of 13-14% for large community and regional banks seems a reasonable expectation.

EPS growth will be lacking, however. Wall Street consensus EPS estimates project essentially no change for large community and regional banks, while super regional banks are projected to be slightly higher at 3%. Money center banks (BAC, C, GS, JPM, MS, and WFC) reflect about 6% EPS growth, which seems high to us even though the largest banks tend to be more active in repurchasing shares relative to smaller institutions where excess capital is allocated to acquisitions, too.
In the December 2018 issue of Bank Watch we opined it was hard to envision the Fed continuing to raise short-term rates even though the Fed forecasted further hikes. We further cited the potential for rate cuts. Our reason for saying so was derived from the market rather than economists because intermediate- and long-term rates had decidedly broken an uptrend and were heading lower.
As the calendar turns to 2020, the Fed has indicated no changes are likely for the time being. The market reflects a modest probability that one more cut will be forthcoming, but to do so in an election year probably would require long rates to fall enough to meaningfully invert the Treasury curve unlike the nominal inversion which occurred in mid-2019.
As it relates to bank fundamentals, the impact on NIMs will depend upon individual bank balance sheet compositions. Broadly, however, a scenario of no rate hikes implies NIMs should stabilize in 2H20 as higher cost CDs and wholesale borrowings rollover at lower rates. Also, if the Fed continues to expand its balance sheet (presently it is doing so through only purchasing T-bills through support of the repo market) then assets may remain well bid. All else equal, stable to rising prices in the capital markets usually are supportive of credit quality within the banking system.
A synopsis of bank valuations is presented in Table 3 in which current valuations for the market cap indices are compared to year-end 2018 and year-end 2017 as well as multi-year medians based upon daily observations over the past 20 years.
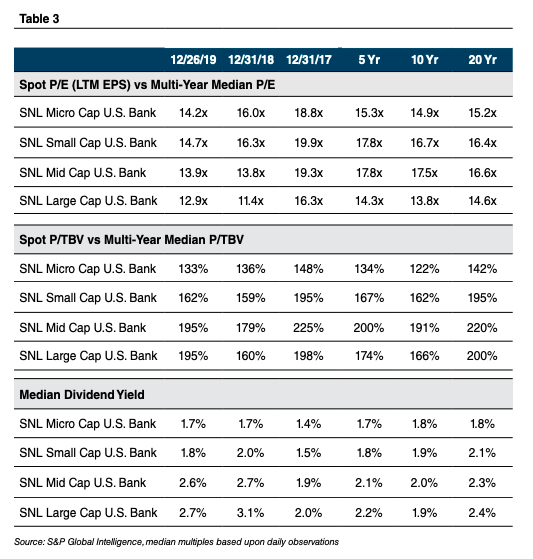
The table illustrates the important concept of reversion to the mean. Valuations were above average as of year-end 2017 due to policy changes that occurred with the November 2016 national elections that culminated with the enactment of corporate tax reform in late 2017. One year later valuations were “cheap” as a result of the then bear market that reflected concerns the Fed would hike the U.S. into a recession.
Despite the rebound in prices and valuation multiples during 2019, bank stocks enter 2020 with moderate valuations provided the market (and us) have not miscalculated and earnings are poised to fall sharply. Money center and super-regional banks are trading for median multiples of about 10x and 11x consensus 2020 earnings. Regional and large community banks, which include many acquisitive banks, trade for respective median multiples of 12x and 13x.
An important point is that valuation is not a catalyst to move a stock; rather, valuation provides a margin of safety (or lack thereof) and thereby can provide additional return over-time as a catalyst such as upward (or downward) earnings revisions can cause a multiple to expand or contract. Looking back to last year one might surmise the rebound in valuations reflects the market’s view that the Fed avoided hiking the U.S. into recession.
M&A activity has been robust with bank and thrift acquisitions since 2014 exceeding 4% of the industry charters at the beginning of each year. It appears once the final tally is made, upwards of 275 institutions will have been acquired in 2019, which would represent almost 5% of the industry. With only a handful of new charters granted since the financial crisis the industry is shrinking fast. As of Sept. 30, there were 5,256 U.S. banks and thrifts, down from about 18,000 in 1985.
While activity was steady at a high level in 2019, the most notable development was market support for four merger-of-equals (“MOE”) in which the transaction value exceeded $1.0 billion. The largest transaction closed Dec. 9 when BB&T Corp. and SunTrust merged to form Truist Financial Corp. Others announced this year include tie-ups between TCF Financial Corp./Chemical Financial Corp., First Horizon National Corp./IBERIABANK Corp., and Texas Capital Bancshares Inc./Independent Bank Group Inc. Although not often pursued, we believe MOEs are a logical transaction that if well executed provide significant benefits to community bank shareholders.
The national average price/tangible book multiple eased to 157% from 173% in 2018, while the median price/earnings (trailing 12 months as reported) declined to 16.8x from 25.4x (~21x adjusted for the impact of corporate tax reform). The reduction was not surprising given low public market valuations that existed at the beginning of 2019 because acquisition multiples track public market multiples with a lag.
We see 2020 shaping up as a potentially great year for bank M&A. The backdrop is an M&A trifecta: buyer and seller earnings will likely be flattish primarily due to sluggish loan growth and lower NIMs; asset quality is stable; and stock prices are higher, meaning buyers can offer better prices (but less value) to would-be sellers. Also, the capital markets remain wide open for banks to issue subordinated debt and preferred equity at very low rates to fund cash consideration not covered by existing excess capital.
This year appears to be the opposite of late 2018 in which a strong market for bank stocks is predicting continuation of solid fundamentals and possibly better than expected earnings. Nonetheless, an environment in which earnings growth is expected to be modest at best likely will result in limited gains in bank stocks given the rebound in valuations that occurred in 2019.
Originally published in Bank Watch, December 2019.
In our family law practice, we serve as valuation and financial forensic expert witnesses. There is typically another valuation expert on “the other side.” In several recent engagements, the following topics, posed as questions here, were raised as points of contention. We present them here to help the reader, whether you are a family law attorney or a party to a divorce, understand certain valuation-related issues that may be raised in your matter.
The financial and business valuation portion of a litigation is often referred to as a “battle of the experts” because you have at least two valuation experts, one for the plaintiff and one for the defendant. Hopefully your valuation expert has both valuation expertise and industry expertise. While industry expertise is not necessary in every engagement, it can be helpful in understanding the subtleties of the business in question.
Most businesses are dependent on the climate of the national economy as well as the local economy. For businesses who have a national client base, the health of the national economy trumps any local or regional economy. However, many of the businesses we value in divorce engagements are more affected by changes in their local and regional economy. It’s important for a business appraiser to understand the difference and to be able to understand the effects of the local/regional economy on the subject business. There is also a fine balance between understanding and acknowledging the impact of that local economy without overstating it. Often some of the risks of the local economy are already reflected in the historical operating results of the business.
Many of the corporate entities involved in litigation have sophisticated governance documents that include Operating Agreements, Buy-Sell Agreements, and the like. These documents often contain provisions to value the stock or entity through the use of a formula or process. Whether or not these agreements are to be relied upon in whole or in part in a litigated matter is not always clear. In litigated matters, focus will be placed on whether the value concluded from a governance document represents fair market value, fair value, or some other standard of value.
Two common questions that arise concerning these agreements are:
These are important questions to consider when determining the appropriate weight to place on a value indication from a governance document. In divorce matters, the out-spouse is often not bound by the value indicated by the governance document since they were not a signatory to that particular agreement. It is always important to discuss this issue with your attorney.
Similar to governance documents, internal transactions are a possible valuation data point. A good appraiser will always ask if there have been prior transactions of company stock and, if so, how many have occurred, when did they occur, and at what terms did they occur? There is no magic number, but as with most statistics, more transactions closer to the date of valuation can often be considered as better indicators of value than fewer transactions further from the date of valuation.
An important consideration in internal transactions is the motivation of the buyer and seller. If there have been multiple internal transactions, appraisers have to determine the appropriateness of which transactions to possibly include and which to possibly exclude in their determination of value. Without an understanding of the motivation of the parties and of the specific facts of the transactions, it becomes trickier to include some, but exclude others. The more logical conclusion would be to include all of the transactions or exclude all of the transactions with a stated explanation.
Most business owners have to submit personal financial statements as part of any guarantee on financing. The personal financial statement includes a listing of all of the assets and liabilities of the business, typically including some value assigned to the value of the business. In divorce matters, these documents are important as yet another valuation data point.
One view of the value placed on a business in an owner’s personal financial statement is that no formal valuation process was used to determine that number; so, at best, it’s a thumb in the air, blind estimate of value. The opposing view is the individual submitting the personal financial statement is attesting to the accuracy and reliability of the financial figures contained in document under penalty of perjury. Further, some would say that the value assigned to the business has merit because the business owner is the most informed person regarding the business, its future growth opportunities, competition, and the impact of economic and industry factors on the business.
For an appraiser, it’s not a good situation to be surprised by the existence of these documents. A good business appraiser will always ask for them. The business value indicated in a personal financial statement should be viewed in light of value indications under other methodologies and sources of information. At a minimum, personal financial statements may require the expert to ask more questions or use other factors, such as the national and local economy, to explain any difference in values over time.
Normalizing adjustments are adjustments made for any unusual or non-recurring items that do not reflect normal business operations. During the due diligence interview with management, an appraiser should ask if the business has non-recurring or discretionary expenses and are personal expenses of the owner being paid by the business? Comparing the business to industry profitability data can help the appraiser understand the degree to which the business may be underperforming.
An example of how normalizing adjustments work is helpful. If a business has historically reported 2% EBITDA (earnings before interest, taxes, depreciation, and amortization) and the industry data suggests 5%, the financial expert must analyze why there is a difference between these two data points and determine if there are normalizing adjustments to be applied. Let’s use some numbers to illustrate this point. For a business with revenue of $25 million, historical profitability at 2% would suggest EBITDA of $500,000. At 5%, expected EBITDA would be $1,250,000, or an increase of $750,000. In this case, the financial expert should analyze the financial statements and the business to determine if normalization adjustments are appropriate which, when made, will reflect a more realistic figure of the expected profitability of the business without non-recurring or personal owner expenses.
There are many other issues a valuation expert faces in divorce matters; however, the issues presented here were top of mind for us because they were present in recent engagements. Valuation can be complex. Serving as an expert witness can be challenging as well. However, having an expert with valuation expertise and experience is an advantageous combination in divorce matters. In future articles, we’ll discuss other issues of importance to hopefully help you become a more knowledgeable user of valuation services. In the meantime, if you have a valuation or financial forensics issue, feel free to contact us to discuss it in confidence.
Originally published in Mercer Capital’s Tennessee Family Law Newsletter, Third Quarter 2019.
In the June 2019 BankWatch we began a multi-part series exploring the valuation of community banks. The first segment introduced key valuation drivers: various financial metrics, growth, and risk. The second and third editions described the analysis of bank and bank holding company financial data with an emphasis on gleaning insights that affect the valuation drivers. We now conclude our series by assembling these pieces into the final product, a valuation of a specific bank.
While it would streamline the valuation process, there is no single value for a bank that is applicable to every conceivable scenario giving rise to the need for a valuation. Instead, valuation is context dependent. This edition of the series focuses on the valuation of minority interests in banks, which do not provide the ability to dictate control over the bank’s operations. The next edition focuses on valuation considerations applicable to controlling interests in banks that arise in acquisition scenarios.
Valuation specialists identify three broad valuation approaches within which several valuation methods exist:
The following discussion focuses on the valuation methodologies used most commonly for banks, the comparable company method and the discounted cash flow method.
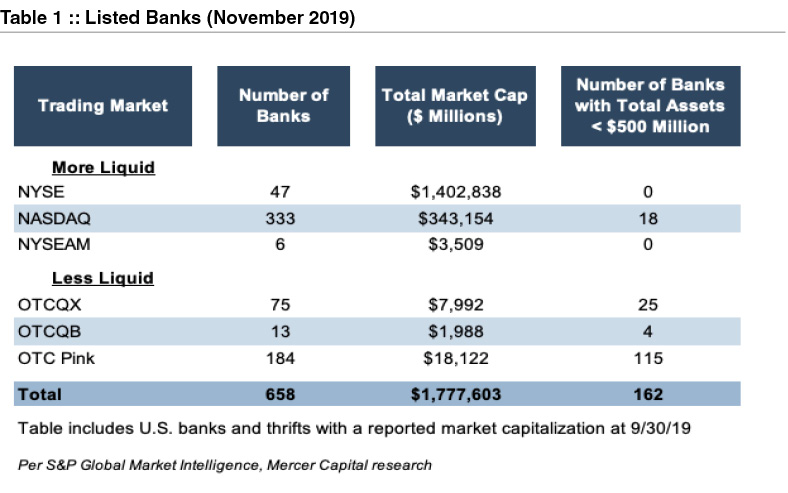
Bank analysts are awash in data, both regarding banks’ financial performance but also market data regarding publicly traded banks’ valuation. Table 1 presents a breakdown by trading market of the number of listed banks in November 2019.
To narrow this surfeit of comparable company data, analysts often screen the publicly traded bank universe based on characteristics such as the following:
Even after applying screens similar to the preceding, it remains doubtful that the publicly traded banks will exactly mirror the subject bank’s characteristics. This is especially true when valuing smaller community banks, as a relatively limited number of publicly traded banks exist with assets of less than $500 million that trade in more liquid markets. Ultimately, the analyst must determine an appropriate valuation multiple based on the subject bank’s perceived growth opportunities and risk attributes relative to the public companies. For example, analysts can compare the subject bank’s historical and projected EPS growth rates against the public companies’ EPS growth rates, with a materially lower growth outlook for the subject bank suggesting a lower pricing multiple.
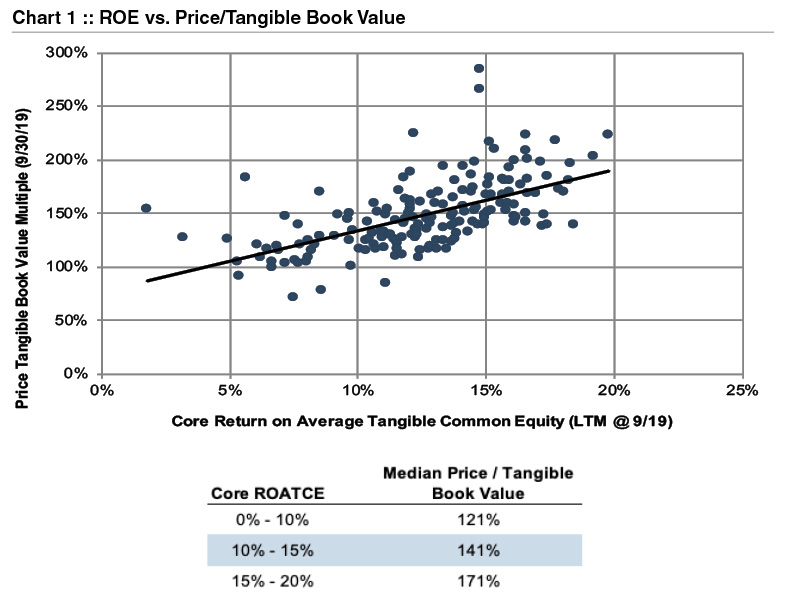
Part 1 of this community bank valuation series described various valuation metrics applicable to banks, most prominently earnings and tangible book value. It is important to reiterate that while bankers and analysts often reference price/tangible book value multiples, the earning power of the institution drives its value. Chart 1 illustrates this point, showing that price/tangible book value multiples rise along with the core return on tangible common equity. This chart includes banks traded on the NASDAQ, NYSE, or NYSEAM with assets between $1 and $10 billion.
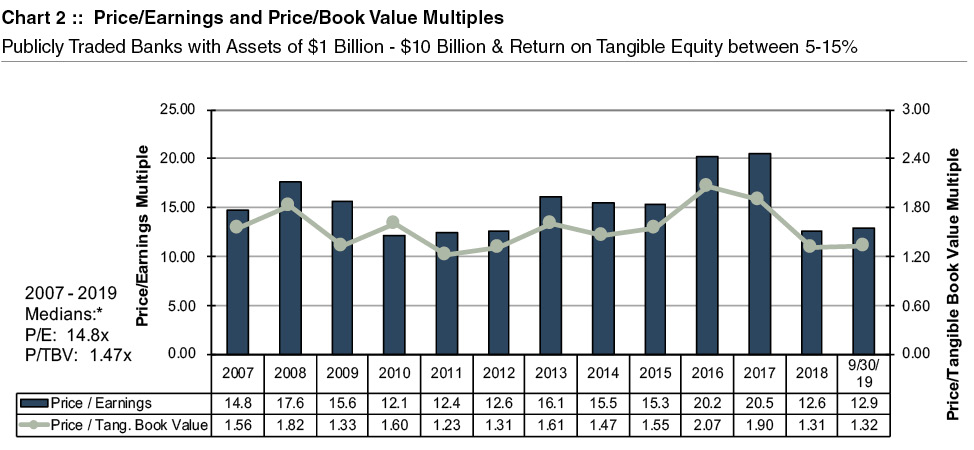
Since banking is a more mature industry, bank price/earnings multiples tend to vary within a relatively tight range. Chart 2 provides some perspective on historical price/earnings and price/tangible book value multiples, which includes banks traded on the NASDAQ, NYSE, or NYSEAM with assets between $1 and $10 billion and a return on core tangible common equity between 5% and 15%. Trading multiples in the first several years of the analysis may be distorted by recessionary conditions, while the multiples reported for 2016 and 2017 were exaggerated by optimism regarding the potential, at that time, for tax and regulatory reform. The diminished multiples at yearend 2018 and September 30, 2019 reflect a challenging interest rate environment, marked by a flat to inverted yield curve, and the possibility for rising credit losses in a cooling economy.
The discounted cash flow (DCF) method relies upon three primary inputs:
First, a few suggestions regarding projections:
In preparing a DCF analysis for a bank, the most meaningful cash flow measure is distributable tangible equity. The analyst sets a threshold ratio of tangible common equity/tangible assets or another regulatory capital ratio based on management’s expectations, regulatory requirements, and/or peer and publicly traded comparable company levels. Equity generated by the bank above this target level is assumed to be distributed to the holding company. After determining the holding company’s expenses and debt service requirements, the remaining amount represents shareholder cash flow, which then is captured in the DCF valuation analysis.
For a financial institution, the discount rate represents the entity’s cost of equity. Outside the financial services industry, analysts most commonly employ a weighted average cost of capital (WACC) as the discount rate, which blends the cost of the company’s debt and equity funding. However, banks are unique in that most of their funding comes from deposits, and the cost of deposits does not rise along with the entity’s risk of financial distress (because of FDIC insurance). Therefore, a significant theoretical underpinning for using a WACC – that the cost of debt increases along with the entity’s risk of default – is undermined for a bank. Analytical consistency is created in a DCF analysis by matching a cash flow to equity investors (i.e., dividends) with a cost of equity.
A bank’s cost of equity can be estimated based on the historical excess returns generated by equity investments over Treasury rates, as adjusted by a “beta” metric that captures the volatility of bank stocks relative to the broader market. Analysts may also consider entity-specific risk factors – such as a concentration in a limited geographic market, elevated credit quality concerns, and the like – that serve to distinguish the risk faced by investors in the subject institution relative to the norm for publicly traded banks from which cost of equity data is derived.
The terminal value is a function of a financial metric at the end of the forecast period, such as net income or tangible book value, and an appropriate valuation multiple. Two techniques exist to determine a terminal value multiple. First, the Gordon Growth Model develops an earnings multiple using (a) the discount rate and (b) a long-term, sustainable growth rate. Second, as illustrated in Chart 2, bank pricing multiples tend to vary within a relatively tight range, and a historical average trading multiple can inform the terminal value multiple selection.
In most analyses, the values derived using the market and income approaches will differ. Given a range, an analyst must consider the strengths and weaknesses of each indicated value to arrive at a final concluded value. For example, earnings based indications of value derived using the market approach may be more relevant in “normal” times, as the values are consistent with investors’ orientation towards earnings as the ultimate source of returns (either dividends or capital appreciation). However, in more distressed times when earnings are depressed, indications of value using book value assume more relevance. If a bank has completed a recent acquisition or is in the midst of a strategic overhaul, then the discounted cash flow method may deserve greater emphasis. We prefer to assign quantitative weights to each indication of value, which provide transparency into the process by which value is determined.
The analysis is not complete, however, when a correlated value is obtained. It is crucial to compare the valuation multiples implied by the concluded value, such as the effective price/earnings and price/tangible book value multiples, against those reported by publicly traded banks. Any divergences should be explainable. For example, if the bank operates in a market with constrained growth prospects, then a lower than average price/earnings multiple may be appropriate. A higher return on equity for a subject bank, relative to the comparable companies, often results in a higher price/tangible book value multiple. As another reference point, the effective pricing multiples may be benchmarked against bank merger and acquisition pricing to ensure that an appropriate relationship exists between the subject minority interest value and a possible merger value.
There are many valuation issues that remain untouched by this article in the interest of brevity, such as the valuation treatment of S corporations and the discount for lack of marketability applicable to minority interests in banks with no active trading market. Instead, this article addresses issues commonly faced in valuing minority interests in any community bank. A well-reasoned valuation of a community bank requires understanding the valuation conventions applicable to banks, such as pricing multiples commonly employed or the appropriate source of cash flow in a DCF analysis, but within a risk and growth framework that underlies the valuation of all equity instruments. Relating these valuation parameters to a comprehensive analysis of a bank’s financial performance, risk factors, and strategic outlook results in a rigorous and convincing determination of value. In the next edition, we will move beyond the valuation of minority interests in banks, focusing on specific valuation nuances that arise when engaging in a valuation for merger purposes.
Originally published in Bank Watch, November 2019.
Scott A. Womack, ASA, MAFF, Senior Vice President, originally presented the session “Will Kress v. U.S. Change Your Life? Or Will It Change Your Valuation Practice?” at the Forensic and Valuation Services Conference hosted by the Tennessee Society of CPAs on October 23, 2019.
Should Kress be immediately considered as support for tax-affecting earnings of a pass-through entity? In this session, Scott Womack tackles that question by taking a deep dive into the case including viewpoints from the participating experts, presenting the views of other commentators, and discussing the appeal by the IRS and its withdrawal.
Key learning objectives include:
Scott A. Womack, ASA, MAFF, Senior Vice President, originally presented the session “Critical Issues in Business Valuations and Family Transitions for Auto Dealers” at the 2019 Lane Gorman Trubitt Controllers’ Roundtable on October 17, 2019.
Auto dealers, like most business owners, can actually influence the value of their store. What are some of the value drivers of a store valuation and areas that appraisers adjust for in business valuations? Mr. Womack presents on these topics and discusses key elements of buy-sell agreements and other family transition issues that he observes from his auto dealer practice.
In our annual update of core deposit trends published a year ago, we described an increasing trend in core deposit intangible asset values in light of rising interest rates. At the time several more short-term rate hikes by the Fed were expected during 2018 and 2019. However, the equity and high yield credit markets disagreed as both fell sharply during the fourth quarter in anticipation of the December rate hike that the Fed later implemented.
A year later the Fed has cut three times in 2019 and thereby erased three of the four hikes it implemented in 2018. As 2019 unfolded, intermediate- and long-term U.S. Treasury rates declined from what appears to be cycle highs reached in November 2018 through August 2019. As a result, the U.S. Treasury curve inverted with short-rates that are closely tied to the Fed’s policy rates exceeding intermediate- and long-term rates. By late August 3-month bills yielded about 50bps more than the 10-year bond. Also, the spread between 10-year and 2-year Treasuries, commonly cited as an indicator of impending recessions when negative, was nominally negative. During October intermediate- and long-term rates rose modestly in anticipation of the third Fed rate cut supporting economic growth and thereby flattened the curve.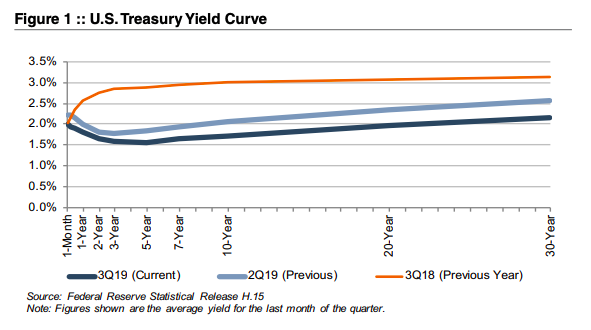
Alongside these fluctuations in the interest rate environment, the banking industry has seen increasing competition for deposits in recent years. Improved loan demand in the post-recession period has led to greater funding needs, while competition from traditional banking channels has been compounded by the increased prevalence of online deposit products, often offering higher rates. All of these trends have combined to make strong core deposit bases increasingly valuable in bank acquisitions in the post-recession years. One question to ponder, however, is how much the value attributable to core deposits may ease given the reduction in rates that has occurred recently.
Using data compiled by S&P Global Market Intelligence, we analyzed trends in core deposit intangible (CDI) assets recorded in whole bank acquisitions completed from 2000 through September 2019. CDI values represent the value of the depository customer relationships obtained in a bank acquisition. CDI values are driven by many factors, including the “stickiness” of a customer base, the types of deposit accounts assumed, and the cost of the acquired deposit base compared to alternative sources of funding.
For our analysis of industry trends in CDI values, we relied on S&P Global Market Intelligence’s definition of core deposits.1 In analyzing core deposit intangible assets for individual acquisitions, however, a more detailed analysis of the deposit base would consider the relative stability of various account types. In general, CDI assets derive most of their value from lower-cost demand deposit accounts, while often significantly less (if not zero) value is ascribed to more rate-sensitive time deposits and public funds, or to non-retail funding sources such as listing service or brokered deposits which are excluded from core deposits when determining the value of a CDI.
Figure 2 summarizes the trend in CDI values since the start of the 2008 recession, compared with rates on 5-year FHLB advances. Over the post-recession period, CDI values have largely followed the general trend in interest rates. As alternative funding became more costly during 2017 and 2018, CDI values generally ticked up as well, relative to post-recession average levels. During 2019, the trend reversed as CDI values have exhibited a declining trend in light of yield curve inversion and Fed rate cuts at its last three meetings.
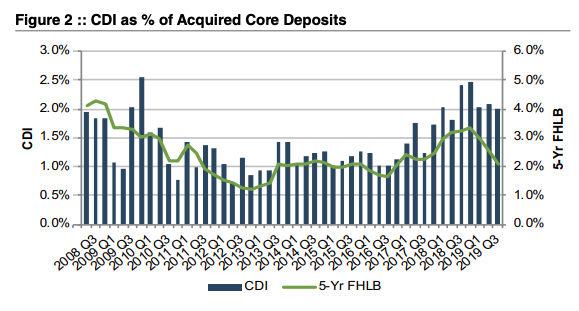
This decline in CDI values has been somewhat slower than the drop in benchmark interest rates, however, in part because deposit costs typically lag broader movements in market interest rates. In general, banks were slow to raise deposit rates in the period of contractionary monetary policy through 2018 and, as a result, rates remain below benchmark levels leaving banks less room to reduce rates further. For CDs, the lagging trend is even more pronounced given their nature as time deposits. Many banks attempted to “lock-in” rates by increasing reliance on CDs when expectations were for continued rate increases as late as year-end 2018. Now that rates are on the decline, banks have been stuck with CDs that cannot be repriced until their maturities even as benchmark rates fall. While time deposits typically are not considered “core deposits” in an acquisition and thus would not directly influence CDI values, they do significantly influence a bank’s overall cost of funds, and while funding costs remain high a strong core deposit base remains a valuable asset to acquirers.

Even as CDI assets remain above post-recession average levels at approximately 2.0- 2.5%, they are still below long-term historical levels which averaged closer to 2.5-3.0% in the early 2000s.
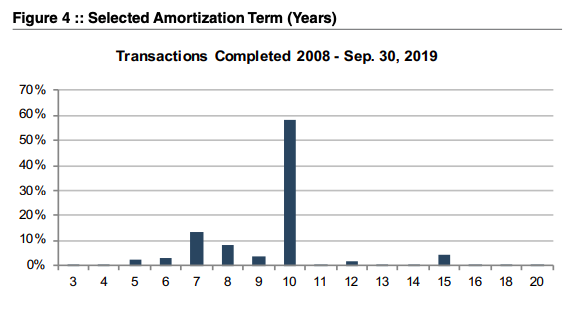
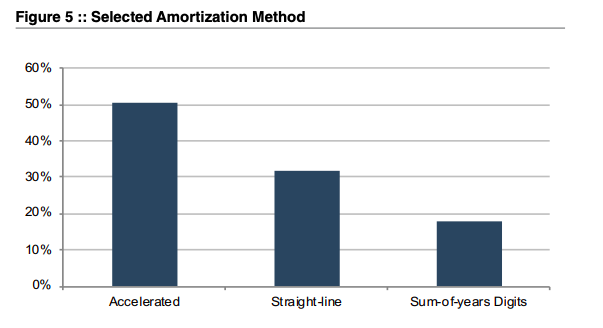
Based on the data for acquisitions for which core deposit intangible detail was reported, a majority of banks selected a ten-year amortization term for the CDI values booked. Less than 10% of transactions for which data was available selected amortization terms longer than ten years. Amortization methods were somewhat more varied, but an accelerated amortization method was selected in more than half of these transactions.
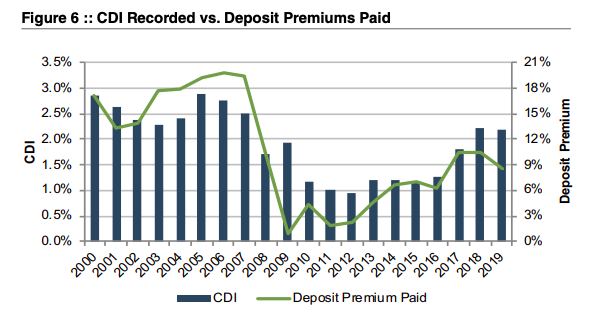
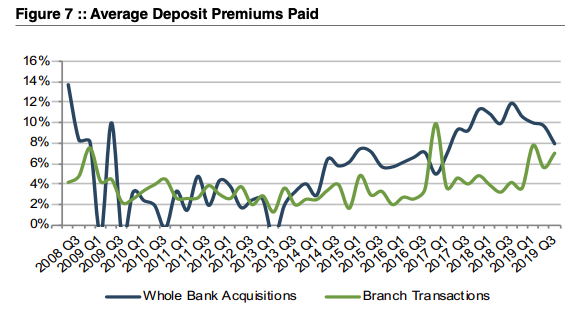
Core deposit intangible assets are related to, but not identical to, deposit premiums paid in acquisitions. While CDI assets are an intangible asset recorded in acquisitions to capture the value of the customer relationships the deposits represent, deposit premiums paid are a function of the purchase price of an acquisition. Deposit premiums in whole bank acquisitions are computed based on the excess of the purchase price over the target’s tangible book value, as a percentage of the core deposit base. While deposit premiums often capture the value to the acquirer of assuming the established funding source of the core deposit base (that is, the value of the deposit franchise), the purchase price also reflects factors unrelated to the deposit base, such as asset quality in the acquired loan base, unique synergy opportunities anticipated by the acquirer, etc. Any additional factors may influence the purchase price to an extent that the calculated deposit premium doesn’t necessarily bear a strong relationship to the value of the core deposit base to the acquirer. This influence is often less relevant in branch transactions where the deposit base is the primary driver of the transaction and the relationship between the purchase and the deposit base is more direct.
Deposit premiums paid in whole bank acquisitions have shown more volatility than CDI values. Despite improved deal values in recent years, current deposit premiums in the high single digits remain well below the pre-financial crisis levels when premiums for whole bank acquisitions averaged closer to 20%.
Deposit premiums paid in branch transactions have generally been less volatile than tangible book value premiums paid in whole bank acquisitions. Branch transaction deposit premiums have averaged in the 5.5%-7.5% range during 2019, up from the 2.0-4.0% range observed in the financial crisis, and have continued to rise in recent quarters in light of increasing deposit competition.
For more information about Mercer Capital’s core deposit valuation services, please contact us.
Originally published in Bank Watch, October 2019.
In our family law and commercial litigation practice, we often serve as expert witnesses in auto dealership valuation disputes. We hope you never find yourself a party to a legal dispute; however, we offer the following words of wisdom based upon our experience working in these valuation-related disputes. The following topics, posed as questions, have been points of contention or common issues that have arisen in recent disputes. We present them here so that if you are ever party to a dispute, you will be a more informed user of valuation and expert witness services.
Oftentimes, the financial and business valuation portion of a litigation is referred to as a “battle of the experts” because you have at least two valuation experts, one for the plaintiff and one for the defendant. In the auto dealer world, you are hopefully combining valuation expertise with a highly-specialized industry. It is critical to engage an expert who is both a valuation expert and an industry expert – one who holds valuation credentials and has deep valuation knowledge and also understands and employs accepted industry-specific valuation techniques. Look with caution upon valuation experts with minimal industry experience who utilize general valuation methodologies often reserved for other industries (for example, Discounted Cash Flow (DCF) or multiples of Earnings Before Interest, Taxes and Depreciation (EBITDA)) with no discussion of Blue Sky multiples.
The auto industry, like most industries, is dependent on the climate of the national economy. Additionally, auto dealers can be dependent or affected by conditions that are unique to their local economy. The type of franchise relative to the local demographics can also have a direct impact on the success/profitability of a particular auto dealer. For example, a luxury or high-line franchise in a smaller or poorer market would not be expected to fare as well as one in a market that has a larger and wealthier demographic.
In those areas that are dependent on a local economy/industry, an understanding of that economy/industry becomes just as important as an understanding of the overall auto dealer industry and national economy. Common examples are local markets that are home to a military base, oil & gas markets in Western Texas or natural gas in Pennsylvania, or fishing industries in coastal areas. There’s also a fine balance between understanding and acknowledging the impact of that local economy without overstating it. Often some of the risks of the local economy are already reflected in the historical operating results of the dealership.
Many of the corporate entities involved in litigation have sophisticated governance documents that include Operating Agreements, Buy-Sell Agreements, and the like. These documents often contain provisions to value the stock or entity through the use of a formula or process. Whether or not these agreements are to be relied upon in whole or in part in a litigated matter is not always clear. In litigated matters, focus will be placed on whether the value concluded from a governance document represents fair market value, fair value, or some other standard of value. However, the formulas contained in these agreements are not always specific to the industry and may not include accepted valuation methodology for auto dealers.
Two common questions that arise concerning these agreements are 1) has an indication of value ever been concluded using the governance document in the dealership’s history (in other words, has the dealership been valued using the methodology set out in the document)?; and 2) have there been any transactions, buy-ins or redemptions utilizing the values concluded in a governance document? These are important questions to consider when determining the appropriate weight to place on a value indication from a governance document.
Some litigation matters (such as divorce) state that the non-business party to the litigation is not bound by the value indicated by the governance document since they were not a signed party to that particular agreement. It is always important to discuss this issue with your attorney.
Similar to governance documents, another possible data point(s) in valuing an auto dealership are internal transactions. A good appraiser will always ask if there have been prior transactions of company stock and, if so, how many have occurred, when did they occur, and at what terms did they occur? There is no magic number, but as with most statistics, more transactions closer to the date of valuation can often be considered as better indicators of value than fewer transactions further from the date of valuation.
An important consideration in internal transactions is the motivation of the buyer and seller. If there have been multiple internal transactions, appraisers have to determine the appropriateness of which transactions to possibly include and which to possibly exclude in their determination of value. Without an understanding of the motivation of the parties and of the specific facts of the transactions, it becomes trickier to include some, but exclude others. The more logical conclusion would be to include all of the transactions or exclude all of the transactions with a stated explanation.
Most owners of an auto dealership have to submit personal financial statements as part of the guarantee on the floor plan and other financing. The personal financial statement includes a listing of all of the dealer’s assets and liabilities, typically including some value assigned to the value of the dealership. In litigated matters, these documents are important as another data point to valuation.
One view of the value placed on a dealership in an owner’s personal financial statement is that no formal valuation process was used to determine that number; so, at best, it’s a thumb in the air, blind estimate of value. The opposing view is the individual submitting the personal financial statement is attesting to the accuracy and reliability of the financial figures contained in document under penalty of perjury. Further, some would say that the value assigned to the dealership has merit because the business owner is the most informed person regarding the business, its future growth opportunities, competition, and the impact of economic and industry factors on the business.
For an appraiser, it’s not a good situation to be surprised by the existence of these documents. A good business appraiser will always ask for them. The dealership value indicated in a personal financial statement should be viewed in light of value indications under other methodologies and sources of information. At a minimum, personal financial statements may require the expert to ask more questions or use other factors, such as the national and local economy, to explain any difference in values over time.
The auto dealer industry is highly specialized and unique and should not be compared to general retail or manufacturing industries. As such, any sole comparison to general industry profitability data should be avoided.
If your appraiser solely uses the Annual Statement Studies provided by the Risk Management Association (RMA) as a source of comparison for the balance sheet and income statement of your dealership to the industry, this is problematic. RMA’s studies are organized by the North American Industry Classification System (NAICS). Typical new and used retail auto dealers would fall under NAICS #441110 or #441120. This general data does not distinguish between different franchises.
Is there better or more specialized data available? Yes, the National Automobile Dealers Association (NADA) publishes monthly Dealership Financial Profiles broken down by Average Dealerships, which would be comparable to RMA data. However, NADA drills down further, segmenting the industry into the four following categories: Domestic Dealerships, Import Dealerships, Luxury Dealerships and Mass Market Dealerships. While no single comparison is perfect, an appraiser should know to consult more specific industry profitability data when available.
Either through an income or Blue Sky approach, auto dealers are typically valued based upon expected profitability rather than the actual profitability of the business.
The difference between actual and expected profitability generally consists of normalization adjustments. Normalization adjustments are adjustments made for any unusual or non-recurring items that do not reflect normal business operations. During the due diligence interview with management, an appraiser should ask does the dealership have non-recurring or discretionary expenses and are personal expenses of the owner being paid by the business? Comparing the dealership to industry profitability data as discussed earlier can help the appraiser understand the degree to which the dealership may be underperforming.
An example of how normalizing adjustments work is helpful. If a dealership has historically reported 2% earnings before taxes (EBT) and the NADA data suggests 5%, the financial expert must analyze why there is a difference between these two data points and determine if there are normalizing adjustments to be applied. Let’s use some numbers to illustrate this point. For a dealership with revenue of $25 million, historical profitability at 2% would suggest EBT of $500,000. At 5%, expected EBT would be $1,250,000, or an increase of $750,000. In this case, the financial expert should analyze the financial statements and the dealership to determine if normalization adjustments are appropriate which, when made, will reflect a more realistic figure of the expected profitability of the dealership without non-recurring or personal owner expenses. This is important because, hypothetically, a new owner could optimize the business and eliminate some of these expenses; therefore, even dealerships with a history of negative or lower earnings can receive higher Blue Sky multiples because a buyer believes they can improve the performance of the dealership. However, as noted earlier, the dealership may be affected by the local economy and other issues that cannot be fixed so the lower historical EBT may be justified.
For more information on normalizing adjustments, see our article Automobile Dealership Valuation 101.
The valuation of automobile dealerships can be complex. A deep understanding of the industry along with valuation expertise is the optimal combination for general valuation needs and certainly for valuation-related disputes. If you have a valuation issue, feel free to contact us to discuss it in confidence.
Originally published in the Value Focus: Auto Dealer Industry Newsletter, Mid-Year 2019.
The medical device manufacturing industry produces equipment designed to diagnose and treat patients within global healthcare systems. Medical devices range from simple tongue depressors and bandages, to complex programmable pacemakers and sophisticated imaging systems. Major product categories include surgical implants and instruments, medical supplies, electro-medical equipment, in-vitro diagnostic equipment and reagents, irradiation apparatuses, and dental goods.
The following outlines five structural factors and trends that influence demand and supply of medical devices and related procedures.
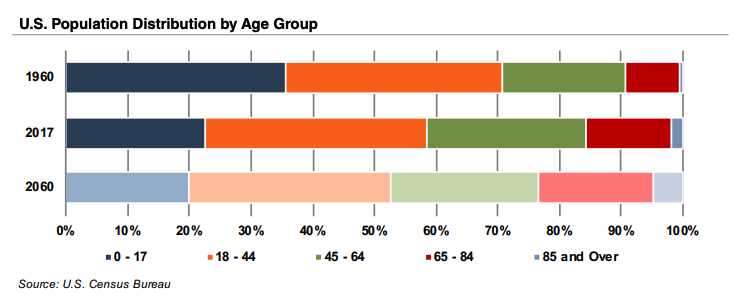
The aging population, driven by declining fertility rates and increasing life expectancy, represents a major demand driver for medical devices. The U.S. elderly population (persons aged 65 and above) totaled 49 million in 2016 (15% of the population). The U.S. Census Bureau estimates that the elderly will roughly double by 2060 to 95 million, representing 23% of the total population.
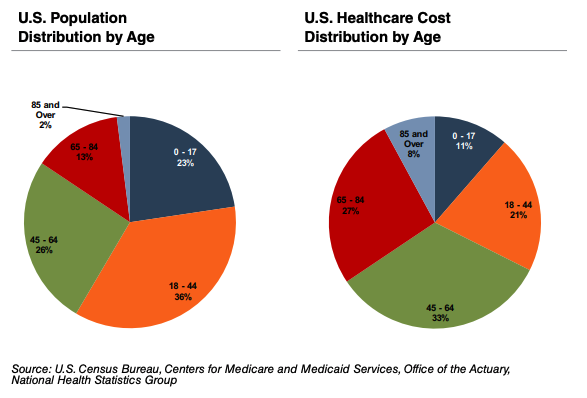
The elderly account for nearly one third of total healthcare consumption. Personal healthcare spending for the population segment was $19,000 per person in 2014, five times the spending per child ($3,700) and almost triple the spending per working-age person ($7,200).
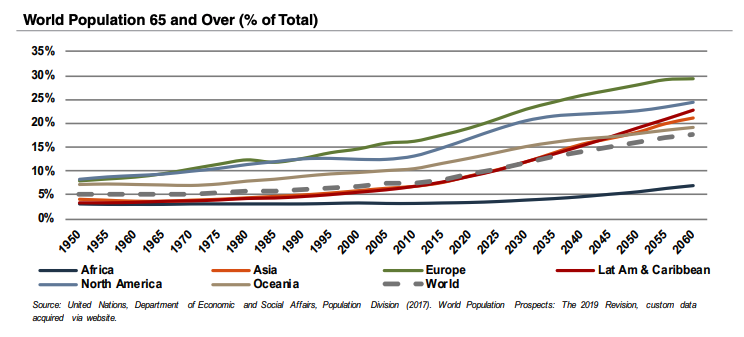
According to United Nations projections, the global elderly population will rise from approximately 607 million (8.2% of world population) in 2015 to 1.8 billion (17.8% of world population) in 2060. Europe’s elderly are projected to reach approximately 29% of the population by 2060, making it the world’s oldest region. While Latin America and Asia are currently relatively young, these regions are expected to undergo drastic transformations over the next several decades, with the elderly population expected to expand from less than 8% in 2015 to more than 21% of the total population by 2060.
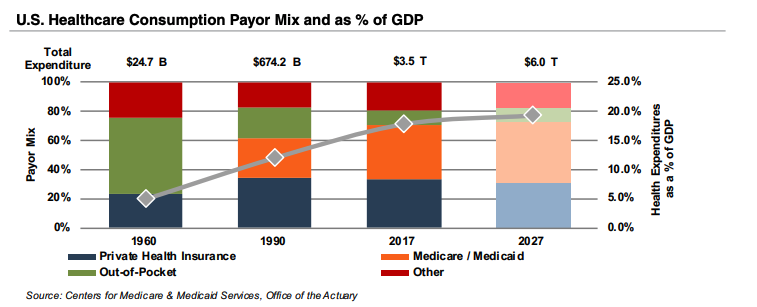
Demographic shifts underlie the expected growth in total U.S. healthcare expenditure from $3.5 trillion in 2017 to $6.0 trillion in 2027, an average annual growth rate of 5.5%. While this projected average annual growth rate is more modest than that of 7.0% observed from 1990 through 2007, it is more rapid than the observed rate of 4.3% between 2008 and 2017. Projected growth in annual spending for Medicare (7.9%) is expected to contribute substantially to the increase in national health expenditure over the coming decade. Healthcare spending as a percentage of GDP is expected to expand from 17.9% in 2017 to 19.4% by 2027.
Since inception, Medicare has accounted for an increasing proportion of total U.S. healthcare expenditures. Medicare currently provides healthcare benefits for an estimated 60 million elderly and disabled people, constituting approximately 15% of the federal budget in 2018. Medicare represents the largest portion of total healthcare costs, constituting 20% of total health spending in 2017. Medicare also accounts for 25% of hospital spending, 30% of retail prescription drugs sales, and 23% of physician services.
Owing to the growing influence of Medicare in aggregate healthcare consumption, legislative developments can have a potentially outsized effect on the demand and pricing for medical products and services. Net mandatory benefit outlays (gross outlays less offsetting receipts) to Medicare totaled $591 billion in 2017, and are expected to reach $1.3 trillion by 2028.
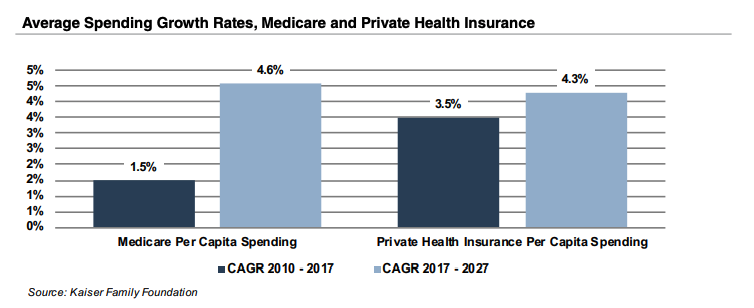
The Patient Protection and Affordable Care Act (“ACA”) of 2010 incorporated changes that are expected to constrain annual growth in Medicare spending over the next several decades, including reductions in Medicare payments to plans and providers, increased revenues, and new delivery system reforms that aim to improve efficiency and quality of patient care and reduce costs. On a per person basis, Medicare spending is projected to grow at 4.6% annually between 2017 and 2027, compared to 1.5% average annualized growth realized between 2010 and 2017, and 7.3% during the 2000s.
As part of ACA legislation, a 2.3% excise tax was imposed on certain medical devices for sales by manufacturers, producers, or importers. The tax had become effective on December 31, 2012, but met resistance from industry participants and policy makers. In late 2015, Congress passed legislation promulgating a two-year moratorium on the tax beginning January 2016. In January 2018, the moratorium suspending the medical device excise tax was extended through 2019.
The primary customers of medical device companies are physicians (and/or product approval committees at their hospitals), who select the appropriate equipment for consumers (patients). In most developed economies, the consumers themselves are one (or more) step removed from interactions with manufacturers, and therefore pricing of medical devices. Device manufacturers ultimately receive payments from insurers, who usually reimburse healthcare providers for routine procedures (rather than for specific components like the devices used). Accordingly, medical device purchasing decisions tend to be largely disconnected from price.
Third-party payors (both private and government programs) are keen to reevaluate their payment policies to constrain rising healthcare costs. Several elements of the ACA are expected to limit reimbursement growth for hospitals, which form the largest market for medical devices. Lower reimbursement growth will likely persuade hospitals to scrutinize medical purchases by adopting i) higher standards to evaluate the benefits of new procedures and devices, and ii) a more disciplined price bargaining stance.

The transition of the healthcare delivery paradigm from fee-for-service (FFS) to value models is expected to lead to fewer hospital admissions and procedures, given the focus on cost-cutting and efficiency. In 2015, the Department of Health and Human Services (HHS) announced goals to have 85% and 90% of all Medicare payments tied to quality or value by 2016 and 2018, respectively, and 30% and 50% of total Medicare payments tied to alternative payment models (APM) by the end of 2016 and 2018, respectively. A report issued by the Health Care Payment Learning & Action Network (LAN), a public-private partnership launched in March 2015 by HHS, found that 34% of payments were tied to APMs, a 5% increase from 2016 to 2017.
Some expressed concern that the shift toward value-based care would encounter difficulties with the current administration. In November 2017, the CMS partially canceled bundled payment programs for certain joint replacement and cardiac rehabilitation procedures. However, indications are that the CMS supports value-based care and wants pilot programs to accelerate. Ultimately, lower reimbursement rates and reduced procedure volume will likely limit pricing gains for medical devices and equipment.
The medical device industry faces similar reimbursement issues globally, as the EU and other jurisdictions face increasing healthcare costs, as well. A number of countries have instituted price ceilings on certain medical procedures, which could deflate the reimbursement rates of third-party payors, forcing down product prices. Industry participants are required to report manufacturing costs and medical device reimbursement rates are set potentially below those figures in certain major markets like Germany, France, Japan, Taiwan, Korea, China, and Brazil. Whether third-party payors consider certain devices medically reasonable or necessary for operations presents a hurdle that device makers and manufacturers must overcome in bringing their devices to market.
Historically, much of the growth for medical technology companies has been predicated on continual product innovations that make devices easier for doctors to use and improve health outcomes for the patients. Successful product development usually requires significant R&D outlays and a measure of luck. However, viable new devices can elevate average selling prices, market penetration, and market share.
Government regulations curb competition in two ways to foster an environment where firms may realize an acceptable level of returns on their R&D investments. First, firms that are first to the market with a new product can benefit from patents and intellectual property protection giving them a competitive advantage for a finite period. Second, regulations govern medical device design and development, preclinical and clinical testing, premarket clearance or approval, registration and listing, manufacturing, labeling, storage, advertising and promotions, sales and distribution, export and import, and post market surveillance.
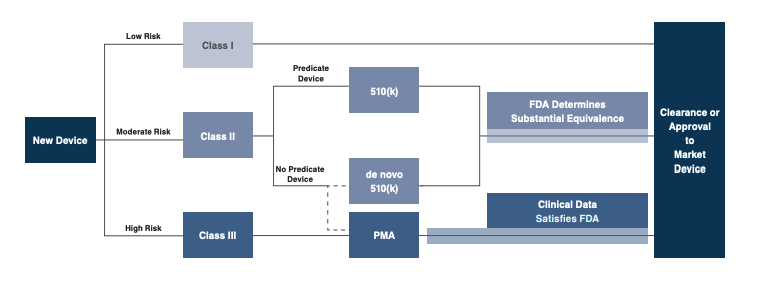
In the U.S., the FDA generally oversees the implementation of the second set of regulations. Some relatively simple devices deemed to pose low risk are exempt from the FDA’s clearance requirement and can be marketed in the U.S. without prior authorization. For the remaining devices, commercial distribution requires marketing authorization from the FDA, which comes in primarily two flavors.
Pursuant to the Medical Device User Fee Modernization Act (MDUFA), the FDA collects user fees for the review of devices for marketing clearance or approval. The current iteration of the Medical Device User Fee Act (MDUFA IV) came into effect in October 2017. Under MDUFA IV, the FDA is authorized to collect almost $1 billion in user fees, an increase of more than $320 million over MDUFA III, between 2017 and 2022.
The European Union (EU), along with countries such as Japan, Canada, and Australia all operate strict regulatory regimes similar to that of the FDA, and international consensus is moving towards more stringent regulations. Stricter regulations for new devices may slow release dates and may negatively affect companies within the industry.
Medical device manufacturers face a single regulatory body across the EU. In order for a medical device to be allowed on the market, it must meet the requirements set by the EU Medical Devices Directive. Devices must receive a Conformité Européenne (CE) Mark certificate before they are allowed to be sold in that market. This CE marking verifies that a device meets all regulatory requirements, including EU safety standards. A set of different directives apply to different types of devices, potentially increasing the complexity and cost of compliance.
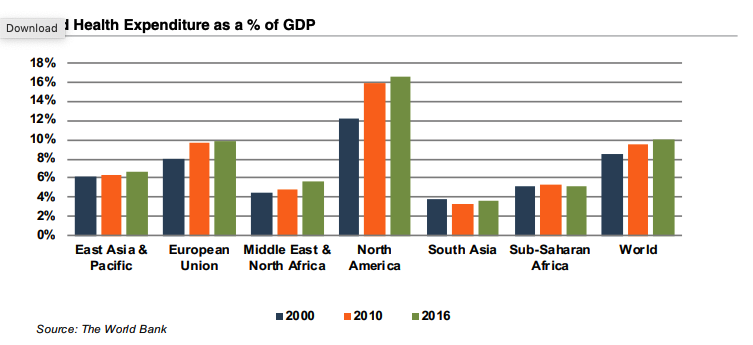
Emerging economies are claiming a growing share of global healthcare consumption, including medical devices and related procedures, owing to relative economic prosperity, growing medical awareness, and increasing (and increasingly aging) populations. As global health expenditure continues to increase, sales to countries outside the U.S. represent a potential avenue for growth for domestic medical device companies. According to the World Bank, all regions (except Sub-Saharan Africa and South Asia) have seen an increase in healthcare spending as a percentage of total output over the last two decades.
Global medical devices sales are estimated to increase 6.4% annually from 2016 to 2020, reaching nearly $440 billion according to the International Trade Administration. While the Americas are projected to remain the world’s largest medical device market, the Asia/Pacific and Western Europe markets are expected to expand at a quicker pace over the next several years.

Demographic shifts underlie the long-term market opportunity for medical device manufacturers. While efforts to control costs on the part of the government insurer in the U.S. may limit future pricing growth for incumbent products, a growing global market provides domestic device manufacturers with an opportunity to broaden and diversify their geographic revenue base. Developing new products and procedures is risky and usually more resource intensive compared to some other growth sectors of the economy. However, barriers to entry in the form of existing regulations provide a measure of relief from competition, especially for newly developed products.
The August 2019 BankWatch described key considerations in analyzing the financial statements of banks. However, we did not address one crucial set of relationships – those between a bank holding company (“BHC”) and its subsidiary depository institution.
Most banks are owned by bank holding companies. While investors often state that they own an interest in a bank, this may not be legally precise. Usually, they own a share of stock in a bank holding company, which in turn owns a controlling interest in a subsidiary bank’s common stock. Where a bank holding company exists, this entity’s common stock generally is the subject of valuation analyses.
Part 3 of the Community Bank Valuation series explores important relationships between banks and their holding companies, focusing particularly on cash flow and leverage.
Compared to a bank’s balance sheet, a holding company’s balance sheet has fewer moving parts. The “left side” of its balance sheet, or its assets, usually is rather boring. The more intriguing analytical question, though, is how the bank holding company finances its investment in the bank. The following table presents a balance sheet for a BHC controlling 100% of the common stock of a bank with $500 million of total assets.
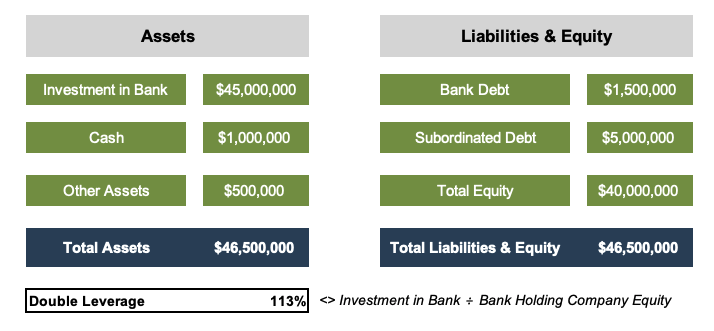
Usually, the holding company’s assets consist virtually entirely of its investment in its subsidiary bank or banks, which equals the bank’s total equity. The investment in the bank is carried at equity, meaning that it increases by the bank’s net income and decreases by dividends paid from the bank to the holding company, among other transactions. Other material assets may include:
Interestingly, BHCs can borrow from banks – just not their bank subsidiary – and other capital providers. If the funds are downstreamed into the bank, the borrowings can be transformed from an instrument not includible in the BHC’s regulatory capital into Tier 1 capital at the bank. In order of seniority these funding sources include:
A BHC’s equity usually consists almost entirely of common stock, which generally must be the principal form of capitalization under BHC regulations. However, BHCs can issue preferred stock, and regulations view most favorably non-cumulative, perpetual preferred stock.
Why do holding companies exist? First, they provide an efficient way to raise funds that can be injected as capital into the bank, thereby accommodating its organic growth. Second, they can facilitate acquisitions. Third, BHCs can more efficiently conduct shareholder transactions, such as repurchases.
By using leverage, a BHC can enhance the bank’s stand-alone return on equity (or exacerbate the ROE pressure arising from adverse financial scenarios). As indicated in Table 2, BHC leverage magnifies the subsidiary bank’s 12.0% ROE to 12.9% after considering the cost of the BHC’s debt.
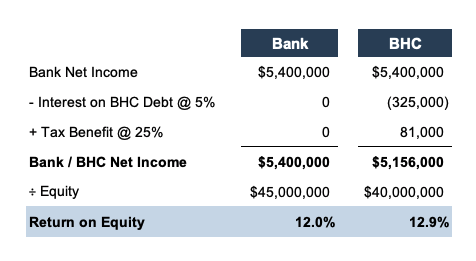
As for a non-financial company, too much leverage can mean that the beneficial effect to shareholders of a higher ROE is swamped by the additional risk of financial distress. Various metrics exist to measure the holding company’s leverage, but one is the “double leverage” ratio, which is calculated as the investment in the bank subsidiary divided by the BHC’s equity. As indicated in Table 1 on page one, the BHC’s ratio is 113%, which is consistent with the median reported by all smaller BHCs at June 30, 2019 (112%, excluding some BHCs for which the BHC’s equity exceeds the bank investment).
Unfortunately, BHC regulatory filings and audited financial statements do not provide a sources and uses of funds schedule, although some cash flow data is provided. Nevertheless, understanding the BHC’s obligations, and the cash required to service those obligations, is essential.
Sources of funds consist principally of the following:
Uses of funds include the following:
Analysts should compare a bank’s ability to pay dividends, given its profitability level and need to retain earnings to fund its growth, against the BHC’s various claims on cash. Mismatches can sometimes arise due to changes in the bank’s performance or operating strategy. For example, consider a BHC that historically has paid high dividends to shareholders. If its subsidiary bank adopts a new strategic plan focused on organic growth, then the bank will need to retain earnings rather than pay dividends to the BHC and, ultimately, BHC shareholders. Additional borrowings could fund a short-term gap, but this is not a long-term solution to a BHC cash flow mismatch.
Two other special circumstances arise when analyzing BHC cash flow:
Capital requirements for BHCs vary based upon their asset size. Under current regulations, BHCs with assets below $3.0 billion are subject to the Federal Reserve’s Small Bank Holding Company Policy Statement. This regulation does not establish any specific minimum capital ratios for small BHCs; however, a debt/ equity ratio limitation exists for debt arising from acquisitions. Therefore, small BHCs have significant flexibility in managing their capital structure, although the Federal Reserve theoretically remains a check on their creativity.
Large BHCs are subject to the Basel III regulations, which involve capital ratios calculated based on Tier 1 and total capital. Tier 1 capital generally is limited to common equity, non-cumulative perpetual preferred stock, and grandfathered TruPS. In addition to the allowance for loan losses, Tier 2 capital may include subordinated debt. Large BHC management can balance these capital sources to minimize the BHC’s weighted average cost of capital, maintain flexibility for unexpected events or opportunities, and ensure compliance with regulatory expectations.
While the subsidiary bank receives most of the analytical attention, the holding company on a standalone (or parent company) basis should not be overlooked. This is particularly true if the holding company has significant obligations to service debt or pay other expenses. By understanding the linkages between the bank and holding company, analysts can better assess a BHC’s potential future returns to shareholders and risk factors posed by the BHC that could jeopardize those returns.
Originally published in Bank Watch, September 2019.
In last quarter’s issue of Portfolio Valuation we raised the issue as to whether public market investors are more critical (or discerning) in establishing value than private equity investors. The evidence this year largely is, yes—at least for companies where there is skepticism as to whether meaningful profitability can be achieved.
Lyft, SmileDirectClub and Uber are examples of unicorns that saw share prices marked sharply lower after the IPO (Lyft, SDC) or during the roadshow (Uber); and The We Company’s planned IPO never occurred due to pushback by investors. At the other extreme is Beyond Meat, which as of early October had risen about six-fold from its May IPO.
The We Company’s (formerly “WeWork” and will be refered to in this article as WeWork) valuation journey is interesting (maybe even fascinating).
WeWork, which was founded in 2010, is a real estate company that signs long-term leases for pricey real estate that it refurbishes then releases the space short-term. The company describes itself somewhat differently as a “community company committed to maximum global impact.”
The S-1 disclosed not only massive losses, but also significant corporate governance issues. Year-to-date revenues through June 30, 2019 doubled to $1.5 billion from the comparable period in 2018, but the operating loss also doubled to $1.4 billion. EBITDA for the six months was negative $511 million, while capex totaled $1.3 billion.
That is a big hole to fill every six months before factoring in rapid growth to be financed. Cash as of June 30 totaled $2.5 billion, while the capital structure entails a lot of debt and negative equity.
From a valuation perspective, WeWork is problematic because operating cash flows are deep in the red with little prospect of turning positive anytime soon. Nonetheless, the increase in value private equity investors placed on the company was astounding.
The company pierced the unicorn threshold in early 2014 when affiliates of JPMorgan invested $150 million in the fourth funding at a post-raise $1.5 billion valuation. T. Rowe Price and Goldman Sachs invested $434 million in late 2014, which resulted in a post raise valuation of $10 billion.
The 7th and 8th funding rounds are where the valuation really gets interesting. In August 2017 SoftBank Vision Fund invested $3.1 billion, which implied a valuation of $21 billion. SoftBank Group Corp., which sponsors the Vision Fund, invested $4.0 billion in January 2019 at an implied valuation of $47 billion.
When the underwriters were forced to pull the plug on the IPO the targeted post-raise valuation reportedly was $10 billion to $15 billion—a value the company apparently was willing to accept because it needs the cash.
We do not know exactly how private equity investors valued the company. Presumably discounted cash flow (DCF), guideline public company and guideline transaction methods were used, perhaps overlaid with a Monte Carlo simulation.
The valuation history raises an important question: how was a stupendous valuation achieved in the private markets by a cash incinerator such as WeWork? A similar question could be asked about many high-profile PE-backed investments.
The short answer is that Softbank thinks the valuation increased significantly even though the company’s fundamentals argue otherwise.
Prospective investors such as the public ones who were offered WeWork shares in an IPO could prepare their own DCF forecast to value the company. They also could examine past transactions in the company for relevant valuation information.
Likewise, they could examine capital transactions in similar companies. Both sets of data fall under the guideline transaction method.
A transaction in a privately held company infers a meaningful data point about value to investors, but there are a couple of caveats. One is an assumption that both parties are fully-informed and neither is forced to transact. Great values were realized by those willing to buy during the 2008 meltdown because there were so many forced sellers that ran the gamut from levered credit investors forced to dump bonds to the likes of Wachovia Corporation and National City Corporation. The price data was legitimate, but many sellers faced margin calls and had to dump assets into an illiquid market. Is the valuation data relevant if “normal” market conditions prevail?
The second issue relates to private equity valuation generally, but especially those where start-up losses and ongoing capital requirements can be huge. The valuation issue relates to using transaction data from investments in other money losing enterprises. Is it always valid to apply multiples paid by investors in a funding round of a money-losing business to value another money-losing business? The valuation data may be factual, but it may be nonsense when weighed against the business’ operating and financial performance.
One can question Softbank’s motives. Did Softbank need a higher valuation to offset losses in other parts of the portfolio in order to maintain investor and lender confidence? Was a higher valuation necessary to support upcoming capital raises? We do not know, but prospective public investors were dismissive of Softbank’s valuations and they appear to be dismissive of the prior two raises given how low the price talk had fallen by the time the IPO was pulled.
We at Mercer Capital respect markets and the pricing information that is conveyed. The prices at which assets transact in private and public markets are critical observations; however, so too are a subject company’s underlying fundamentals, especially the ability to produce positive operating cash flow and a return on capital that at least approximates the cost of capital provided.
Mercer Capital can assist with the valuation of your portfolio companies. We value hundreds of debt and equity securities of privately held companies every year and have been doing so for nearly four decades. Please call if we can assist in the valuation of your portfolio companies.
Originally published in Portfolio Valuation Newsletter, October 2019.
In contested divorces where one or both spouses own a business or a business interest with significant value, it is common for one or both parties to retain a business appraiser to value the marital business interest(s). It is not unusual for the valuation conclusions of the two appraisers to differ significantly, with one significantly lower/higher than the other.
What is a client, attorney, or judge to think when significantly different valuation conclusions are present? The answer to the reasonableness of one or both conclusions lies in the reasonableness of the appraisers’ assumptions. However, valuation is more than “proving” that each and every assumption is reasonable. Valuation also involves proving the overall reasonableness of an appraiser’s conclusion.
A short example will illustrate this point and then we can address the issue of individual assumptions. In the following example, we see three potential discount rates and resulting price/earnings (“P/E”) multiples. Let’s assume that for the subject company in this example, there is significant market evidence suggesting that similar companies trade at a P/E in the neighborhood of 10x earnings.
In the figure below, we look at the assumptions used by appraisers to “build” discount rates. We show differing assumptions regarding four of the components, and none of the differing assumptions seems to be too far from the others. So, we vary what are called the equity risk premium (“ERP”), the beta statistic, which is a measure of riskiness, the small stock premium (“SSP”), and company-specific risk.
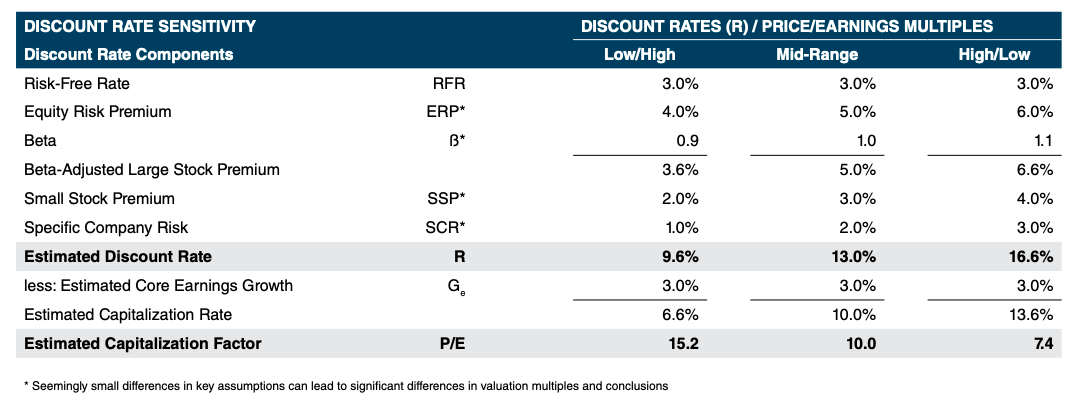
The left column (showing the low discount rate of 9.6% and a high P/E multiple of 15.2x) would yield the highest valuation conclusion. The right column (showing the high discount rateof 16.6% and the low P/E of 7.4x) would yield a substantially lower conclusion. That range is substantial and results in widely differing conclusions.
However, as stated earlier, market evidence suggests that companies like our example are worth in the range of a 10x earnings. In our example, the assumptions leading to a P/E in the range of 10x are found in the middle column.
In either case, appraisers might have made a seemingly convincing argument that each of their assumptions were reasonable and, therefore, that their conclusions were reasonable. However, the proof is in the pudding. Neither the low nor the high examples yield reasonable conclusions when viewed in light of available market evidence.
So, as we discuss how to understand the reasonableness of individual valuation assumptions in divorce-related business appraisals, know also that the valuation conclusions must themselves be proven to be reasonable. That’s why we place a “test of reasonableness” in every Mercer Capital valuation report that reaches a valuation conclusion.
Now, we turn to individual assumptions.
Growth rates can impact a valuation in several ways. First, growth rates can explain historical or future changes in revenues, earnings, profitability, etc. A long-term growth rate is also a key assumption in determining a discount rate and resulting capitalization rate.
Growth rates, as a measure of historical or future change in performance, should be explained by the events that have occurred or are expected to occur. In other words, an appraiser should be able to explain the specific events that led to a certain growth rate, both in historical financial statements and also in forecasts. Companies experiencing large growth rates from one year to the next should be able to explain the trends that led to the large changes, whether it is new customers, new products being offered, loss of a competitor, an early-stage company ramping up, or other pertinent factors. Large growth rates for an extended period of time should always be questioned by the appraiser as to their sustainability at those heightened levels.
A long-term growth rate is an assumption utilized by all appraisers in a capitalization rate. The long-term growth rate should estimate the annual, sustainable growth that the company expects to achieve. Typically, this assumption is based on a long-term inflation factor plus/minus a few percentage points. Be mindful of any very small, negative, or large long-term growth rate assumptions. If confronted with one, what are the specific reasons for those extreme assumptions?
In the course of a business valuation, appraisers normally examine the financial performance of a company for a historical period of around five years, if available. Since business valuations are point-in-time estimates, the date of valuation may not always coincide with a company’s annual reporting period.
Most companies have financial software with the capability to produce a trailing twelve month (“TTM”) financial statement. A TTM financial statement allows an appraiser to examine a fullyear business cycle and is not as influenced by seasonality or cyclicality of operations and performance during partial fiscal years. The balance sheet may still reflect some seasonality or cyclicality. Note if the appraiser annualizes a short portion of a fiscal year to estimate an annual result. This practice could result in inflating or deflating expected results if there is significant seasonality or cyclicality present. At the very least, the annualized results should be compared with historical and expected future results in terms of implied margins and growth.
Depending on the industry or where the company is in its business life cycle, a forecast may be used in the valuation and the discounted cash flow method (“DCF”) may be used.
Most forecasts are provided to appraisers by company management. While appraisers do not audit financial information provided by companies, including forecasts, the results should not be blindly accepted without verification against the company’s and its industry’s performance.
During the due diligence process, appraisers should ask management if they prepare multiple versions of forecasts. They should also ask for prior years’ forecasts in order to assess how successful management has been in estimations as compared to actual financial results. Be mindful of appraisers that compile the forecasts themselves and make sure there is some discussion of the underlying assumptions.
“Divorce recession” is a term to describe a phenomenon that sometimes occurs when a business owner portrays doom and gloom in their industry and for current and future financial performance of the company. As with other assumptions, an appraiser should not blindly accept this outlook.
An appraiser should compare the performance of the company against its historical trends, future outlook, and the condition of the industry and economy, among other factors. Be cautious of an appraisal where the current year or ongoing expectations are substantially lower, or higher for that matter, than historical performance without a tangible explanation as to why.
Most formal business valuations should include a narrative describing the current and expected future conditions of the subject company’s industry. An important discussion is how those factors specifically affect the company. There could be reasons why the company’s market is experiencing things differently than the national industry. Industry conditions can provide qualitative reasons why and how the quantitative numbers for the company are changing. Look carefully at business valuations that do not discuss industry conditions or those where the industry conditions are contrary to the company’s trends.
Certain industries have specific valuation methodologies and techniques that are used in addition to general valuation methodologies. Several of these industries include auto dealers, banks, healthcare and medical practices, hotels, and holding companies. It may be difficult for a layperson reviewing a business valuation to know whether the methods employed are general or industry-specific techniques. An attorney or business owner should ask the appraiser how much experience they have performing valuations in a particular industry. Also inquire if there are industry-specific valuation techniques used and how those affect the valuation conclusion.
Risk factors are all of the qualitative and quantitative factors that affect the expected future performance of a company. Simply put, a business valuation combines the expected financial performance of the subject company (earnings and growth) and its risk factors. Risk factors show up as part of the discount rate utilized in the business valuation.
Like growth rates, there is no textbook that lists the appropriate risk factors for a particular industry or company. However, there is a reasonable range for this assumption.
Be careful of appraisals that have an extreme figure for risk factors. Make sure there is a clear explanation for the heightened risk.
Another typical component of a business valuation is the comparison and use of market multiples while utilizing the market approach. Multiples can explain value through revenues, profits, or a variety of performance measures. One critique of market multiples is the applicability of the comparable companies used to determine the multiples. Are those companies truly comparable to the subject company?
Also, how reliable is the underlying comparable company data? Is it dated? How much information on the comparable companies or transactions can be extracted from the source? This critique can be fairly subjective to the layperson.
Another critique could be the range of multiples examined and how they are applied to the subject company. As we have discussed, take note of an appraisal that applies the extreme bottom or top end of the range of multiples, or perhaps even a multiple not in the range. Be prepared to discuss the multiple selected and how the subject company compares to the comparable companies selected.
Earlier we stated that a typical appraisal provides the prior five years of the company’s financial performance, if available. Be cautious of appraisals that use a small sample size, e.g. the latest year’s results, as an estimate of the subject company’s ongoing earnings potential without explanation. The number of years examined should be discussed and an explanation as to why certain years were considered or not considered should be offered.
Some industries have multi-year cycles (further evidence of the importance of a discussion of industry conditions and consideration of recognized industry-specific techniques in the appraisal).
The examination of one year or a few years (instead of five years) can result in a much higher or lower valuation conclusion. If this is the case, it should be explained.
Business valuation is a technical analysis of methodologies used to arrive at a conclusion of value for a subject company. It can be difficult for a client, attorney, or judge to understand the impact of certain individual assumptions and whether or not those assumptions are reasonable. In addition to a review of individual assumptions, the valuation conclusion should be reasonable.
If the divorce case warrants, hire an appraiser to perform a business valuation. If the case or budget does not allow for a formal valuation, it may be helpful to hire an appraiser to review another appraiser’s business valuation at a minimum to help determine if the assumptions and conclusions are reasonable.
Originally published in Mercer Capital’s Tennessee Family Law Newsletter, Second Quarter 2019.
The June BankWatch featured the first part of a series describing key considerations in the valuation of banks and bank holding companies. While that installment provided a general overview of key concepts, this month we pivot to the analysis of bank financial statements and performance.1 Unlike many privately held, less regulated companies, banks produce reams of financial reports covering every minutia of their operations. For analytical personality types, it’s a dream.
The approach taken to analyze a bank’s performance, though, must recognize depositories’ unique nature, relative to non-financial companies. Differences between banks and non-financial companies include:
Why do banks seek to acquire deposits? First, all earning assets must be funded; otherwise, the balance sheet would fail to balance. Ergo, more deposits allow for more earning assets. Second, retail deposits tend to cost less than other alternative sources of funds. Banks have access to wholesale funding sources, such as brokered deposits and Federal Home Loan Bank advances, but these generally have higher interest rates than retail deposits. Third, retail deposits are stable, due to the relationship existing between the bank and customer. This provides assurance to bank managers, investors, and regulators that a disruption to a wholesale funding source will not trigger a liquidity shortfall. Fourth, deposits provide a vehicle to generate noninterest income, such as service charges or interchange. The strength of a bank’s deposit portfolio, such as the proportion of noninterest-bearing deposits, therefore influences its overall profitability and franchise value.
Capital adequacy requirements have several influences on banks. Most importantly, failing to meet minimum capital ratios leads to severe repercussions, such as limitations on dividends and stricter regulatory oversight, and is (as you may imagine) deleterious to shareholder value. More subtly, capital requirements influence asset pricing decisions and balance sheet structure. That is, if two assets have the same interest rate but different risk weights, the value maximizing bank would seek to hold the asset with the lower risk weight. Stated differently, if a bank targets a specific return on equity, then the bank can accept a lower interest rate on an asset with a smaller risk weight and still achieve its overall return on equity objectives.
We now cover several components of a bank’s balance sheet.
Banks are, by their nature, engaged in liquidity transformation, whereby funds that can be withdrawn on demand (deposits) are converted into illiquid assets (loans). Several alternatives exist to mitigate the risk associated with this liquidity transformation, but one universal approach is maintaining a portfolio of on-balance sheet liquid assets. Additionally, banks maintain securities as a source of earning assets, particularly when loan demand is relatively limited.
Liquid assets generally consist of highly-rated securities issued by the U.S. Treasury, various governmental agencies, and state and local governments, as well as various types of mortgage-backed securities. Relative to loans, banks trade off some yield for the liquidity and credit quality of securities. Key analytical considerations include:
A typical bank generates most of its revenue from interest income generated by the loan portfolio; further, the lending function presents significant risk in the event borrowers fail to perform under the contractual loan terms. While loans are more lucrative than securities from a yield standpoint, the cost of originating and servicing a loan portfolio – such as lender compensation – can be significant. Key analytical considerations include:
Banks maintain reserves against loans that have defaulted or may default in the future. While a new regime for determining the ALLL will be implemented beginning for some banks in 2020, the size of the ALLL under current and future accounting standards generally varies between banks based on (a) portfolio size, (b) portfolio composition, as certain loan types inherently possess greater risk of credit loss, (c) the level of problem or impaired loans, and (d) management’s judgment as to an appropriate ALLL level. Calculating the ALLL necessarily includes some qualitative inputs, such as regarding the outlook for the economy and business conditions, and reasonable bankers can disagree about an appropriate ALLL level. Key analytical considerations regarding the ALLL and overall asset quality include:
As for loans, bank financial statements distinguish several deposit types, such as demand deposits and CDs. It is useful to decompose deposits further into retail (local customers) and wholesale (institutional) deposits. Key analytical considerations include:
Historical changes in equity cannot be understood without an equity roll-forward showing changes due to retained earnings, share sales and redemptions, dividends, and other factors. In our opinion, it is crucial to analyze the bank’s current equity position by reference to management’s business plan, as this will reveal amounts available for use proactively to generate shareholder returns (such as dividends, share repurchases, or acquisitions). Alternatively, the analysis may reveal the necessity of either augmenting equity through a stock offering or curtailing growth objectives.
The computation of regulatory capital metrics can be obtained from a bank’s regulatory filings. Relative to shareholders’ equity, regulatory capital calculations: (a) exclude most intangible assets and certain deferred tax assets, and (b) include certain types of preferred stock and debt, as well as the ALLL, up to certain limits.
There are six primary components of the bank’s income statement:
The previous analysis of the balance sheet foreshadowed this net interest income discussion with one important omission – the external interest rate environment. While banks attempt to mitigate the effect on performance of uncontrollable factors like market interest rates, some influence is unavoidable. For example, steeper yield curves generally are more accommodative to net interest income, while banks struggle with flat or inverted yield curves.
Another critical financial metric is the net interest margin (“NIM”), measured as the yield on all earning assets minus the cost of funding those assets (or net interest income divided by earning assets). The NIM and net interest income are influenced by the following:
The sensitivity of net interest income to uncontrollable forces – i.e., market interest rates – makes noninterest income attractive to bankers and investors. Banks generate noninterest income from a panoply of sources, including:
Some sources of revenue can be even more sensitive to the interest rate environment than net interest income, such as income from residential mortgage originations. Yet other sources have their own linkages to uncontrollable market factors, such as revenues from wealth management activities tied to the market value of account assets.
Expanding noninterest income is a holy grail in the banking industry, given limited capital requirements, revenue diversification benefits, and its ability to mitigate interest rate risk while avoiding credit risk. However, many banks’ fee income dreams have foundered on the rocks of reality for several reasons. First, achieving scale is difficult. Second, cross-sales of fee income products to banking customers are challenging. Third, significant cultural differences exist between, say, wealth management and banking operations. A fulsome financial analysis considers the opportunities, challenges, and risks presented by noninterest income.
In a mature business like banking, expense control always remains a priority.
We covered this income statement component previously with respect to the ALLL.
Banks generally report effective tax rates (or actual income tax expense divided by pre-tax income) below their marginal tax rates. This primarily reflects banks’ tax-exempt investments, such as municipal bonds; bank-owned life insurance income; and vehicles that provide for tax credits, like New Market Tax Credits. It is important to note that state tax regimes may differ for banks and non-banks. For example, some states assess taxes on deposits or equity, rather than income, and such taxes are not reported as income tax expense.
As the preceding discussion suggests, many levers exist to achieve shareholder returns. One bank can operate with lean expenses, but pay higher deposit interest rates (diminishing its NIM) and deemphasize noninterest income. Another bank may pursue a true retail banking model with low cost deposits and higher fee income, offset by the attendant operating costs. There is not necessarily a single correct strategy. Different market niches have divergent needs, and management teams have varying areas of expertise. However, we still can compare the returns on equity (or net income divided by shareholders’ equity) generated by different banks to assess their relative performance.
The figure below presents one way to decompose a bank’s return on equity relative to its peer group. This bank generates a higher return on equity than its peer group due to (a) a higher net interest margin, (b) a slightly lower loan loss provision, and (c) higher leverage (shown as the “equity multiplier” in the table).
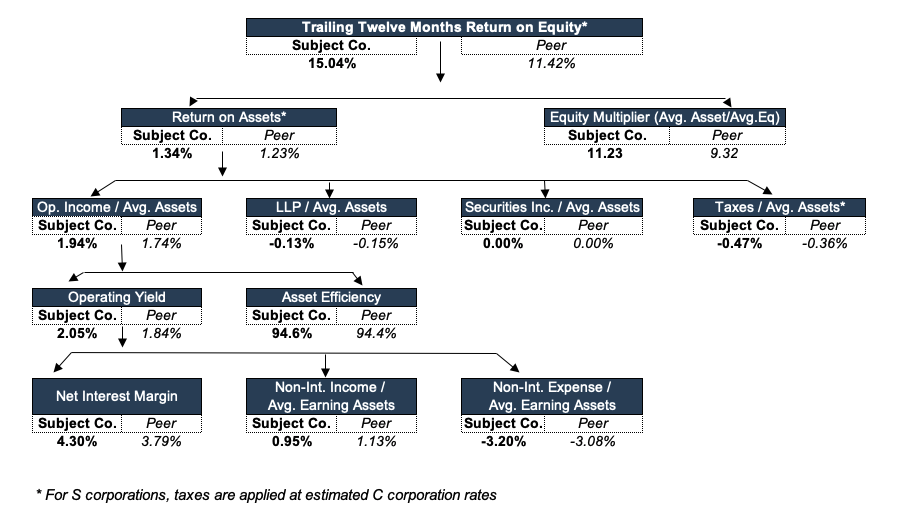
The figure below cites several common income statement metrics used by investors, as well as their strengths and shortcomings.
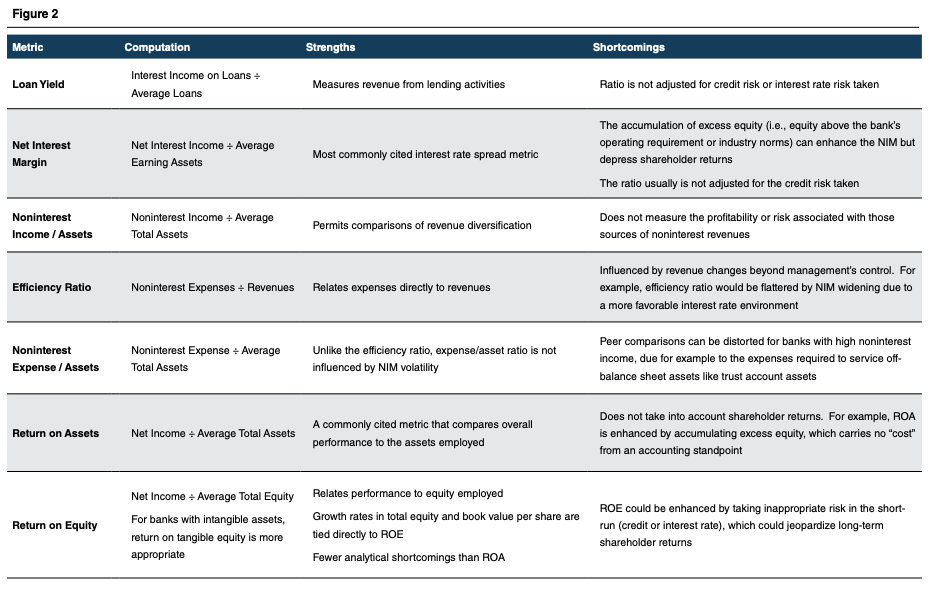
Banks file quarterly Call Reports, which are the launching pad for our templated financial analyses. Depending on asset size, bank holding companies file consolidated financial statements with the Federal Reserve. All bank holding companies, small and large, file parent company only financial statements, although the frequency differs. Other potentially relevant sources of information include:
A rigorous examination of the bank’s financial performance, both relative to its history and a relevant peer group and with due consideration of appropriate risk factors, provides a solid foundation for a valuation analysis. As we observed in June’s BankWatch, value is dependent upon a given bank’s growth opportunities and risk factors, both of which can be revealed using the techniques described in this article.
1 Given the variety of business models employed by banks, this article is inherently general. Some factors described herein will be more or less relevant (or even not relevant) to a specific bank, while it is quite possible that, for the sake of brevity, we altogether avoided mention of other factors relevant to a specific bank. Readers should therefore conduct their own analysis of a specific bank, taking into account its specific characteristics.
Originally published in Bank Watch, August 2019.
FinTech M&A continues to be top of mind for the sector as larger players seek to grow and expand while founders and early investors look to monetize their investments. This theme was evident in several larger deals already announced in 2019 including Global Payments/Total System Services (TSYS), Fidelity National Information Services, Inc./Worldpay, Inc., and Fiserv, Inc./First Data Corporation.
One important aspect of FinTech M&A is the purchase price allocation and the valuation estimates for goodwill and intangible assets as many FinTech companies have minimal physical assets and a high proportion of the purchase price is accounted for via goodwill and intangible assets. The majority of value creation for the acquirer and their shareholders will come from their investment in and future utilization of the intangibles of the FinTech target. To illustrate this point, consider that the median amount of goodwill and intangible assets was ~98% of the transaction price for FinTech transactions announced in 2018. Since such a large proportion of the transaction price paid for FinTech companies typically gets carried in the form of goodwill or intangibles on the acquirer’s balance sheet, the acquirer’s future earnings, tax expenses, and capitalization will often be impacted significantly from the depreciation and amortization expenses.
When preparing valuation estimates for a purchase price allocation for a FinTech company, one key step for acquirers is identifying the intangible assets that will need to be valued. In our experience, the identifiable intangible assets for FinTech acquisitions often include the tradename, technology (both developed and in-development), noncompete agreements, and customer relationships. Additionally, there may be a need to consider the value of an earn-out arrangement if a portion of transaction consideration is contingent on future performance as this may need to be recorded as a contingent liability.
Since the customer relationship intangible is often one of the more significant intangible assets to be recorded in FinTech acquisitions (both in $ amounts and as a % of the purchase price), we discuss how to value FinTech customer relationships in greater detail in the remainder of the article.
Firms devote significant human and financial resources in developing, maintaining and upgrading customer relationships. In some instances, customer contracts give rise to identifiable intangible assets. More broadly, however, customer-related intangible assets consist of the information gleaned from repeat transactions, with or without underlying contracts. Firms can and do lease, sell, buy or otherwise trade such information, which are generally organized as customer lists.
Since FinTech has some relatively varied niches including payments, digital lending, WealthTech, or InsurTech, the valuation of FinTech customer relationships can vary depending on the type of company and the niche that it operates in. While we do not delve into the key attributes to consider for each FinTech niche, we provide one illustration from the Payments niche.
In the Payments industry, one key aspect to understand when evaluating customer relationships is where the company is in the payment loop and whether the company operates in a B2B (business-to-business) or B2C (business-to-consumer) model. This will drive who the customer is and the economics related to valuing the cash flows from the customer relationships. For example, merchant acquirers typically have contracts with the merchants themselves and the valuable customer relationship lies with the merchant and the dollar volume of transactions processed by the merchant over time, whereas the valuable relationship with other payments companies such as a prepaid or gift card company may lie with the end-user or consumer and their spending/card usage habits over time.
Valuation involves three approaches: 1) the cost approach, 2) the market approach, and 3) the income approach. Customer relationships are typically valued based upon an income approach (i.e., a discounted cash flow method) where the cash flows that the customer relationships are expected to generate in the future are forecast and then discounted to the present at a market rate of return.
Valuation under the cost approach requires estimation of the cost to replace the subject asset, as well as opportunity costs in the form of cash flows foregone as the replacement is sought or recreated. The cost approach may not be feasible when replacement or recreation periods are long. Therefore, the cost approach is used infrequently in valuing customer-related assets.
Use of the market approach in valuing customer-related assets is generally untenable for FinTech companies because transactional data on sufficiently comparable assets are not likely to be available.
Under the income approach, customer-related assets are valued most commonly using the income approach. One method within the income approach that is often used to value FinTech customer relationships is the Multi-Period Excess Earnings Method (MPEEM). MPEEM involves the estimation of the cash flow stream attributable to a particular asset. The cash flow stream is discounted to the present to obtain an indication of fair value. The most common starting point in estimating future cash flows is the prospective financial information prepared by (or in close consultation with) the management of the subject business. The key valuation inputs are often estimates of the economic benefit of the customer relationship (i.e., the cash flow stream attributable to the relationships), customer attrition rate, and the discount rate. Three key attributes that are important when using these inputs to valuing customer relationships include:
Mercer Capital has experience providing valuation and advisory services to FinTech companies and their acquirers. We have valued customer-related and other intangible assets to the satisfaction of clients and their auditors within the FinTech industry across a multitude of niches (payments, wealth management, insurance, lending, and software). Most recently, we completed a purchase price allocation for a private equity firm that acquired a FinTech company in the Payments niche. Please contact us to explore how we can help you.
Originally published in the Value Focus: FinTech Industry Newsletter, Mid Year 2019.
Karolina Calhoun, CPA/ABV/CFF presented “Business Valuations and Quality of Earnings in M&A Transactions” at the Association for Corporate Growth (ACG) Tennessee Chapter’s monthly meeting on August 22, 2019. In this presentation, Karolina provides an overview of valuation and quality of earnings as well as when to use each, how are the two different, and how can the two overlap.
Originally presented at the Consumer Bankers Association Executive Banking School at Furman University in Greenville, South Carolina, in this session, Jeff K. Davis, CFA addresses the following objectives:
Originally presented at the Alabama Bankers Association CEO Conference in Point Clear, Alabama, in this session, Jeff K. Davis, CFA addresses the following objectives:
Through late July, M&A activity in 2019 is on pace to match the annual deal volume achieved in the last few years. Since 2014, approximately 4%-5% of banks have been absorbed each year via M&A. According to data provided by S&P Global Market Intelligence, there were 136 announced transactions in the year-to-date period, which equates to 2.5% of the 5,406 FDIC-insured institutions that existed as of year-end 2018.
In the first seven months of the year, aggregate deal volume reached $41.3 billion, which surpasses the $30.5 billion in announced deals in all of 2018 as shown in Figure 1. The increase primarily reflects the $28 billion BB&T-SunTrust merger that was announced on February 7 and represents the largest deal since the 2007-2009 financial crisis. While deal value is up, multiples are down relative to 2018 with the average P/TBV multiple declining from 174% to 161% and the median P/E multiple declining from 25.3x to 17.1x as shown in Figure 2, although the price/earnings multiples from the 2018 period may be distorted by the effects of tax reform.
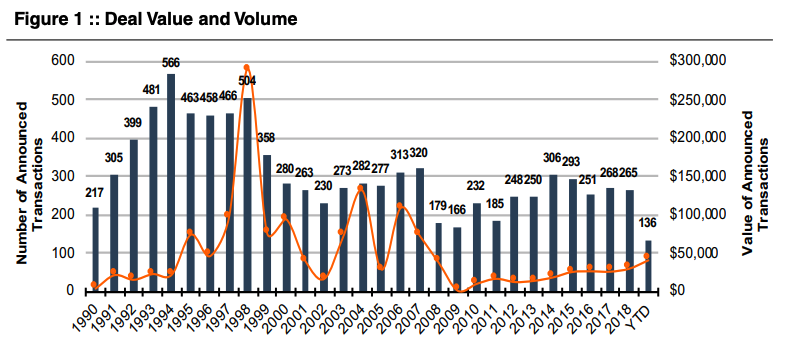
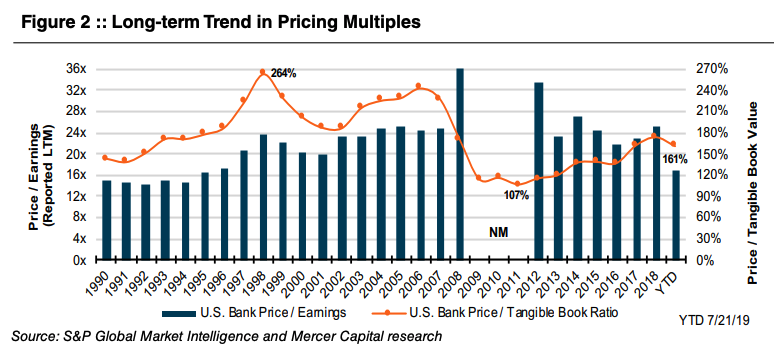
The tables below provide a more detailed look at deal activity and the change in multiples in 2019 relative to 2018. For banks with assets less than $500 million, P/TBV multiples declined approximately 5%. While deal volume in the $500 million to $1 billion size group somewhat limits the meaningfulness of comparisons, it’s interesting to note that the median P/TBV multiple increased for this group relative to 2018 while the median buyer size increased from $3.1 billion in assets to $6.8 billion.
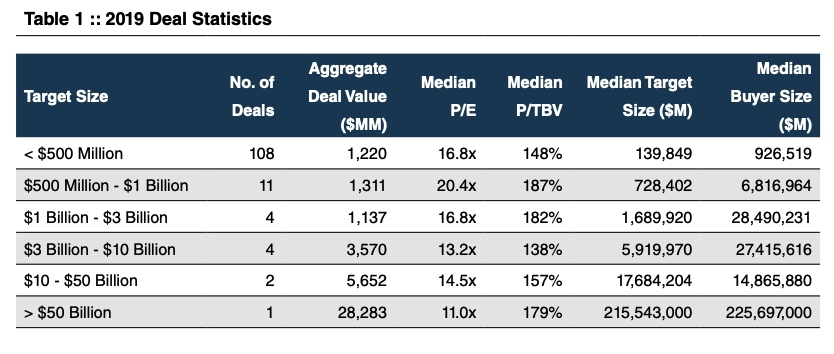
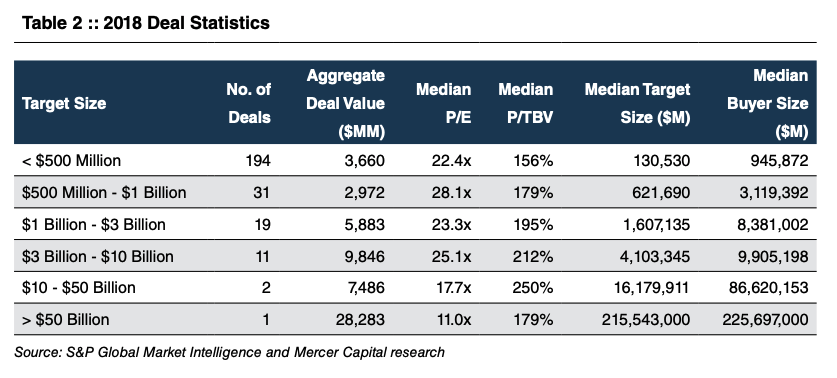
As shown in Figure 3 below, the landscape of buyers has shifted somewhat in favor of bigger banks over the last decade. Deal activity among the smallest group (buyers with assets less than $500 million) peaked in 2015 with 95 announced deals. In 2018, this group announced 56 acquisitions. In contrast, buyers with total assets between $10 billion-$50 billion announced a 10-year high, 28 deals in 2018 and are on pace to reach a similar level in 2019. In May 2018, the SIFI threshold was increased to $250 billion, providing immediate relief to banks with assets between $50 billion and $100 billion. For those with assets between $100 billion and $250 billion, regulatory relief will phase in after 18 months. This change is expected to encourage additional M&A activity among bigger players.
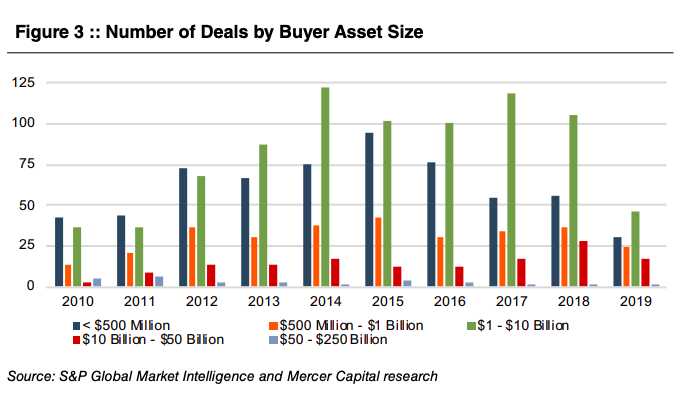
The theme of the story hasn’t changed; consolidation of the banking industry continues at a pace on par with the historical average. Target banks with less than $500 million in assets continue to comprise 75%-85% of total deal volume, but the composition of the buyer universe does seem to be shifting. In addition to the move towards larger buyers, another trend that appears to be gaining speed is the acquisition of commercial banks by credit unions. In 2015, three of such transactions were announced. In 2018, nine deals by credit unions were announced, and an additional ten have been announced through late July of this year.
As to be expected, pricing trends over the last few years have also further cemented the value of a stable and low-cost customer base. As shown in Figure 4 below, as interest rates increased from the end of 2015 through 2018, pricing diverged in favor of banks with the highest percentage of noninterest-bearing deposits to total deposits.
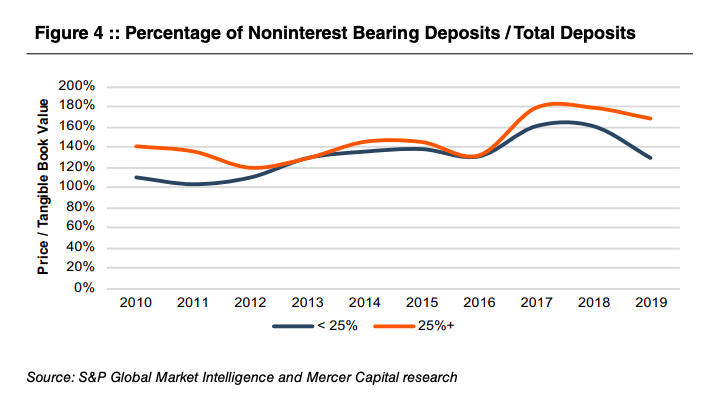
Mercer Capital has been providing transaction advisory and valuation services for over 30 years. To discuss a transaction or valuation issue in confidence, please contact us.
Originally published in Bank Watch, July 2019.
This article begins a series focused on the two issues most central to our work at Mercer Capital: What drives value for a depository institution and how are these drivers distilled into a value for a given depository institution?
We leave the more technical valuation discussion for subsequent articles. At its core, though, value is a function of a specified financial metric or metrics, growth, and risk.
Many industries have a valuation benchmark used by industry participants, although this metric does not necessarily cohere with benchmarks used by investors. In the banking industry, “book value” fills this role. In fact, there are several potential measures of book value, including:
The most commonly used book value metric is tangible book value (or TBV). Like most industry benchmarks, simplicity and commonality are reasons industry participants embrace TBV as a valuation metric. Strengths of TBV as a valuation metric include:
While TBV has its place, investors focus primarily on an institution’s earnings and the growth therein. This earnings orientation occurs because investors are forward looking, and TBV inherently is a backward-looking measure representing the sum of an institution’s common stock issuances, net income, dividends, and share redemptions since its inception. In addition to being forward-looking, investors also appreciate that earnings ultimately are the source of returns to shareholders. With earnings, the institution can do any of (or a combination of) the following:1
More bluntly, investors like growing earnings and cash returns (dividends or share repurchases), which are difficult to provide without a sustainable base of strong earnings. Investors will tolerate some near-term drag on earnings from expansion or risk mitigation strategies, but their patience is not limitless.
In many industries, earnings before interest, taxes, depreciation, and amortization (EBITDA) or a similar metric is the preferred earnings measure. However, banks derive most of their revenues from interest spreads, and EBITDA is an inappropriate metric. Instead, bank investors focus on net income and earnings per share. When credit quality is distressed, investors may consider earnings metrics calculated before the loan loss provision, such as pre-tax, pre-provision operating income (PPOI).
While earnings-based analyses generally should have valuation primacy in our opinion, TBV multiples nevertheless serves as an important test of reasonableness for a valuation analysis. It would be foolhardy to develop a valuation for a depository institution without calculating the TBV multiple implied by the concluded value. Analysts should be able to reconcile implied TBV multiples to public market or M&A market benchmarks and explain any significant discrepancies.
Occasionally, analysts cite balance sheet-based metrics beyond TBV, some of which have more analytical relevance than others. The most useful is a multiple of “core” deposits, a definition of deposits that excludes larger deposits and deposits obtained from wholesale funding markets. Core deposits are time consuming and costly to gather; thus, a multiple of core deposits aligns a bank’s value with its most attractive funding source. A less useful multiple is value as a percentage of total assets, the use of which would implicitly encourage management to stockpile assets without regard to their incremental profitability.
Investors like growth and accelerating growth even more. Without demonstrating the mathematics, higher expected growth rates produce higher valuation multiples. Further, price/earnings multiples expand at an increasing rate as growth rates increase, as indicated in the following chart. The opposite is true, too, as slowing growth reduces the price/earnings.
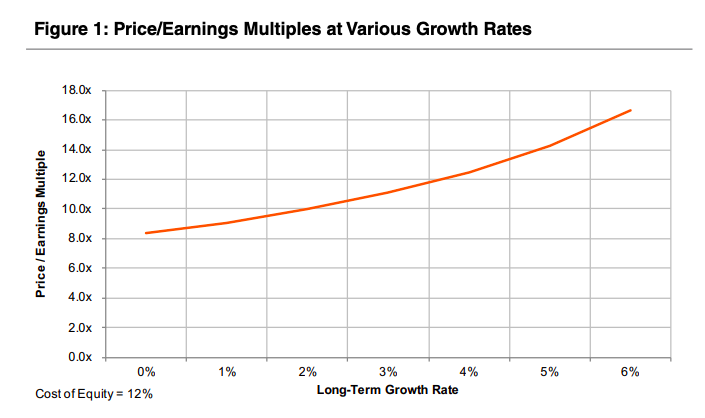
Banks report innumerable metrics to directors and investors, but what are the most relevant growth indicia to investors? Usually, investors focus on growth in the following:
Valuation is inherently forward-looking, and historical growth rates are useful mostly as potential predictors of future growth. Further, most investors understand that there is some tradeoff between earnings today and investing for higher earnings in the future. While some near-term pressure on earnings from an expansion strategy is acceptable, strategic investments should not continually be used to explain below average profitability. After all, a bank’s competitors likely are reinvesting as well for the future.
How does growth affect value? As a thought experiment, consider a bank with no expected growth in earnings and a 100% dividend payout ratio. Should this bank’s common equity value increase? In this admittedly extreme scenario, the answer is no. This bank’s common equity resembles a preferred stock investment, with a shareholder’s return generated by dividends. That is, for value to grow, one (or preferably more) of the preceding factors must increase.
Should a bank prioritize growth in earnings per share, dividends per share, or another metric? The answer likely depends on the bank’s shareholder base. In public markets, investors tend to be more focused on earnings per share growth. If an investor desires income, he or she can sell shares in the public market. For privately-held banks, though, investors often are keenly aware of dividend payments and emphasize the income potential of the investment. Of course, sustaining higher dividend payments requires earnings growth.
Growth creates a virtuous cycle – retained earnings lead to higher future net income, allowing for future higher dividends or additional reinvestment, and so the cycle continues. One important caveat exists, though. This virtuous cycle presumes that the retained earnings from a given year are invested in new opportunities yielding the same return on equity as the existing operations. If reinvestment occurs in lower ROE opportunities – such as liquid assets supported by excess capital beyond the level needed to operate the bank safely – then growth in value may be diminished.
This discussion of growth segues into the third key valuation factor, risk.
More than most industries, risk management is an overarching responsibility of management and the board of directors and a crucial element to long-term shareholder returns. Banks encounter the following forms of risk:
While growth rates are observable from reported financial metrics, the risk assumed to achieve that growth often is more difficult to discern – at least in the near-term. Risk can accumulate, layer upon layer, for years until a triggering event happens, such as an economic downturn. Risk also is asymmetric in the sense that a strategy creating incremental risk, such as a new lending product, can be implemented quickly, but exiting the problems resulting from that strategy may take years.
From a valuation standpoint, investors seek the highest return for the least risk. Given two banks with identical growth prospects, investors would assign a higher price/earnings multiple to the bank with the lower risk profile. Indicia of risk include:
None of the preceding factors necessarily imply higher risk vis-à-vis other banks; the key is risk management, not risk avoidance. However, if an investor believes risk is rising for any reason, then that expectation can manifest in our three pronged valuation framework as follows:
An old adage is that risk can be quantified and uncertainty cannot. This observation explains why stock prices and pricing multiples can be particularly volatile for banks in periods of economic uncertainty or distress. If investors cannot quantify a bank’s downside exposure, which often is more attributable to general economic anxieties than the quality of the bank’s financial disclosures, then they tend to react by taking a pessimistic stance. As a result, risk premiums can widen dramatically, leading to lower multiples.
This article provides an overview of the three key factors underlying bank stock valuations – financial performance, risk, and growth. While these three factors are universal to valuations, we caution that the examples, guidance, and observations in this article may not apply to every depository institution.
At Mercer Capital, valuations of clients’ securities are more than a mere quantitative exercise. Integrating a bank’s growth prospects and risk characteristics into a valuation analysis requires understanding the bank’s history, business plans, market opportunities, response to emerging technological issues, staff experience, and the like. These important influences on a valuation analysis cannot be gleaned solely from reviewing a bank’s Call Report. Future editions of this series will describe both the quantitative and qualitative considerations we use to arrive at sound, well-reasoned, and well-supported valuations.
1 In theory, a bank could accomplish the preceding without earnings, but eventually that well (i.e., the bank’s TBV) will run dry
Originally published in Bank Watch, June 2019.
On May 8-10, 2019, Chris Mercer, Scott Womack, and I attended the 2019 AAML/BVR National Divorce Conference in Las Vegas. This was the first biannual National Divorce Conference on cutting edge tax, valuation, and financial issues co-sponsored by the American Academy of Matrimonial Lawyers and Business Valuation Resources, LLC.
In attendance were family law attorneys, general practice attorneys, CPAs, business valuators, and other financial professionals. Total attendance was approximately 300 individuals, split about 50/50 between attorneys and financial professionals. Sessions covered topics including updates on standards of value, cryptocurrencies and their impact on divorce, tax law changes and their impact on family law, and how to best present your case to the courtroom, among others.
We have chosen four sessions that we thought would be of interest to this newsletter’s audience.
Edward L. Kainen, Senior Managing Partner of Kainen Law Group, PLLC & Richard West, Principal & Shareholder of West Family Law Group
In “Blockchain/Crypto: Dividing Digital Assets,” Ed Kainen and Richard West provided a brief history of money– from the development of various forms of currencies and eventually to Bitcoin and other cryptocurrencies. In addition to providing a comprehensive glossary of essential terminology, the speakers also covered how Bitcoin and cryptocurrencies are transacted and explained the mechanics of Bitcoin technology upon which cryptocurrencies rely. A history of Bitcoin, as well as the benefits, determinants and consequences associated with the use of these cryptocurrencies was addressed. The session also covered how all of the foregoing impacts divorce and family law litigation, both issues of valuation and essentials of discovery, as well as the potential for malpractice pitfalls and how to avoid them.
Z. Christopher Mercer, FASA, CFA, ABAR, Founder and CEO of Mercer Capital
In “How to Present Complex Finance to Judges: K.I.S.S.,” Chris Mercer addressed the question of how to K.I.S.S. (keep it simple, stupid) in a litigation setting, as the K.I.S.S. principle is one of the key ideas of effective communication. Mr. Mercer drew on over 30 years of experience in presenting complex valuation and damages issues to judges and juries while sharing the techniques and templates necessary to communicate one’s position and the opponent’s position in such a way that judges can understand key information and why it is important.
James R. Hitchner, CPA, ABV, CFF, ASA, Managing Director of Financial Valuation Advisors
In this session, Jim Hitcher posed the question: Have you ever read a business valuation report where you knew the valuation was rigged to obtain a higher or lower value? During his session, he provided tricks of the trade to identify how some valuation analysts can manipulate the process in order to please their client and/or win at all costs. Mr. Hitchner also provided tips on how to attack biases including three areas with the most frequent biases such as multiples, growth factors, and the specific company risk premium/risk factor.
Peter L. Gladstone, Principal & Shareholder of Gladstone and Weissman & Robert A. Stone, CPA, CFF, ABV, Principal at Kaufman Rossin
In this session, Peter Gladstone and Robert Stone provided background on equity awards and options as the increase of startups precipitated by the tech boom of the 1990s has led to increasing popularity of stock options, restricted stock units (“RSUs”), and similar types of equity-based compensation. These forms of executive compensation have become common in both privately held and publically traded companies.
Designed to both reward and retain talented employees, these benefits can be difficult to understand and value, particularly at a random moment that, while relevant to one’s divorce, might seem arbitrary in the context of a business. Just as the value of closely held businesses presents challenging issues over which business valuation experts often disagree, equity-based compensation plans and their values (or future income stream) represent ground for a divergence of opinions among forensic accountants supporting counsel on behalf of their divorce clients.
During the session, the speakers examined the various characteristics of stock options, RSUs, both vested and unvested; their tax implications; and the challenges typically encountered in valuing and equitably distributing these valuable and highly guarded assets of a marital estate.
All the sessions were well-received, and we recommend these presentations and their authors’ publications to anyone interested. We’re looking forward to next year’s event and hope to see you there.
Originally published in Mercer Capital’s Tennessee Family Law Newsletter, Second Quarter 2019.
Section 409A is a provision of the Internal Revenue Code that applies to all companies offering nonqualified deferred compensation plans to employees. Generally speaking, a deferred compensation plan is an arrangement whereby an employee (“service provider” in 409A parlance) receives compensation in a later tax year than that in which the compensation was earned. “Nonqualified” plans exclude 401(k) and other “qualified” plans.
What is interesting from a valuation perspective is that stock options and stock appreciation rights (SARs), two common forms of incentive compensation for private companies, are potentially within the scope of Section 409A. The IRS is concerned that stock options and SARs issued “in the money” are really just a form of deferred compensation, representing a shifting of current compensation to a future taxable year. So, in order to avoid being subject to 409A, employers (“service recipients”) need to demonstrate that all stock options and SARs are issued “at the money” (i.e., with the strike price equal to the fair market value of the underlying shares at the grant date). Stock options and SARs issued “out of the money” do not raise any particular problems with regard to Section 409A.
Stock options and SARs that fall under Section 409A create problems for both service recipients and service providers. Service recipients are responsible for normal withholding and reporting obligations with respect to amounts includible in the service provider’s gross income under Section 409A. Amounts includible in the service provider’s gross income are also subject to interest on prior underpayments and an additional income tax equal to 20% of the compensation required to be included in gross income. For the holder of a stock option, this can be particularly onerous as, absent exercise of the option and sale of the underlying stock, there has been no cash received with which to pay the taxes and interest.
These consequences make it critical that stock options and SARs qualify for the exemption under 409A available when the fair market value of the underlying stock does not exceed the strike price of the stock option or SAR at the grant date.
For public companies, it is easy to determine the fair market value of the underlying stock on the grant date. For private companies, fair market value cannot be simply looked up on Bloomberg. Accordingly, for such companies, the IRS regulations provide that “fair market value may be determined through the reasonable application of a reasonable valuation method.” In an attempt to clarify this clarification, the regulations proceed to state that if a method is applied reasonably and consistently, such valuations will be presumed to represent fair market value, unless shown to be grossly unreasonable. Consistency in application is assessed by reference to the valuation methods used to determine fair market value for other forms of equity-based compensation. An independent appraisal will be presumed reasonable if “the appraisal satisfies the requirements of the Code with respect to the valuation of stock held in an employee stock ownership plan.”
A reasonable valuation method is to consider the following factors:
The value of tangible and intangible assets
The present value of future cash flows
The market value of comparable businesses (both public and private)
Other relevant factors such as control premiums or discounts for lack of marketability
Whether the valuation method is used consistently for other corporate purposes
In other words, a reasonable valuation considers the cost, income, and market approaches, and considers the specific control and liquidity characteristics of the subject interest. For start-up companies, the valuation would also consider the company’s most recent financing round and the rights and preferences of any securities issued. The IRS is also concerned that the valuation of common stock for purposes of Section 409A be consistent with valuations performed for other purposes.
Fair market value is not specifically defined in Section 409A of the Code or the associated regulations. Accordingly, we look to IRS Revenue Ruling 59-60, which defines fair market value as “the price at which the property would change hands between a willing buyer and a willing seller when the former is not under any compulsion to buy and the latter is not under any compulsion to sell, both parties having reasonable knowledge of relevant facts.”
Among the general valuation factors to be considered under a reasonable valuation method are “control premiums or discounts for lack of marketability.” In other words, if the underlying stock is illiquid, the stock should presumably be valued on a non-marketable minority interest basis.
This is not without potential confusion, however. In an Employee Stock Ownership Plan (ESOP), stock issued to participants is generally covered by a put right with respect to either the Company or the ESOP. Accordingly, valuation specialists often apply marketability discounts on the order of 0% to 10% to ESOP shares. Shares issued pursuant to a stock option plan may not have similar put rights attached, and therefore may warrant a larger marketability discount. In such cases, a company that has an annual ESOP appraisal may not have an appropriate indication of fair market value for purposes of Section 409A.
In addition to independent appraisals, formula prices may, under certain circumstances, be presumed to represent fair market value. Specifically, the formula cannot be unique to the subject stock option or SAR, but must be used for all transactions in which the issuing company buys or sells stock.
For purposes of Section 409A compliance, start-ups are defined as companies that have been in business for less than ten years, do not have publicly traded equity securities, and for which no change of control event or public offering is reasonably anticipated to occur in the next twelve months. For start-up companies, a valuation will be presumed reasonable if “made reasonably and in good faith and evidenced by a written report that takes into account the relevant factors prescribed for valuations generally under these regulations.” Further, such a valuation must be performed by someone with “significant knowledge and experience or training in performing similar valuations.”
This presumption, while presented as a separate alternative, strikes us a substantively and practically similar to the independent appraisal presumption described previously. Some commentators have suggested that the valuation of a start-up company may be performed by an employee or board member of the issuing company. We suspect that it is the rare employee or board member that is actually qualified to render the described valuation.
The bottom line is that Section 409A applies to both start-ups and mature companies.
The safe harbor presumptions of Section 409A apply only when the valuation is based upon an independent appraisal, and it is likely that a valuation prepared by an employee or board member would raise questions of independence and objectivity.
The regulations also clarify that the experience of the individual performing the valuation generally means at least five years of relevant experience in business valuation or appraisal, financial accounting, investment banking, private equity, secured lending, or other comparable experience in the line of business or industry in which the service recipient operates.
In our reading of the rules, this means that the appraisal should be prepared by an individual or firm that has a thorough educational background in finance and valuation, has accrued significant professional experience preparing independent appraisals, and has received formal recognition of his or her expertise in the form of one or more professional credentials (ASA, ABV, CBA, or CFA). The valuation professionals at Mercer Capital have the depth of knowledge and breadth of experience necessary to help you navigate the potentially perilous path of Section 409A.
Originally published in the Financial Reporting Update: Equity Compensation, June 2019.
Clients frequently want to know, “How long is an equity compensation valuation good for?” We get it. You want to provide employees, contractors, and other service providers who are compensated through company stock with current information about their interests, but the time and cost required to get a valuation must also be considered.
Due to the natural business changes every company goes through, accounting and legal professionals often recommend updates at least annually if no significant change or financing has occurred. However, unique company or market characteristics often necessitate more frequent updates. Here are some of the factors to consider when determining the need for a valuation update:
Even for companies that have fairly steady operations, the effects of small business changes accumulate over time. Companies that deal with major changes relatively infrequently may be suited to regular summary updates to supplement full comprehensive reports as a way to maximize the cost-benefit analysis of equity compensation valuation.
Originally published in the Financial Reporting Update: Equity Compensation, June 2019.