How Badly do Job Cuts Affect the Value of Texas Energy Companies?
Texas energy companies continue to cut jobs at a shocking rate. According to the Houston Business Journal, nearly 40,000 people working for three of the world’s largest oilfield services firms have lost their jobs in the last six months, and even more layoffs are anticipated in the near future. Cuts have also occurred in the upstream and manufacturing sectors.
About the Cuts
Halliburton Co. has already cut 9,000 jobs, which amounts to 10 percent of its workforce. Schlumberger Ltd. has cut 20,000 jobs, which is approximately 15 percent of its workforce, and Baker Hughes Inc. has cut 10,500 jobs, which accounts for 17 percent of its workforce. All of these companies also reported losses or a significant decrease in earnings for Q1.
In the upstream sector, Newfield Exploration Co. has announced that it plans to merge two of its units and close its Denver office. Hercules Offshore Inc. has cut its workforce by almost 40 percent, and Linn Energy LLC plans to close its Denver office, eliminating 52 jobs in the process.
Are These Layoffs Necessary?
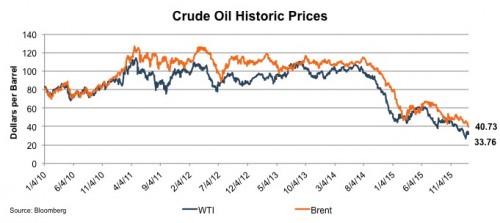
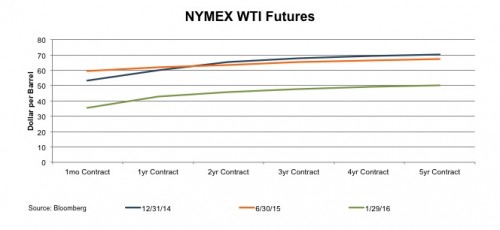
For oilfield service providers, recent job cuts have been largely unavoidable. Oil prices have been declining in recent months, leading to significant revenue loss for companies in this sector. In fact, the Wall Street Journal reports that prices for U.S.-traded crude oil reached a six-year low in mid-March of this year.
For companies in the upstream sector, however, layoffs may not have been a necessity. These companies have not been affected by oil price declines as dramatically as oilfield service providers, so it’s possible that they are simply using the declines as an excuse to “shed fat” and boost efficiency.
Effects on Valuation
Layoffs may impact a company’s performance and value in a number of ways. Some of the possible effects of layoffs include:
- Bad Press: Job loss is associated with a number of negative implications for employees, which can lead to bad press for the company.
- Uncertainty: Downsizing inspires feelings of uncertainty among remaining employees, investors and any other party with a stake in the company’s future.
- Employment Restructuring Expenses: Layoffs often involve employment restructuring expenses, which leads to increased expenses and decreased profits. In fact, several of the companies discussed reported losses after implementing job cuts.
The immediate effect of job cuts on company values is undoubtedly negative. However, cuts are often made in the hope that lower overhead costs and increased efficiency will eventually boost profits and, hence, the company’s overall worth. Thus, the effect of these cuts on the future of Texas energy companies remains unknown.
Looking into the Past
This is not the first time oil prices have dropped enough to have a noticeable impact on the industry. After peaking in 1980, crude oil prices fell steadily for the next six years. The demand for oil was greatly reduced, and businesses in this industry were losing money. In response, they cut back on exploration and drilling significantly, leading to tens of thousands of layoffs.
Oil prices eventually rebounded after the 1980s oil glut. However, because companies had laid off so many workers, they were not prepared to handle the boom that followed. This caused a number of problems for companies in the industry, as they were forced to scramble for employees with the experience and expertise necessary for success in the open positions. Unfortunately, many of the best workers had left oil for good, and potential recruits were wary of joining an industry that seemed so volatile.
In light of this history, some companies with cash reserves are attempting to curb the number of job cuts in order to prevent staffing issues when prices improve. However, for many of the smaller companies, layoffs are unavoidable.
No one can say for certain what the future holds. If the market rebounds quickly, companies that have implemented heavy job cuts may find themselves struggling. If prices remain low, however, companies in this industry that have tried to curb job cuts may have no choice but to cut even more workers loose. Regardless of what happens, achieving a complete recovery from this crisis will not be easy.
This article was originally published in Valuation Viewpoint, May 2015.
Preferences and FinTech Valuations
2015 was a strong year for FinTech. For those still skeptical, consider the following:
- All three publicly traded FinTech niches that we track (Payments, Solutions, and Technology) beat the broader market, rising 11 to 14% compared to a 1% return for the S&P 500;
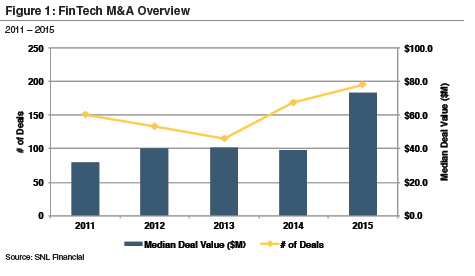
- FinTech M&A volume and pricing rose sharply over recent historical periods with 195 announced deals and a median deal value of $74 million in 2015 (Figure 1);
- A number of notable fundings for private FinTech companies occurred with roughly $9.0 billion raised among approximately 130 U.S. FinTech companies in larger funding rounds (only includes raises over $10 million).
One of the more notable FinTech events in 2015 was Square’s IPO, which occurred in the fourth quarter. Square is a financial services and mobile payments company that is one of the more prominent FinTech companies with its high profile founder (Jack Dorsey, the Twitter co-founder and CEO) and early investors (Kleiner Perkins and Sequoia Capital). Its technology is recognizable with most of us having swiped a card through one of their readers attached to a phone after getting a haircut, sandwich, or cup of coffee. Not surprisingly, Square was among the first FinTech Unicorns, reaching that mark in June 2011. Its valuation based on private funding rounds sat at the top of U.S.-based FinTech companies in mid-2015.
So all eyes in the FinTech community were on Square as it went public in late 2015. Market conditions were challenging then (compared to even more challenging in early 2016 for an IPO), but Square had a well-deserved A-list designation among investors. Unfortunately, the results were mixed. Although the IPO was successful in that the shares priced, Square went public at a price of $9 per share, which was below the targeted range of $11 to $13 per share. Also, the IPO valuation of about $3 billion was sharply below the most recent fundraising round that valued the company in excess of $5 billion.
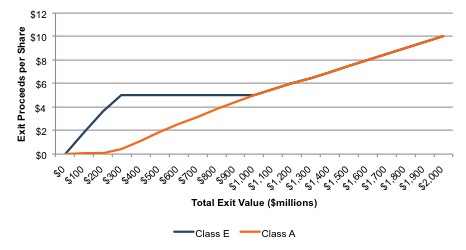
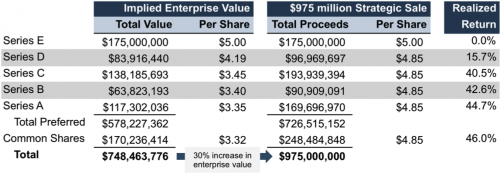
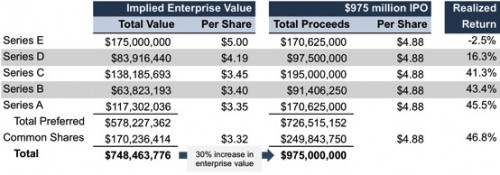
In the category its great pay if you can get it, most Series E investors in the last funding round had a ratchet provision that provided for a 20% return on their investment, even if the offering price fell below the $18.56 per share price required to produce that return. The ratchet locked in through the issuance of additional shares to the Series E investors. The resulting dilution was borne by other investors not protected by the ratchet.
On the flip side the IPO was not so bad for new investors. Square shares rose more than 45% over the course of the opening day of trading and then traded in the vicinity of $12 to $13 per share through year-end. With the decline in equity markets in early 2016, the shares traded near the $9 IPO price in mid-February.
IPO pricing is always tricky—especially in the tech space—given the competing demands between a company floating shares, the underwriter, and prospective shareholders. The challenge for the underwriter is to establish the right price to build a sizable order book that may produce a first day pop, but not one that is so large that existing investors are diluted. According to MarketWatch, less than 2% of 2,236 IPOs that priced below the low end of their filing range since 1980 saw a first day pop of more than 40%. By that measure, Square really is a unique company.
One notable takeaway from Square’s experience is that the pricing of the IPO as much as any transaction may have marked the end of the era of astronomical private market valuations for Unicorn technology companies. The degree of astronomical depends on what is being measured, however. We have often noted that the headline valuation number in a private, fundraising round is often not the real value for the company. Rather, the price in the most recent private round reflects all of the rights and economic attributes of the share class, which usually are not the same for all shareholders, particularly investors in earlier fundraising rounds. As Travis Harms, my colleague at Mercer Capital noted: “It’s like applying the pound price for filet mignon to the entire cow – you can’t do that because the cow includes a lot of other stuff that is not in the filet.”
While a full discussion of investor preferences and ratchets is beyond the scope of this article, they are fairly common in venture-backed companies. Recent studies by Fenwick & West of Unicorn fundraisings noted that the vast majority offered investors some kind of liquidation preference. The combination of investor preferences and a decline in pricing relative to prior funding rounds can result in asymmetrical price declines across the capital structure and result in a misalignment of incentives. John McFarlane, Sonos CEO, noted this when he stated: “If you’re all aligned then no matter what happens, you’re in the same boat… The really high valuation companies right now are giving out preferences – that’s not alignment.”
A real-world example of this misalignment was reported in a New York Times story in late 2015 regarding Good Technology, a Unicorn that ended up selling to BlackBerry for approximately $425 million in September 2015. While a $425 million exit might be considered a success for a number of founders and investors, the transaction price was less than half of Good’s purported $1.1 billion valuation in a private round. The article noted that while a number of investors had preferences associated with their shares that softened the extent of the pricing decline, many employees did not. “For some employees, it meant that their shares were practically worthless. Even worse, they had paid taxes on the stock based on the higher value.”
As the Good story illustrates, the valuation process can be challenging for venture-backed technology companies, particularly those with several different share classes and preferences across the capital structure, but these valuations can have very real consequence for stakeholders, particularly employees. Thus, it is important to have a valuation process with formalized procedures to demonstrate compliance with tax and financial reporting regulations when having valuations performed. Certainly, the prospects for scrutiny from auditors, SEC, and/or IRS are possible but very real tax issues can also result around equity compensation for employees.
Given the complexities in valuing venture-backed technology companies and the ability for market/investor sentiment to shift quickly, it is important to have a valuation professional that can assess the value of the company as well as the market trends prevalent in the industry. At Mercer Capital, we attempt to gain a thorough understanding of the economics of the most recent funding round to provide a market-based “anchor” for valuation at a subsequent date. Once the model is calibrated, we can then assess what changes have occurred (both in the market and at the subject company) since the last funding round to determine what impact if any that may have on valuation. Call us if you have any questions.
2015: A Good Year for Banks
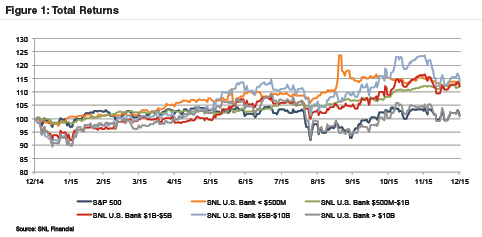
After weak broad market performance in the first quarter of the year and slow advances during the summer, U.S. stocks generally saw amplified returns in the fourth quarter of 2015. The largest banks (those with over $50 billion in assets) generally performed in line with broad market trends, but most banks outperformed the market with total returns on the order of 10% to 15% for the year (Figure 1).
Bank stock performance improved markedly in the fourth quarter as speculation following the FOMC’s September meeting suggested rate increases may begin in the fourth quarter. In mid-December, the FOMC met again and, after seven years of its zero interest rate policy, announced an increase in the target fed funds rate. The shift in monetary policy is expected to gradually improve strains on banks’ net interest margins and should be most apparent for banks with more asset-sensitive balance sheets, though community banks that may have made more loans with longer fixed terms or loan floors may experience some tightening in the short term.
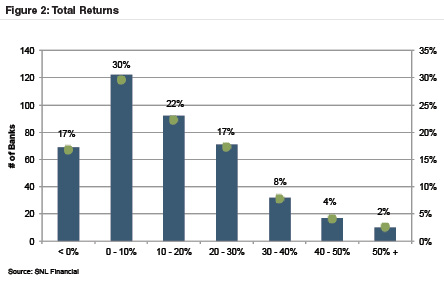
Bank returns generally averaged around 0% to 30% in 2015, though 17% of the U.S. banks analyzed (traded on the NASDAQ, NYSE, or NYSE Market exchanges for the full year) realized negative total returns. These included banks continuing to deal with high levels of NPAs; banks that are located in oil-dependent areas such as Louisiana and Texas; and some banks that have been active acquirers that missed Street expectations. On the other end, a few high performers in 2015 include merger targets as well as banks that have seen more success from acquisition activity (Figure 2).
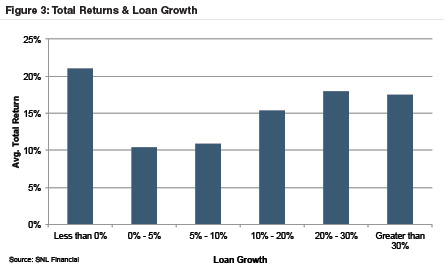
One of the primary factors contributing to stronger returns in 2015 was loan growth. Banks with loan growth over 10% exhibited above-average returns, while those with slower growth tended to exhibit lower returns, with the exception of banks that shrank their portfolios during the year, though for these banks the higher returns likely reflected prior years’ underperformance that was priced into the stocks (Figure 3).
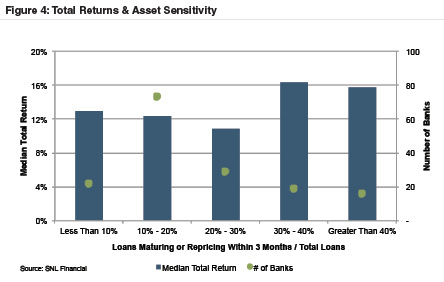
Asset-sensitive banks also outperformed in 2015. While asset sensitivity is difficult to evaluate from publicly available data, we measured asset sensitivity by the proportion of loans maturing or repricing in less than three months from September 30, 2015, relative to total loans (both obtained from FR Y-9C filings). Limiting the analysis to publicly traded banks with assets between $1 billion to $5 billion reveals that the most asset sensitive banks returned about 16% in 2015, or 400 basis points more than less asset sensitive banks (Figure 4).
Though the smallest banks generally realized the highest returns in 2015, pricing multiples were strongest for banks with assets between $1 and $10 billion, which generally saw better profitability than the smaller banks. Year-over-year, pricing multiples generally remained flat from 2014 (Figure 5).
Mercer Capital is a national business valuation and financial advisory firm. Financial Institutions are the cornerstone of our practice. To discuss a valuation or transaction issue in confidence, feel free to contact us.
Energy Future Holdings: Valuation Issues Hover Over Bankruptcy Proceedings
When Energy Future Holdings (“EFH”) and certain of its subsidiaries entered into a pre-arranged reorganization under Chapter 11 of the U.S. Bankruptcy Code on April 29, there were (and remain) a myriad of issues that require resolution for the largest generator, distributor and retail electricity provider in Texas. How should debtor-in-possession (“DIP”) financing be allocated? How and when will restructuring priority be given to various creditors? Is a “tax-free” spin of Texas Consolidated Energy Holdings (“TCEH”) a viable option? What is to be done about Oncor? The list goes on. At the heart of those questions, and of the bankruptcy, are valuation issues that have and likely will continue to permeate throughout the process.
What is EFH – and more specifically its subsidiaries TXU Energy, Luminant and Oncor – worth? That’s the $42 billion question. Valuation professionals can utilize a number of tools at their disposal to attempt to answer that question, including income methods such as discounted cash flow analysis and market methods such as comparative transactions and publicly traded peer analysis. How those methods are applied, along with their underlying economic and financial assumptions, will be closely examined and almost certainly challenged among the stakeholders.
At issue are EFH’s three distinct business units: (i) Luminant which is the merchant power unit; (ii) TXU Energy which is the retail electric unit, and (iii) Oncor’s power delivery business. Luminant and TXU Energy are unregulated, while Oncor is regulated.
A few of the critical existing and potentially emerging valuation issues in EFH’s Chapter 11 process include things like (i) premises of value, (ii) regulatory issues as they pertain to pricing and rate setting, (iii) consolidated vs. non-consolidated restructuring scenarios and (iv) development of projections and cash flows. All of these issues have interplay with each other and they are certainly not exclusive when it comes to valuation considerations for as complex an organization as EFH. In addition we will look to instructive prior electric company bankruptcies, such as Mirant and Dynegy, to help navigate these waters as well.
Premise of Value: Reorganization Value vs. Fair Market Value
“Being in bankruptcy is like being in a fishbowl,” said Sander “Sandy” Esserman, a partner at Stutzman, Bromberg, Esserman & Plifka who was involved in the Mirant Corporation bankruptcy. One of the most meaningful and thematic aspects stakeholders and observers will be viewing in that fishbowl will be the standard of value lens that one peers through. Standard of value considerations will be front and center at EFH’s division Texas Competitive Electric Holdings (“TCEH”), where creditors are disputing EFH’s restructuring strategy that could wipe out billions of dollars of debt.
There are two premises of value to consider: fair market value and reorganization value. The fair market value standard is more of an as-is where-is proposition, which posits that the value of a company is a reflection of what the current marketplace will pay for it.
This standard is used (often successfully) in reorganization plans and liquidation scenarios where a sale of assets or companies is a viable and appropriate solution to the parties. This could be unlikely in EFH’s situation.
According to EFH management, under certain scenarios, a Section 363 sale could trigger tax liabilities of over $6 billion. However, in the midst of Chapter 11 reorganizations, fair market value has been criticized as overemphasizing the “stigma” of bankruptcy, and thus undervaluing a debtor. Esserman concurred that undervaluation can happen, citing American Airlines and Lyondell as examples of companies that emerged out of Chapter 11 and quickly saw stock prices (and thus enterprise values) increase.
The other key standard is reorganization value, which can be defined as the enterprise value of the reorganized debtor. This more futuristic premise takes into account the effects of the bankruptcy process and its benefits to the value of the debtor(s). The difficulty of this can be in its proper application and timing. The Mirant bankruptcy, whereby the court issued an exhaustive memorandum opinion on the valuation efforts, put significant weight on the reorganization value standard and, as such, utilized exit financing and non-distressed equity returns as assumptions in its valuation opinion. This is almost certainly the posture that unsecured creditors will be taking in regard to EFH.
Regulatory & Consolidation Issues: How Does Oncor Fit In?
One of the negotiated items pre-bankruptcy was whether or not to consider a “consolidated” bankruptcy for EFH, meaning including Oncor in the plan.
This is an important consideration. Oncor is not a debtor in the Chapter 11 case, but its value is a relevant component to the restructuring. TXU is Oncor’s largest customer, and it is regulated by the Public Utility Commission of Texas (“PUC”). Due to its regulated status, Oncor is restricted from making distributions to EFH under certain conditions.
Oncor also has an independent board of directors, not to mention certain structural and operational aspects used to enhance Oncor’s credit quality – known as “ring-fencing” measures that further isolate it from EFH. That said, Oncor is profitable and distributions represent an all-important cash inflow to EFH as a means to fund creditors, perhaps as adequate protection to secured creditors or as payment to unsecured creditors.
The rates set by the PUC impact those measures. This brings about the question of where will the influence of the bankruptcy court end and the regulatory authorities begin? Actions by one may or may not influence the other. We do not pretend to know or even want to speculate on what will transpire in respect to this, but however those rates and dividends out of Oncor change, it will impact the value to EFH and its creditors.
The competitive side of EFH’s business, TCEH, is in a highly competitive business that buys and sells a commodity product. Its rates are not set and have fluctuating inputs that have significant impact on valuations.
How the marketplace views Luminant and TXU Energy is different than how it views Oncor, so it might make sense to treat each entity individually, with separate cash flow projections, pricing and market assumptions. That said, there are other consolidated, multi-faceted public electric companies that may provide good valuation benchmarks.
It is notable that in the Mirant bankruptcy the court considered and utilized public comparable companies. However, with the specific structural, tax and regulatory issues involved with EFH and its subsidiaries, one has to be careful not to generalize comparative aspects of these companies, which the Mirant court emphasized.
Projections: Reaching a Consensus or a Battle of Contending Plans?
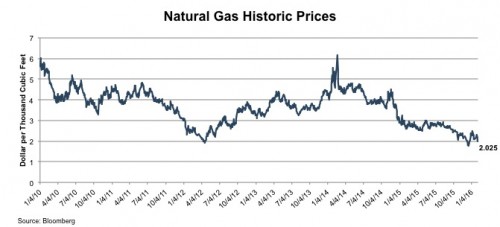
When private equity investors KKR, TPG and Goldman Sachs bought EFH in 2007 for more than $8 billion in equity, it was widely seen as a bullish take on natural gas prices. Back then, investor projections anticipated rising Henry Hub prices. They were wrong. EFH characterized its misfortune this way in their first day motions: “In October 2007, the main ingredients for EFH’s financial success were robust and steady economic growth…natural gas prices that were not expected to significantly decline over the long term. Since 2007, however, overall economic growth was reduced…and wholesale electricity prices have significantly declined.”
New discoveries, hydraulic fracturing and the 2008 recession all led to a drop in natural gas prices. The challenge that needs to be undertaken now is attempting to project prices in today’s environment as these prices form the baseline for any financial or discounted cash flow analysis. Coal prices play a meaningful role as well.
Opinions vary widely on this and therein it is perhaps the most challenging valuation aspect in this entire case. Where will natural gas prices go? Some parties are more optimistic than others and this optimism could fuel the basis for competing reorganization plans. For EFH’s part, it would not surprise people if management took a conservative view on gas prices, having already been burned on prior projections. The stakes are high. Cash flow sensitivity to even slight variations in assumed prices could mean the difference between an unsecured creditor being made whole or getting very little.
One path the court could take is having industry subject matter experts help key industry variables and form a baseline for a projection. The underlying assumptions in the cash flow projections would be ultimately built upon those assumptions.
Even if agreement is reached there, the bottom line cash flow could still vary widely based on cost structure, rates of return and future tax benefits from prior net operating losses (TCEH reported $3.0 billion of pre-tax losses in 2013). The net operating losses, depending on what reorganization plan the court adopts, could prove to be an enormous swing factor as well. They could possibly be worth billions under one scenario or they could potentially be worthless depending on the tax treatment of the plan.
Summary
Valuation issues are front and center of the EFH bankruptcy. How the ultimate reorganization plan plays out will be critical. Many valuation aspects can be structured in a settlement. However, even in bankruptcy environments, there are economic, financial and market issues that still fuel the undergirding drivers to maximizing value for all stakeholders. No investor wants the short end of a stick. Depending on how the valuation issues play out there might be a chance that EFH has a long enough stick for everyone to grasp. Time will tell.
This article was published in The Texas Lawbook on July 10, 2014.
The Oil and Gas Shift is Impacting the Industry in a Few Key Areas
Anybody who has been to a gas pump in the last several months can tell you that the energy industry is currently in the throes of change. Prices are falling to lows that they haven’t seen in almost a decade and the industry itself is being impacted in a large number of different ways. The changing face of economics and the marketplace has presented an entirely new set of challenges that businesses will have to adapt to in order to thrive well into the future.
The Changing Face of Economics and the Marketplace
Another significant change that will impact the oil and gas industries in 2015 and beyond has to do with current market fluctuations that will affect profitability. It’s no secret that oil prices started plummeting in 2014 and show no signs of slowing down. Bernstein Research, for example, estimates that a full 1/3 of all shale projects in the United States become unprofitable once prices fall below $80.
This is a case-by-case basis, however, and is not blanket fact. The Bakken formation in North Dakota, for example, will still be profitable so long as prices do not fall below $42 per barrel – according to the IEA. ScotiaBank’s own research indicates that prices have to stay between $60 to $80 per barrel for the Bakken formation to remain profitable.
Changes in Production and Demand
A large part of the reason why oil prices are continuing to fall has to do with two other significant changes that are impacting the industry: namely, changes to the total amount of oil that the United States and Canada are producing, as well as changes to the demand for oil in areas of the world like Europe and Asia.
According to the International Energy Agency (also commonly referred to as the IEA), shale production in the United States is expected to shift dramatically in the coming years. In scenarios both where oil prices remain roughly where they are and where they continue to fall even farther, the IEA predicts that shale production will still continue to grow, just at a much slower rate than it has been in the last several years. To put that into perspective, production is still expected to increase an additional 950,000+ barrels per day throughout the entirety of 2015.
Another important factor to consider has to do with infrastructure with regards to existing investments. There are a large number of energy companies that have already paid a great deal of money purchasing land, obtaining necessary permits and performing other tasks necessary to drilling. Even if oil prices continue to fall, these companies can’t necessarily curb back on their production or they fear losing an even greater investment than initially feared. In these types of situations, the true “break even” price in production varies depending on the operator and their tolerance versus the amount of debt that they’ve taken on. Even still, it may be too early to tell in many cases how firm those tolerances really are.
The boom in increased oil production in the United States and Canada has created something of a tricky situation for the industry as a whole. After sinking a huge amount of money into infrastructure over the last several years, businesses now have to contend with falling prices that show no signs of slowing down. In order to adapt they will have to look for ways to embrace new technology and streamline production in order to stay profitable well into the future and to break through into a bold new era for the industry as a whole.
This article was originally published in Valuation Viewpoint, January 2015.
Does the Clippers $2 Billion Deal Make Sense?
In recent court testimony, Bank of America – Merrill Lynch (“BoA”) revealed its bid book (“Project Claret”) prepared for potential buyers of a NBA franchise, the Los Angeles Clippers (“Clippers”). We are going to analyze elements within the Project Claret document with a particular focus on the revenue estimate of the local media contract renewal in 2014.
Let’s look at BoA’s estimate of local media revenues primarily related to television content. BoA forecasted television rights payment in June 2014 year-end at $25.8 million from the current contract projecting it to $125 million for a new local media contract. Michael Ozanian of Forbes recently estimated the 2014 new contract amount to most likely be closer to $75 million. I agree with Mr. Ozanian for the following reasons:
- If the Los Angeles Lakers (“Lakers”), back in 2011, signed a local media television rights contract for $5 billion over 25 years, then the average is approximately $200 million a year. Typically these contracts have annual escalation clauses and if the total payout is $5 billion, then the amount in 2012 is close to $100 million for the Lakers. You need to escalate that to about $110 million in 2014.
- The television ratings of the Lakers are multiples of the Clippers and cable subscribers ultimately pay for the right’s fees. So if you are a sophisticated buyer of sports content, like Fox Broadcasting Company or Time Warner Cable, are you going to pay the same dollar amount for the Clippers as you did for the Lakers? The Clippers have ½ the television ratings of the Lakers (1.28 vs 2.72) in the current year. To quote a recent Variety article, “This is believed to be the closest the Clippers have come to the Lakers in television ratings since the 1999-2000 season.” Additionally, the Lakers experienced a very poor win/loss record in the 2013-2014 season. If one analyzed their historical results, the Clippers have less than 1/3 of the viewership as the Lakers (121,000 vs 390,000) last year.
Therefore, how much will the Clippers realistically get in 2014 with the new contract? $75 million is approximately 68% of our estimated Lakers deal amount and seems generous based on the raw ratings numbers. However, if we utilize the Forbes estimate of $75 million in 2014 and the other BoA revenue estimates for game admissions ($62.3 million) and other team revenue ($136.8 million), the total revenue estimate for the Clippers would be $274.1 million in 2014 versus the $324.1 million utilized in BoA Project Claret.
If one assumes a multiple of 5x revenues, which is the high end of multiples paid for an NBA team to date, the indicated enterprise value estimate is $1.370 billion, a far cry from $2 billion. Additionally, many times when dealing with estimates of future results (in this case an estimate of future revenue) the valuation multiple applied should be lower than actual transaction multiples. These multiples are calculated based on historical revenues, which are usually lower than future estimates.
It seems clear to us that based on the data available the $2 billion price from Steve Ballmer is a good deal for the Sterling Trust.
This article was originally published in Valuation Viewpoint, August 2014.
Exploring the Major League Baseball Value Explosion
From 2000 to 2005, Major League Baseball teams were selling for much less than National Football League teams, i.e., typically under $200 million. Most of the MLB teams were showing losses at the time, and there was limited interest in buying the teams that did come up for sale. But the buying and selling environment changed dramatically in 2012, with the Los Angeles Dodgers selling for over $2.15 billion in a spirited auction with sixteen initial bidders.1
What has caused this explosion in MLB prices and do these high prices make sense?
In this article, I attempt to answer this question as I discuss MLB franchise price/value changes in the last fifteen years and whether these dramatic jumps in prices/values make economic/market sense.
First, I illustrate actual transaction prices for MLB teams in the early 2000s. I then show the significant increases—starting in 2008—leading to the blockbuster $2.15 billion Dodgers deal in 2012.
I then demonstrate the value changes published by Forbes Magazine and discuss key economic changes in the industry (i.e. MLB) that have contributed to these price jumps of twice—and sometimes three times—the 2005 prices for MLB franchises.
Finally, I explore the actual financials for the Texas Rangers and a history of the prices paid for the Rangers over the years.
For definition purposes, when we discuss values, we are always discussing enterprise (equity + debt), not equity values, and when we discuss revenue multiples, we are discussing total revenues from team/franchise and stadium interests, but excluding regional sports network (RSN) interests.
Deal Prices and MLB Values Estimated by Forbes Magazine
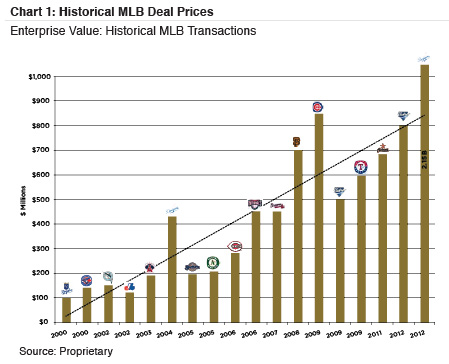
As Chart 1 shows, enterprise prices for MLB teams from 2000 to 2005 were less than $200 million, except for the 2004 Dodgers deal, which came in at $430 million. In 2006, two transactions increased to the low $400 million range. In 2008, a San Francisco Giants deal indicated $700 million, and the Chicago Cubs in 2009 were sold for over $800 million. In 2009 during the “Great Recession,” a smaller market team, the San Diego Padres, transacted at $500 million. Also in 2009, the Texas Rangers sold at $595 million during a bankruptcy bidding war. Finally, the chart shows the big jump with the bankruptcy auction prices of the L.A. Dodgers and their stadium and land at $2.15 billion in 2012.
Changes in Revenue Multiples
Unlike entities in other industries, major league sports teams are usually valued using a market approach rather than an income approach. Most of their enterprise values are referenced as a multiple of team and stadium revenues.
The multiples in revenues paid for actual transactions in the early 2000s were in the 2.0 times to 2.5 times range, but recent deals have been over 4.0 times revenues. The recent 4.0 times multiple reflects anticipated growth in revenues since sophisticated and well-heeled buyers are anticipating significant future revenue growth.
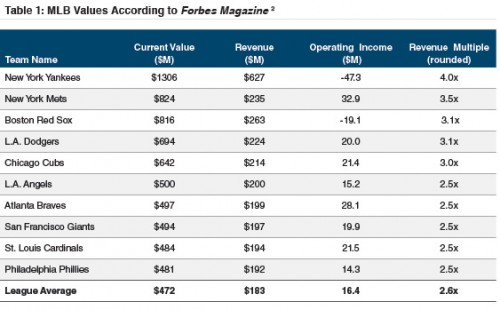
In Table 1, Forbes estimates are developed by Forbes editors utilizing public sources, their proprietary methods of estimating team revenues and expenses, and their judgment as to the valuation multiple to be applied to their revenue estimates.3
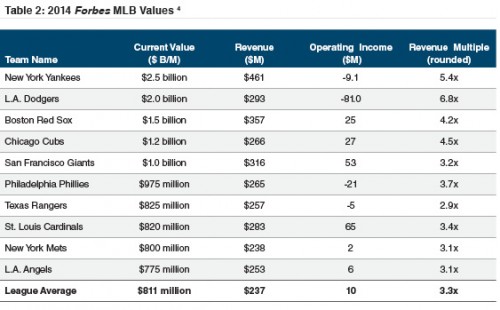
By 2014 (see Table 2), Forbes average MLB value estimate had jumped to $811 million and had a 3.3 times multiple. The values ranged from $2.5 billion for the Yankees to $485 million for the Tampa Bay Rays.
The average revenue estimates for the league have only increased from $183 million to $237 million or thirty percent. Yet the average valuation multiple increased from 2.6 times to 3.3 times causing the average team value to increase sixty-four percent. What caused this significant increase? The answer: potential for increased local revenues due to an explosion in media rights fees.
Meteoric Media Rights Fee Increases
As mentioned earlier, recent media rights fees for local broadcasts of MLB teams have increased three to five times that of older contracts. These older contracts may have been ten years in length, but the new ones can be in force as long as twenty-five years.
Unlike the total revenues for NFL teams and, to a lesser extent, those of the NBA, local media rights fees make up the majority of revenues for MLB teams. In many markets, the content providers (cable and satellite companies) are vying for a unique live product that can differentiate them in the marketplace. This competition has caused bidding wars for TV and other media rights to MLB teams.
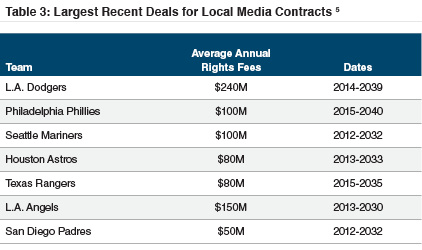
The largest current local MLB media contract was negotiated by the L.A. Dodgers and was recently approved by MLB. In this contract, the L.A. Dodgers will reportedly receive $6 billion after a revenue-sharing split with MLB. This equates to an average of $240 million a year over twenty-five years. The old Dodgers contract was approximately $50 million dollars in its last year.
The next highest are the Texas Rangers and the Houston Astros at $80 million a year on average. In addition, the national TV MLB has jumped also—see Table 3.
It should be noted that part of the massive increase in payments to the L.A. Dodgers by Time Warner Cable is covered by Time Warner’s plan to pass the costs on to other pay TV providers, including Direct TV, Dish Network, Charter Communications, and Cox Communications.
Currently, Time Warner Cable and their providers are deadlocked on the price increases they will pay for airing the L.A. Dodger games. The providers contend that Time Warner’s cable price for their L.A. Dodger sports channel is too high. How this negotiation is settled will affect prices other providers pay nationwide. For example, the Houston Astros RSN has not been picked up by many of the local providers and the RSN has been forced to file for bankruptcy.
Table 4 shows the changes in the MLB National media contracts with the various networks. We note that the ESPN contracts increased from $296 million a year to $700 million a year. The Fox contract increased from $257 million a year to $525 million a year, etc. In short, the new national contracts increased by 120 percent from the other contract.
At the height of the recession, the San Diego Padres sold for $500 million in 2009. It resold in 2012 for $800 million due primarily to a major jump in a local media contract.
Are the teams making so much money that they warranted such a much higher price based on profits? The answer, surprisingly, is “no, not really.”
Case Study: Texas Rangers
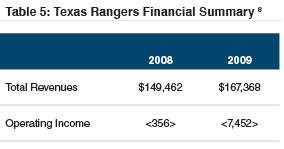
The Texas Rangers sale in 2009 to the highest bidder out of bankruptcy court7 is a good example (Table 5).
Note that these numbers were prior to any regional media contract increases now scheduled to begin with the 2015 season.
Also note that annual amounts shown in the both the local and national contracts are averages and the initial year of the contract is usually much less than the average price shown.
All teams are subject to a player salary cap, which come with significant penalties if violated. So conceptually, if your revenues go up $50 million in a particular year, that amount could fall to the bottom line. How much is $50 million of profit worth to buyers whose primary value driver is not cash flow? It could be $500 million. It could be $1 billion. Which then causes people to wonder how much profit do these teams actually make?
The answer is that many lose money—some significant amounts. Many people ask why anyone would pay these amounts to buy teams if they do not make a reasonable profit.
There are two main answers to that:
- Every buyer has a different motivation.
- Few of us can look at “investments” through the lens of a multi-billionaire to whom a $10 to $50 million annual loss is not significant to their financial well-being.
Texas Rangers Price History
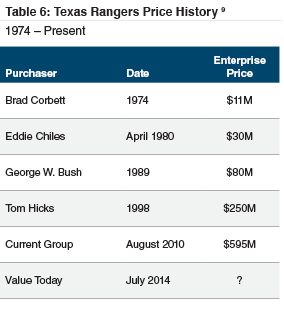
The Texas Rangers also provide a good example of transaction price changes in the MLB. Table 6 shows the transactions in the team since 1974.
Please note that in the $595 million 2010 transaction, the team was making very little money and with signing bonuses deducted, was not cash flow positive. What is the value of this team, considering such facts?
Conclusion
The intensity of local revenues for MLB has created a perfect storm for MLB teams as the media engages in a buying frenzy for live local sports entertainment.
Multiples of 4.0 times revenues are now becoming the new normal versus 2.0 times prior to 2006 driven by local revenue growth with media leading the way. Media contracts are increasing three to five times the annual amounts negotiated in the early to mid-2000s. The outlook for increased local media contracts will create new and higher MLB club transactions for years to come.
But what about value creation? In the case of the Dodgers, if their media revenue increases up hypothetically $200 million a year from the previous contract, how much increase in value will that create? Could it be an extra billion dollars or more? At the end of the day, these local media contract increases, coupled with the new increased national media contracts, generally tend to support the new much higher level of MLB prices.
Obviously, the smaller markets do not enjoy the same increases as the major markets like Los Angeles and New York, etc., but their new contracts will increase in multiples of older contracts i.e., from $15 to $20 million a year to $50 million plus as media providers compete for the exclusive content that live sports provides.
This article was originally published in The Value Examiner, September/October 2014.
Endnotes
- Brian Solomon, “$2 Billion Dodgers Sale Tops List of Most Expensive Sports Team Purchases Ever,” Forbes Magazine, March 29, 2012, http://www.forbes. com/sites/briansolomon/2012/03/29/2-billion-dodgers-sale-tops-list-ofmost-expensive-sports-team-purchases-ever/.
- Michael K. Ozanian and Kurt Badenhausen, “The Business of Baseball,” Forbes Magazine, April 16, 2008, http: http://www.forbes.com/2008/04/16/baseballteam-values-biz-sports-baseball08-cx_mo_kb_0416baseballintro.html. Note the remaining nineteen teams are shown on the NACVA website at http://www.nacva.com/examiner/14-SO-Charts.asp.
- Until recently, Forbes was the only public source of estimates for major league sports teams. They have been developing revenue, profit, and value estimates for over seventeen years. Numbers are as of Dec. 31, 2013.
- Mike Ozanian, “Baseball Team Values 2014 Led by New York Yankees at $2.5 Billion,” Forbes Magazine, March 26, 2014, http://www.forbes.com/sites/mikeozanian/2014/03/26/baseball-team-values-2014-led-by-newyork-yankees-at-2-5-billion/.
- Sources: Proprietary team sources.
- 6 Christina Settimi, “Baseball Scores 12 Billion in Baseball Deals,” Forbes Magazine, October 2, 2012, www.forbes.com.
- Bankruptcy Court For The Northern District Of Texas Fort Worth Division, Texas Rangers Baseball Partners, Chapter 11, Case No. 10-43400-DML.
- Source: Proprietary
- Source: Proprietary
Are There Really 2 NHLs?
This article was originally published in Valuation Viewpoint, October 2014. Mercer Capital is the leader in professional sports valuation. In an increasingly competitive professional, Mercer Capital’s capabilities in franchise valuation, divorce litigation, purchase price allocations, stadium issues, and legal consulting are unsurpassed. We have deep industry knowledge and experience and a deep bench of professionals ready to help. For more information, visit our Professional Sports Industry landing page.
When it comes to the four major league sports (NFL, MLB, NBA, NHL), the NBA and MLB have had less success in Canada vs. the USA, primarily due to demographics. With the exception of Toronto, most of the cities tend to be smaller and have fewer corporate headquarters relative to U.S. cities. Currently there is only one NBA and one MLB team in Canada, both in Toronto.
There is one major league sport, however, that is thriving in Canada, the National Hockey League (“NHL”). The NHL teams in Vancouver, Calgary, Edmonton, Winnipeg, Ottawa, Toronto and Montreal are doing very well. In fact, they’re doing much better on average than their U.S. counterpart cities that have much larger populations (i.e. Dallas and Atlanta which is now a former NHL city). So much so that one may say there are really two NHLs, the Canadian NHL and the U.S. NHL.
How can that be?
Let’s look at the estimated 2013 franchise values of the teams as published by Forbes magazine. Three of the seven Canadien teams are in the top four of league franchise values. The Toronto Maple Leafs are first at $1.2 billion, the Montreal Canadiens third at $775 million and the Vancouver Canucks fourth at $700 million. The NHL league average is $413 million. The remaining Canadian teams are valued as follows:
- (#11) Calgary Flames $420 million
- (#14) Edmonton Oilers $400 million
- (#15) Ottawa Senators $380 million
- (#16) Winnipeg Jets $340 million
Our home team, the Dallas Stars, comes in at $333 million and the Columbus Blue Jackets rank last at $175 million.
Now some interesting numbers: the seven Canadian teams feature values averaging $595 million, while the 23 American NHL teams average $358 million. That’s a little over half of the Canadian teams.
How can the New York Islanders, with a metropolitan statistical area (“MSA”) population of 19.9 million, be worth $195 million, while the Winnipeg Jets, with an MSA population of 0.7 million, are valued at $340 million? Additionally how can Vancouver, with a MSA population of 2.3 million, be valued at $700 million? The franchise value relationship with MSA population does not directly correlate. How can this be?
The answer is the popularity of hockey in Canada has no comparison to most U.S. cities. Hockey is the national sport of Canada. Kids grow up playing it, watching it and living it. That culture creates much greater revenue and profits for their teams. This can be demonstrated by analyzing the national television revenues and the local revenues of NHL teams.
NHL: National Television Revenues
The U.S. has a population of 319 million people vs. 35 million for Canada, yet the national TV rights for the NHL in Canada was recently won by Rogers Communications for $5.2 billion over 12 years, or an average of $433 million a year. This compares to the $2 billion, 10-year NBC U.S. deal which averages $200 million per year. In addition, 65% of the Canadian national TV rights will be shared with the 23 U.S. teams. It is interesting that a country with one-tenth the population gets about 2.2 times the national TV revenues compared to the U.S. and then has to share with the U.S. teams.
NHL: Local Revenues
Local TV rights are retained by the teams, as are other local revenues from suites, sponsorship and ticket revenues. Here again, the Canadian teams far outshine the U.S. teams. Forbes estimates the average NHL ticket prices in Canada for six out of the seven teams was $70 for non-premium tickets. Forbes estimated that small markets, Edmonton and Calgary, each had $1.6 million in annual ticket revenues. Compare that figure with the New York Rangers ticket revenue of $1.8 million, and that comparison is shocking (if that is not shocking to you, please compare populations of the three cities). Additionally, local television viewing shows the same type of comparisons as national TV viewing. Therefore, smaller Canadian markets like Vancouver will have multiples of local TV revenue when compared to a larger U.S. market, like Dallas.
Conclusion
In conclusion, after considering the numbers, it is hard to make a case for franchise value comparison between Canadian and U.S. NHL teams. Clearly, the economics indicate there are two different NHLs.
NBA Team Values: Three Ways Cuban and his Owner Bretheren are Cashing In
In a recent article Mark Cuban commented how media revenues will push National Basketball Association (“NBA”) valuations far higher than they are currently. “If we do this right, it’s not inconceivable that every NBA franchise will be worth more than $1 billion within ten years,” he was quoted as saying. While that observation could be on the money, it’s not the only engine that drives NBA team values. NBA franchises are unique properties that are often among the most attractive and reported upon assets in the US (and globally for that matter thanks to Mr. Prokhorov). The undergirding economics of these teams are complex and nuanced. When value drivers align, good things happen and value is unlocked. Like a flywheel with momentum, certain dynamics can push values upward quickly. However, the same dynamics can push the flywheel off its hinges, bringing values crashing down. It’s an exciting property that doesn’t always follow the path of conventional valuation theory, which might be a reason why a Maverick like Mark Cuban loves it so much.
NBA franchise values have recently gone in an upward direction as evidenced by the Sacramento Kings’ $534 million sale in January 2013. That’s quite a figure for the 27th ranked metropolitan statistical area (“MSA”) in the country. This transaction is especially fascinating in light of the Philadelphia 76ers (5th largest MSA) selling for only $280 million just 18 months earlier. What fuels such a vast difference? We explore three issues that contribute considerably to these variances – media rights, arena lease structure, and the NBA’s collective bargaining agreement (“CBA”). Some of these factors are more within an owner’s control than others, but all of them contribute to situational changes that valuations hinge upon. We’ll also explore the tale of two transactions: the 76ers and Kings, to see why and how these factors influence the purchase price.
Media Rights: The Quest for Live Content
It is important to note the majority of NBA team revenues come from local sources, (i.e. game day revenues and local media contracts). The most dynamic (and thus value changing) of these sources in the past few years has been local media rights. National media revenues in NBA are significant but are a much lower percentage of total revenues than the biggest league in North America, the NFL. According to Forbes, the 30 NBA teams collectively generated $628 million from local media last season (about $21 million average per team). In addition, national revenues from ESPN, ABC & TNT total $930 million per year and these deals expire in 2015-2016. It’s a relatively balanced mix compared to the other major leagues. NHL & MLB’s media revenues are more locally focused, while the NFL is nationally dominated.
Basketball’s popularity has grown in recent years. This, coupled with intense media competition for quality live content, has fueled increased media contracts in many markets at unprecedented levels (300% to 500%) over prior contracts.
Live sports programming has a relatively fixed supply and is experiencing increased demand from networks looking for content those viewers will watch live. This commands higher advertising dollars compared to content that is consumed over DVRs and online forms (Netflix, Hulu Plus, Amazon Prime, etc.). Content providers also covet the low production costs and favorable demographics of younger fans. These factors, among other variables, have helped fuel the rapid price increases for sports media rights.
Recently, new media rights contracts across all sports programming have soared to record high annual payout levels. The NHL signed two new TV deals in April 2011 which more than doubled the league’s previous annual payouts with an upfront payment of $142 million. Even the media rights for Wimbledon have seen an increase in the amount of suitors. The NBA’s current national deal expires in a couple of years (2016). Many people expect that the next deal’s value will at least double the current agreement. [Side note: In negotiations that date back to the 70’s ABA/NBA merger, two brothers – Ozzie and Daniel Silna, received a direct portion of the NBA’s national TV revenues – in perpetuity. That’s right…perpetuity. In January 2014 they agreed to a $500 million upfront payment from the NBA and a pathway to eventually buy them out completely. The old transaction has withstood litigation and it has been termed as ‘the greatest sports business deal of all time’]
At the local level, in 2011 the Los Angeles Lakers signed the richest television deal in the NBA which dwarfs other teams. The contract reportedly averages $200 million per year for 20 years. The upper tier NBA franchises historically have received $25 to $35 million annually. Some big market teams have expiring contracts in the next few years, such as the Mavericks. While bidding has not yet begun, it’s reasonable to expect Mr. Cuban and his Mavericks to anticipate a healthy bump in rights fees in the future assuming good counsel and creative structuring.
How did these factors translate to the Kings and 76ers? Even with substantial MSA differences, they were at opposite ends of the media spectrum. The Kings’ deal with CSN California expires after this season, which put ownership in strong position to negotiate a new deal at the time of the transaction. The 76ers signed a 20 year contract in 2009 with Comcast Sports Net, which was reported by Forbes to be “undervalued” from the 76ers perspective, reportedly paying the team less than $12 million the season prior to purchase. That’s quite a difference and it almost surely played a pertinent role the Kings’ and 76ers’ valuations.
Arena Lease and Structure: Slicing Up the Game Day Pie
In the NBA, game day and arena revenue typically make up the lion’s share of a franchise’s income. These revenue streams filter up from a multitude of sources. Aside from regular ticket sales there are club seats, suites, naming rights, parking, concessions, merchandise, and sponsorship revenue. In addition there are non-game revenues such as concerts, events and meetings. On the expense side there’s rent (fixed or variable), revenue sharing (or a hybrid arrangement), capital expenditures, maintenance, overhead allocation and more. All of these aspects are negotiable among the business, municipal, and legal teams involved.
Arena deal structures vary across the board. For example, the Detroit Pistons own The Palace at Auburn Hills while the Golden State Warriors are tenants at Oracle Arena (probably until 2017/2018 anyway). Most arena structures involve some form of public/private partnership. One common theme is public ownership, usually financed via local bonds, with the sports franchise as a tenant paying rent of some form. The chief aspect to consider for legal teams is how to structure agreements for the various revenue streams, expense and capital items.
Historically, some of the most negotiated aspects to the arena lease are how proceeds from certain items as defined by the CBA are allocated. For example, while players as a group receive a flat percentage of basketball related income (“BRI”), they receive reduced percentages of others, such as luxury suites and arena naming rights. This nuance represents an opportunity for team ownership to retain a larger portion of these revenues and legal teams to employ shrewd negotiating tactics. In addition, as the arenas age and significant maintenance costs are required, cost sharing between the public/private partnerships can become an issue. Lease structure also can make outright ownership of a stadium appear less attractive without a partner to share or bear costs.
Again as we examine the Kings and 76ers a contrasting picture emerges. Prior Kings’ ownership (the Maloofs) and the city could not reach an agreement on a new stadium lease after nearly a decade of negotiations. Initially there was a buying group that planned to move the team to Seattle, but then, new local ownership purchased the team (with substantial input from the NBA). This agreement included an agreement for a new $447 million stadium (the majority funded publicly) and a guarantee to keep the team in Sacramento. This new deal was reported to be more favorable to ownership and gives the franchise an opportunity to attract more fans and create refreshed revenue channels. The 76ers on the other hand had already been locked into a long term lease at less favorable terms that were more geared towards revenue sharing with Comcast. Again, the Kings’ new opportunity appears more attractive than the 76ers existing arrangement.
Collective Bargaining Agreement: Leveling the Playing Field
On December 8, 2011, after a 161 day lockout, the NBA and its player union reached a new collective bargaining agreement. This agreement brought about meaningful changes to the salary structures, luxury tax, BRI, and free agency (among other things). Although the CBA is not under direct control of a franchise owner, its impact on competiveness, team operational strategy and expense management is significant.
The changes were important for owners, who had reportedly lost over $300 million annually as a group in the three prior years to the negotiations. From a valuation perspective three items deserve focus: (i) length, (ii) BRI, and (iii) luxury tax provisions. Prior to the agreement, there was a great deal of uncertainty as to how negotiations would play out. Uncertainty infers risk and where there’s more risk, values usually fall. The 10 year agreement (with a 2017 opt-out) brings stability to both players and owners as to what operating structure they can plan for the near to intermediate term future. In addition, BRI revenue splits to the players were lowered from 57% of BRI to around 50% for most of the contract. This split brings cash flow relief (but not competitive relief) to owners across the league. Lastly, the luxury tax structure became much more punitive for big-spending owners, like Cuban. In fact, it economically functions similarly to a hard salary cap that the NFL and NHL employ. In light of this change, NBA franchises have committed an enormous amount of time and resources to understand and execute an appropriate competitive strategy. The luxury tax provisions even the competitive playing field for smaller market teams such as Sacramento and the Memphis Grizzlies (who sold for a reported $377 million in October 2012) and constrains the spending of larger market teams such as the Mavericks, Lakers or Knicks.
How did this facet play out with the Kings and 76ers? All one needs to know is that the 76ers were sold before the new CBA was agreed (Summer 2011) to and the Kings were sold after the CBA was in effect (January 2013). Timing, coupled with the Kings small market status, has an increasingly positive effect on them compared to the 76ers. Advantage: Kings.
Takeaway: NBA Boats Don’t Necessarily Need the Tide to Rise (or Fall)
NBA franchise values are on the rise. There is a buzz around the league that if there were teams on the market the price would be robust right now. The values are driven by a number of different factors (TV, arena rights, CBA), some that cannot be controlled by owners and their advisory teams, but others that can be. Don’t be fooled by market size. A value creation scenario can occur in almost any market. In one of the smallest markets in the country, Tom Benson paid more for the Hornets than Josh Harris’ group did for the 76ers. However, owner involvement, savvy counsel and careful negotiations are a must; because as some transactions have shown, there are no guarantees.
This article was originally published in The Texas Lawbook in March 2014.
2015 Bank M&A Recap
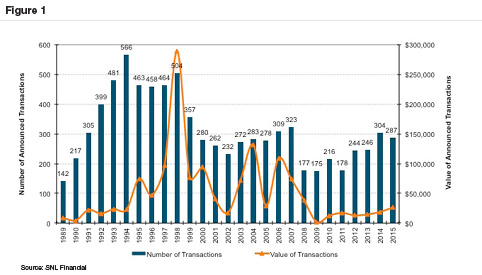
Statistics can be deceptive. The bank M&A market in 2015 could be described as steady, bereft of any blockbuster deals. According to SNL Financial 287 depositories (253 commercial banks and 34 thrifts) agreed to be acquired in 2015 compared to 304 in 2014 and 246 in 2013. Since 1990, the peak in M&A transactions occurred in 1994 (566) followed by 1998 (504). For those who do not remember, 1998 was the blockbuster year when NationsBank/Bank of America, Norwest/Wells Fargo, Bank One/First Chicago NBD and SunTrust Banks/Crestar Financial among others agreed to merge (Figure 1).
There has been a cumulative impact of M&A activity over the years. As of September 30, 2015, there were 6,270 insured depositories compared to about 18,000 institutions in 1985 when interstate banking laws were liberalized. M&A activity when measured by the number of transactions obviously has declined; however, that is not true on a relative basis. Since 1990, the number of institutions that agreed to be acquired in non-assisted deals ranged between 1.4% (1990) and 4.6% (1998) with an overall median of 3.2%. Last year was an active year by this measure, with 4.4% of the industry absorbed, as was 2013 (4.5%).
What accounts for the activity? The most important factors we see are (a) good asset quality; (b) currency strength for many publicly traded buyers; (c) very low borrowing costs; (d) excess capital among buyers; and (e) ongoing earnings pressure due to heightened regulatory costs and very low interest rates. Two of these factors were important during the 1990s. Asset quality dramatically improved following the 1990 recession while valuations of publicly traded banks trended higher through mid-1998 as M&A fever came to dominate investor psychology.
Today the majority of M&A activity involves sellers with $100 million to $1 billion of assets. According to the FDIC non-current loans and ORE for this group declined to 1.20% of assets as of September 30 from 1.58% in 2014. The most active subset of publicly traded banks that constitute acquirers is “small cap” banks. The SNL Small Cap U.S. Bank Index rose 9.2% during 2015 and finished the year trading for 17x trailing 12 month earnings. By way of comparison, SNL’s Large Cap U.S. Bank Index declined 1.3% and traded for 12x earnings. Strong acquisition currencies and few(er) problem assets of would-be sellers are a potent combination for deal making.
Earnings pressure due to both the low level of rates (vs. the shape of the yield curve) and post-crisis regulatory burdens are industry-wide issues. Small banks do not have any viable means to offset the pressure absent becoming an acquirer to gain efficiencies or elect to sell. Many chose the latter. The Fed may have nudged a few more boards to make the decision to sell by delaying the decision to raise short rates until December rather than June or September when the market expected it to do so. “Lift-off” and the attendant lift in NIMs may prove to be a non-starter if the Fed is on a path to a one-done rate hike cycle.
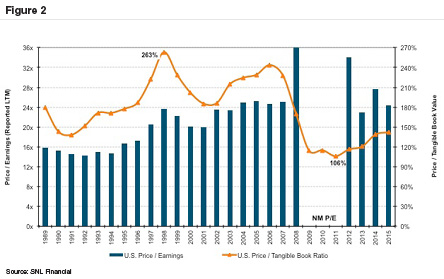
As shown in Figure 2, pricing in terms of the average price/tangible book multiple increased nominally to 142% in 2015 from 139% in 2014. The more notable improvement occurred in 2014 when compared to 2013 and 2012, which is not surprising given the sharp drop in NPAs during 2011-2013. The median P/E multiple was 24x, down from 28x in 2014 and comparable to 23x in 2013. The lower P/E multiple reflected the somewhat better earnings of sellers in which pricing was reported with a median ROA of 0.65% compared to 0.55% in 2014. Although the data is somewhat murky, we believe acquirers typically pay on the order of 10-13x core earnings plus fully-phased-in, after-tax expense savings.
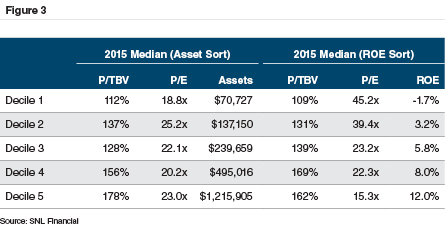
Figure 3 provides perspective on pricing based upon size and profitability as measured by LTM ROE. Not surprisingly, larger and more profitable companies obtained better pricing in terms of the P/TBV ratio; however, as profitability increases the P/E multiple tends to decline. That is not surprising because a higher earning bank should have fewer issues that depress current earnings.
The other notable development in 2015 was the return of non-SIFI large banks to the M&A market after largely being absent since the financial crisis as management and regulators sorted through the changes that the Dodd-Frank Act mandated. BB&T Corporation, which is among the very best acquirers, followed-up its 2014 acquisitions for Bank of Kentucky Financial Corp. and Susquehanna Bancshares with an agreement to acquire Pennsylvania-based National Penn Bancshares. The three transactions added about $30 billion of assets to an existing base of about $180 billion. Other notable deals included KeyCorp agreeing to acquire First Niagara ($39 billion) and Royal Bank of Canada agreeing to acquire City National Corporation ($32 billion). Also, M&T Bancorp was granted approval by the Federal Reserve to acquire Hudson City Bancorp ($44 billion) three years after announcing the transaction.
To get a sense as to how the world has changed, consider that the ten largest transactions in 2015 accounted for $17 billion of the $26 billion of transaction value compared to $9 billion of $19 billion in 2014. The amounts are miniscule compared to 1998 when the ten largest transactions accounted for $254 billion of $289 billion of announced deals that year.
Law firm Wachtell, Lipton, Rosen & Katz (“Wachtell”) noted that with the approval of several large deals this year there is more certainty to the regulatory approval process and there is no policy to impede bank mergers x-the SIFI banks. A key threshold for would-be sellers and would-be buyers from a decision process has been $10 billion of assets (and $50 billion) given enhanced regulatory oversight and debit card interchange fee limitation that applies for institutions over $10 billion. Wachtell cited the threshold as an important consideration for National Penn’s board in its decision to sell to BB&T.
There were a couple of other nuances to note. While not always true, publicly-traded buyers did not receive the same degree of “pop” in their share prices when a transaction was announced as was the case in 2012 and 2013. The pops were unusual because buyers’ share prices typically are flat to lower on the news of an announcement. Several years ago the market view was that buyers were acquiring “growth” in a no-growth environment and were likely acquiring banks whose asset quality problems would soon fade.
Also, the rebound in real estate values and resumption of pronounced migration in the U.S. to warmer climates facilitated a pick-up in M&A activity in states such as Georgia (11 deals) and the perennial land of opportunity and periodic busts—Florida (21). The recovery in the banking sector in once troubled Illinois was reflected in 25 transactions followed by 20 in California.
As 2016 gets underway, pronounced weakness in equity and corporate bond markets if sustained will cause deal activity to slow. Exchange ratios are hard to set when share prices are volatile, and boards of sellers have a hard time accepting a lower nominal price when the buyer’s shares have fallen. Debt financing that has been readily available may be tougher to obtain this year if the market remains unsettled.
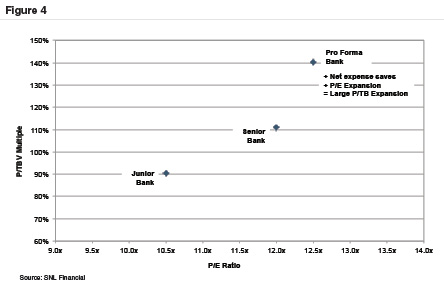
Whether selling or merging, we note for the surviving entity a key goal should be something akin to Figure 4 in which there is shared upside for both the acquirer’s and seller’s shareholders (assuming a merger structured as a share exchange). A well-structured and well-executed transaction can improve the pro forma bank’s profitability and growth prospects. If so, all shareholders may benefit not only from EPS accretion, but also multiple expansion.
We at Mercer Capital have over 30 years of experience of working with banks to assess transactions, ranging from valuation to issuing fairness opinions in addition to helping assess the strategic position (e.g., sell now vs. sell later). Please call if we can help your institution evaluate a significant corporate transaction.
Recent Trends in Agricultural Production Lending
Although farm income is projected to decline for a second consecutive year in 2015, farmers and the broader agricultural industry have had a great run since the Great Recession. The agricultural lending industry? Not so much.
Call it one of the age old conundrums of being in the business of lending money – those to whom you feel most comfortable lending are the least likely to need your services. Such has been the case for several years in the broader agricultural economy. Sure, there have been some farmers and ranchers willing to take advantage of low interest rates to increase leverage and enjoy the associated higher returns on equity and a larger fixed asset base with more profit potential. However, the painful deleveraging associated with the Great Recession left no sector of the economy untouched. Agricultural producers were no exception, with many eschewing debt in favor of fiscal conservatism.
This conservatism among most farmers is contrasted with foreign investors seeking U.S. assets and institutional investors who drove land prices to record level in many areas by 2013. The prices paid implied these investors were oblivious to generating an acceptable return. Elevated land prices have led to concerns among some that lenders could be exposed should land prices fall sharply with a secondary impact on production-related collateral values in a replay of the 1980s bust in the farm sector following the inflation and borrowing binge that occurred during the 1970s.
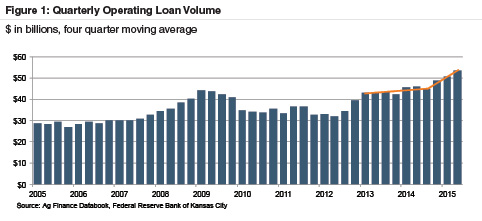
As for production-related lending, record yields and crop prices left many producers so flush with cash that borrowing needs declined. Data from the Federal Reserve Bank of Kansas City reveals a steadily declining trend in operating loan volumes at commercial banks over the 2009 to 2012 period (Figure 1). The second half of 2012 showed a rapid rise in loan volumes, but since then agricultural production loans have grown at a relatively slow pace – until recently, that is.
Volume Growth Picks Up Steam
A number of factors have finally reversed course, leading to a notable uptick in demand for financing and an expectation that ag production loan demand will remain strong in the near- term. While real estate agriculture loans also have increased, lending dollar volume in that area has been influenced by the substantial increase in farmland values in recent years. The discussion which follows focuses on production, or operating, lending.
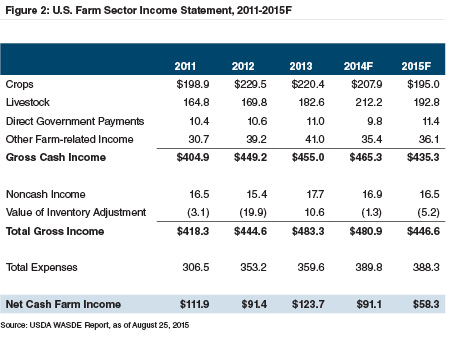
Several years of record crop yields and high commodity prices left farmers and ranchers with little need for operating loans. However, crop receipts are expected to decline by approximately 6% in 2015 and livestock receipts are expected to decline 9%. These declines will be modestly offset by an increase in direct government payments and other income. However, input expenses should remain stable, primarily reflecting higher costs for livestock purchases and labor offset by lower energy costs, leading to an expected 36% decline in net farm income. This decline comes on the heels of a 26% decline in 2014 (Figure 2).
Throughout 2014 producers had the luxury of strong balance sheets, allowing them to avoid significant operating debt despite the downturn in net income for that year. However, during 2015 the cash cushions built up during the commodity boom will begin to be depleted, leaving many producers with little choice but to finance short-term capital investment and input costs with borrowings.
Rates Hold Steady – For Now
The average effective interest rate on non-real estate bank loans to farmers declined from 5.6% in 2008 to 3.8% in 2014, but has shown two consecutive quarter over quarter increases (albeit modest) in the first half of 2015 and measured 4.1% in second quarter 2015. One possible explanation for this slight uptick is that as demand has picked up banks have regained the smallest amount of pricing power. Alternatively, it may be the case that the average borrower credit profile has deteriorated slightly as the industry comes off its highs from the recent commodity pricing boom.
Despite the low rates, ag production loans can be very attractive from an interest rate risk standpoint, as most of the loans renew annually allowing for more rapid adjustment when rates (finally) begin to rise. That said, oftentimes collateral used for non-real estate agricultural loans is less desirable, thus increasing the risk of the loan if it were to fail.
Producers Lock in Fixed Rates
There is an argument to be made that all of the factors affecting loan volume mentioned above are just noise, and producers are simply doing what mainstream America has been doing with residential mortgages for years – locking in these once-in-a-lifetime rates while they still can. The share of floating rate loans made by banks for non-real estate agricultural purposes fell to at least a 15-year low (60%) in the first quarter of 2015. Although it increased to 70.8% in the second quarter, that level remains well below the average exhibited since 2000.
Fixed rate loans are most commonly used for non-feeder livestock production and machinery and equipment, while floating rate loans are more common for shorter-term financing used for feeder livestock (typically sold to a feedlot within one year of age) and current operating and production expenses (including crop production).
Alternative Sources of Lending
The amount of debt supporting the U.S. agricultural system is vast, and commercial banks are by no means the only player in town. The Farm Credit System (FCS), for example, funds approximately 39% of all U.S. farm business debt (according to the USDA) and commercial banks must compete with farm credit system banks for all types of agriculture and in all 50 states. While Call Report data compiled by the Federal Reserve Bank of Kansas City shows rapid recent growth in non-real estate ag lending at commercial banks, financial data from FCS paints a slightly different picture.
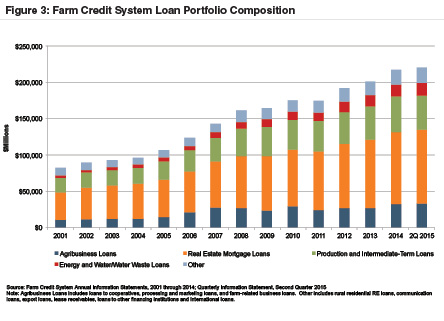
Figure 3 shows steady total FCS loan growth since 2001. However, loan growth in the first half of 2015 was nearly flat, and production and intermediate term loans actually declined relative to year-end 2014. FCS states this decline was driven by borrowers’ tax planning strategies at the end of 2014, resulting in significant repayments in early 2015, as well as a high level of seasonal pay-downs in the first quarter. It’s difficult to draw the conclusion, however, that this data indicates a shift in market share away from FCS toward commercial banks, given classification, measurement and timing differences. It’s worth noting that FCS relies primarily on the public debt markets for its balance sheet funding and these costs increased modestly in the first half of 2015 relative to the same period in 2014.
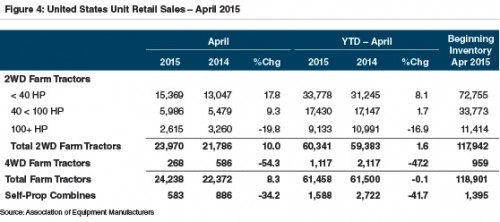
Another source of credit for the agricultural industry is financing provided by heavy equipment dealers and manufacturers. Equipment loan volume can be influenced by commodity cycles somewhat differently than for other operating loans. Producers generally prefer to invest in new equipment when times are good and net incomes are strong, electing to postpone larger capital purchases and make do with aging equipment in times of falling incomes. This effect has played out in the first part of 2015, with rather significant sales declines in what is normally an active period of highly seasonal buying patterns (Figure 4).
Implications for Asset Quality
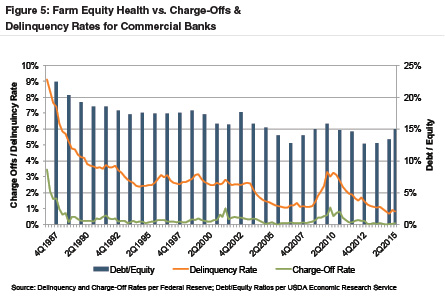
Since peaking in late 2009, delinquency and charge-off rates on ag production loans held by commercial banks have fallen consistently and dramatically, and for second quarter 2015 measured 0.81% and 0.09% (seasonally adjusted), respectively. Asset quality data from FCS exhibits a similar trend. As shown in Figure 5, delinquencies and charge-offs tend to be closely correlated with the health of farm balance sheets, which is not surprising.
We note an interesting trend since the end of 2012 in which this relationship appears to have broken down. Farm debt to equity ratios are increasing, while delinquencies and charge-offs continue to decline. Is this a harbinger of things to come? It’s probably too soon to tell, as the agriculture industry is highly susceptible to completely unpredictable events, such as weather patterns, and the health of the overall global economy (also not an easy prediction these days). One thing is certain, the trend is not sustainable indefinitely.
Another issue with the comparability of recent trends to previous points in the long-term historical agriculture cycle is the impact that the dramatic increase in land values has had on farm equity since 2009. A portion of the rise in debt to equity ratios in recent periods is not due to an increase in debt, but rather recent declines in land values (falling asset values will increase debt/equity ratios, all else equal). If land values continue to decline from their historical highs (which most reliable sources predict), and farm debt continues to increase (which all of the factors discussed above would indicate) then leverage ratios will be further strained in the coming quarters and years. Current charge-off rates are de minimis to the point where an increase in asset quality issues related to agricultural production loans will be easily absorbed by all but the most concentrated ag lenders. That said, it bears watching to see if these trends become more sustained and have deeper implications for both agricultural lending and the broader agricultural economy.
August Market Performance & Augustus Caesar
In contemplating August’s market activity, our thoughts drifted to Roman times. In 45 B.C., the Roman Senate honored Julius Caesar by placing his name on the month then known, somewhat drably, as Quintilis. Later, the Senate determined that Augustus Caesar deserved similar recognition, placing his name on the month after July. But this created an immediate issue in the pecking order of Roman rulers – up until then, months alternated between having 30 and 31 days. With July having 31 days, poor Augustus’ stature was diminished by placing his name on a month having only 30 days. To rectify this injustice, the Senate decreed that August also have 31 days, accomplished by borrowing a day from February and shifting other months such that September only had 30 days (to avoid having three consecutive 31-day months).
We provide this historical interlude to illustrate that, while July and August now are equivalent in terms of the number of days, the market environment in these two months during 2015 bore few similarities. In August, volatility returned, commodity prices sank, and expectations of Federal Reserve interest rate action in September diminished.
Most broad stock market indices declined between 6% and 7% in August, taking the indices generally to negative territory year-to-date in 2015. As indicated in Figure 1, except for the largest banks, publicly-traded banks generally outperformed the broader market, both year-to-date in 2015 and in August specifically.
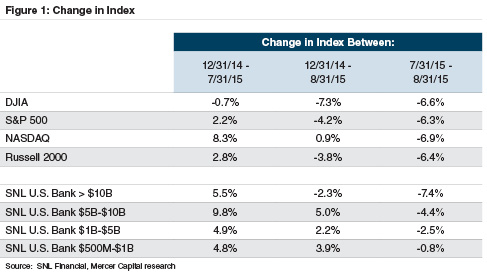
For the year, banks benefited from several factors. First, investors appear to expect that rising interest rates will, if not enhance banks’ earnings, at least prove to be a neutral factor. Other sectors of the market, though, may be less fortunate, as companies face higher interest payments or other adverse effects of higher interest rates. Second, banks generally reported steady growth in earnings per share, as assisted by a benign credit environment.
Within any index, though, the performance of individual companies may vary greatly. Seeking to isolate factors influencing the August market performance, we focused on publicly-traded banks with assets between $500 million and $5 billion. Given the market backdrop, these 212 banks performed relatively well in August, with a median share price depreciation of only 1.1% (see Figure 2). For the year, the median bank reported a 2.9% increase in its stock price.
While linking company-specific factors to market performance during a volatile period is difficult, we identified three groups of banks that underperformed in August:
- After losing investor favor in the second half of 2014, banks in the oil patch states of Louisiana, Oklahoma, and Texas performed well in 2015, advancing by 9% between December 31, 2014 and July 31, 2015. However, oil prices falling below $40/barrel dealt these banks a setback in August, as the median share prices of banks in these states fell by 5%.
- All the banks that completed IPOs during 2015 fell during August, with a median depreciation of 6%. Nevertheless, post-IPO performance remains favorable, as all the banks reported share prices at August 31, 2015 that exceeded their IPO prices by 10% to 20%. Investors in these banks may have wished to realize profits during a volatile period.
- Banks identified with Asian American communities also suffered, owing to their perceived greater exposure to slowing economies in China and throughout the Asian region. Even after the August decline, though, these banks have reported solid performance in 2015.
Several risks that influenced August’s volatility have not dissipated, including uncertainty surrounding China’s opaque (and potentially over-leveraged) economy and the effect of any Fed policy tightening. Analyst estimates for 2016 EPS often suggest favorable growth over 2015, and such estimates bear watching to the extent that the recent market volatility spills over into the real economy.
Strategic Planning for Community Banks on the Mend
Despite much commentary about the significant economic and regulatory headwinds impacting community banks, profitability is on the mend. Community bank earnings improved in the trailing twelve months ended June 30, 2015 with net income up 14% to $17.6 billion compared to $15.5 billion in the twelve months ended June 30, 2014.1 Nearly 60% of community banks reported higher profitability based upon annualized first half 2015 net income compared to 2014 levels. The number of unprofitable banks also declined to 41 in the second quarter of 2015, compared to 109 in 2014 and 167 in 2013. The median return on assets (ROA) for community banks was up to 0.96% (annualized based upon the first half of 2015), which was the highest level since 2008.
As detailed in Figure 1, key contributors to improving earnings were higher net interest income and lower loan loss provisions. Loan growth drove the improvement in net interest income as 84% of community banks reported loan growth in the trailing twelve month period, with the median community bank’s loan growth rate reported at 7.2%. Loan growth offset net interest margin (“NIM”) compression as NIMs were at their lowest level over the 10-year historical period. As the Federal Reserve’s zero-interest rate policy (“ZIRP”) grinds on, asset yields continue to compress while funding costs have essentially reached a floor. One interesting item to gauge in future quarters is how much interest rate and credit risk is being taken by community banks to grow loans and earnings.
Another sign of improving community bank health is that deal activity is up from recent prior periods as shown in Figure 2. Price/earnings multiples have also improved in recent periods (Figure 3) and appear to be relatively in line with long-term trends at approximately 20x. Price/tangible book multiples are still below longer-term trends, largely reflecting that although improved from the Great Recession returns on assets and equity remain below pre-financial crisis levels.
While it is difficult to tell whether community bank earnings have peaked and how long this cycle may last, improving profitability expands the strategic options available to community banks. A recent article by SNL Financial noted that a number of community banks are looking to sell as earnings may have plateaued. While selling is one option available to community banks in this environment, the range of strategic options available is much broader than that. A well-rounded strategic planning session should include an assessment of the bank’s unique strengths, weaknesses, and opportunities as well as a review of the bank’s performance and outlook relative to both its history and peers. Then, a broader discussion of a range of options that can deliver growth and enhance shareholder value should be discussed. Those other options could include organic and/or acquisitive growth and other ways to provide liquidity and enhance returns to shareholders such as special dividends, share repurchases, management buy-outs, and employee stock ownership plans.
Founded in 1982, in the midst of and in response to a previous crisis affecting the financial services industry, Mercer Capital has witnessed the industry’s cycles. Despite industry cycles, Mercer Capital’s approach has remained the same – understanding key factors driving the industry, identifying the impact of industry trends on our clients, and delivering a reasoned and supported analysis in light of industry and client specific trends.
Mercer Capital has experience facilitating strategic planning sessions for community banks and providing a broad range of specialized advisory services to the sector. Contact us to discuss scheduling a strategic planning session or your institution’s specific needs in confidence.
Small Bank Holding Companies: Regulatory Update & Key Considerations
During 1980 the Federal Reserve issued the Small Bank Holding Company Policy Statement (“Policy Statement”), which recognized from a regulatory perspective that small bank holding companies have less access to the capital markets and equity financing than large bank holding companies. Although the Fed has sought to limit holding company debt so that the parent can serve as a “source of strength” to its subsidiaries, especially the deposit-taking bank subsidiaries, the Policy Statement allowed small bank holding companies to utilize more debt to finance acquisitions and other ownership transfer-related transactions than would be permitted by large bank holding companies. The Policy Statement initially applied to bank holding companies with assets less than $150 million; it was amended in 2006 to include bank holding companies with assets up to $500 million. Effective May 15, 2015, the threshold increased to consolidated assets of less than $1 billion for both bank holding companies and savings and loan holding companies, provided that the company complies with the Qualitative Requirements and does not:
- engage in significant nonbanking activities either directly or through a nonbank subsidiary
- conduct significant off-balance sheet activities (including securitization and asset management or administration) either directly or indirectly through a nonbank subsidiary
- have a material amount of debt or equity securities outstanding (other than trust preferred securities) that are registered with the SEC
Holding companies that meet the above requirements may use debt to finance up to 75% of the purchase price of an acquisition, but are subject to the following ongoing requirements:
- parent company debt must be retired within 25 years of being incurred
- parent company debt-to-equity must be reduced to 0.30:1 or less within 12 years of the debt being incurred
- the holding company must ensure that each of its subsidiary insured depository institutions is well capitalized
- the company is expected to refrain from paying dividends until it reduces its debt-to-equity ratio to 1:1 or less
The primary benefit of small bank holding company status is that it creates a larger universe of bank and now savings and loan holding companies that are not subject to the Federal Reserve’s risk-based capital and leverage rules, including the Basel III rules. As of year-end 2014, 454 bank holding companies with assets between $500 million and $1 billion filed a Y-9C according to SNL Financial LC. From a functional standpoint, small bank (and S&L) holding companies do not file a quarterly Y-9C or Y-9LP; instead these companies only file a Y-9SP semi-annually. Regulatory capital rules for these companies continue to apply to their bank subsidiaries, which represents no change from past practice.
Implications
Expansion of Policy Statement eligibility is likely to affect strategic and capital planning for small BHCs.
- Companies that now fall under the Policy Statement oversight can use traditional debt at the holding company level and potentially generate higher returns on equity with a lower cost of capital. Senior debt may be used to replace existing capital such as SBLF preferred stock or fund stock repurchases or dividend distributions.
- Higher capital requirements for larger bank holding companies, coupled with relaxed capital regulations for small bank holding companies, may provide smaller companies an advantage when bidding on acquisition targets inasmuch as the ability to fund acquisitions with a greater proportion of debt results in a lower cost of capital.
- S corporation bank holding companies should remain particularly cognizant of the 1:1 debt/equity ratio constraint that should be maintained in order to declare dividends. For S corporations, the inability to declare dividends may result in shareholders being responsible for their pro rata share of the BHC’s taxable earnings with no offsetting distributions from the BHC. Since the debt/ equity ratio is calculated using equity determined under Generally Accepted Accounting Principles, significant volatility in securities carried as available-for- sale may impair the BHC’s ability to declare dividends.
- If the subsidiary bank holds assets with more onerous risk weightings under the Basel III regime (such as mortgage servicing rights), the holding company may wish to evaluate whether holding such assets at the holding company, rather than the bank, may be more capital efficient.
For more information or to discuss a valuation or transaction advisory issue in confidence, please do not hesitate to contact us.
Bridging Valuation Gaps for Undeveloped and Unproven Reserves
The petroleum industry was one of the first major industries to widely adopt the discounted cash flow (DCF) method to value assets and projects—particularly oil and gas reserves. These techniques are generally accepted and understood in oil and gas circles to provide reasonable and accurate appraisals of hydrocarbon reserves. When market, operational, or geological uncertainties become challenging, however, such as in today’s low price environment, the DCF can break down in light of marketplace realities and “gaps” in perceived values can appear.
While DCF techniques are generally reliable for proven developed reserves (PDPs), they do not always capture the uncertainties and opportunities associated with the proven undeveloped reserves (PUDs) and particularly are not representative of the less certain upside of possible and probable (P2 &P3) categories. The DCF’s use of present value mathematics deters investment at low ends of pricing cycles. The reality of the marketplace, however, is often not so clear; sometimes it can be downright murky.
In the past, sophisticated acquirers accounted for PUDs upside and uncertainty by reducing expected returns from an industry weighted average cost of capital (WACC) or applying a judgmental reserve adjustments factor (RAF) to downward adjust reserves for risk. These techniques effectively increased the otherwise negative DCF value for an asset or project’s upside associated with the PUDs and unproven reserves.
At times, market conditions can require buyers and sellers to reconsider methods used to evaluate and price an asset differently than in the past. In our opinion, such a time currently exists in the pricing cycle of oil reserves, in particular to PUDs and unproven reserves. In light of oil’s low price environment, coupled with the forecasted future price deck, many—if not most—PUDs appear to have a negative DCF value.
Distressed Markets
In the past, we have analyzed actual market transactions to show that buyers still pay for PUDs and unproven reserves despite a DCF that results in little or no value. In today’s market, however, asset transactions of “non-core assets” indicate zero value for all categories of unproven reserves. A highlighted example of this is Samson Oil and Gas’s recent purchase of 41 net producing wells in the Williston Basin in North Dakota and Montana. The properties produce approximately 720 BOEPD and contain estimated reserves of 9.5 million barrels of oil equivalent. Samson paid $16.5 million for the properties in early January 2016 and estimates that within five years they can fund the drilling of PUDs. Samson’s adjusted reserve report, using the most current market commodity prices, indicated PDP reserves worth $15.5 million, PDNPs worth $1 million and PUDs worth $35 million—a total of $52 million in reserves present valued at 10%. This breakdown indicates dollar for dollar value was given on the PDP and PDNP reserves, but zero cash value given on the PUDs.
Is this transaction the best indication of fair market value or fair value?
We believe there is a convincing argument to be made that the Samson transaction and a handful of other asset deals in the previous six months are not the best indication of asset value. In short, these sales could be categorized as distressed or “fire sale” transactions for the following reasons:
- Significant decline and volatility in oil prices from (1) uncertain future demand and (2) current excess supply.
- Debt level pressures with (1) loan covenant requirements and (2) cash flow requirements.
- The low deal volume environment as market participants have been in a “wait and see” stance since oil prices began declining over twelve months ago.
In this low price environment, buyers don’t have to blink first. These factors indicate that some companies may feel pressure to lower their asking prices to levels that continuously attract bidders. The market looks distressed.
What does this mean for the fair market value/fair value of oil and gas assets? The definitions of fair market value and fair value require buyers and sellers to operate in a “distress-free” environment. When the marketplace is not distress-free, perhaps non-market methods should be utilized to estimate the real value of PUDs and unproven reserves. In these scenarios, one useful method to price these assets is the use of option theory.
Option Pricing
If one solely relied on the market approach, it appears much of these unproven reserves would be deemed worthless. Why then, and under what circumstances, might the unproven reserves have significant value?
The answer lies within the optionality of a property’s future DCF values. In particular, if the acquirer has a long time to drill, one of two forces come into play: either (1) the current price outlook can change radically for a resource, and subsequently alter the PUDs or (2) drilling technology can change, such as the onslaught of hydraulic fracturing, and the unproven reserves accrue significant DCF value.
This optionality premium or valuation increment is typically most pronounced in unconventional resource play reserves, such as coal bed methane gas, heavy oil, or foreign reserves. This is additionally pronounced when the PUDs and unproven reserves are held by production. These types of reserves do not require investment within a fixed short timeframe.
Current pricing environment: challenge = opportunity
One of the primary challenges for industry participants when valuing and pricing oil and gas reserves is addressing PUDs and unproven reserves. As oil prices have dropped over 50% in the last six months, reaching 12 year lows, it should be anticipated that PUD values may drop from 75 cents on the dollar to 20 cents on the dollar or less. After the Great Recession, some PUDs faced a similar, yet more modest, decline in price. The price level recovery for PUDs in 2011 was partly attributable to the recovery in the U.S. and global economies, and partly due to increases in the price of oil.
Five main factors have significantly increased the world supply of oil and driven down prices:
- The continued success of shale drillers in the U.S.
- OPEC’s choice to continue to increase production.
- The U.S.’s elimination of restrictions on crude oil exports.
- The recent lifting of Iran’s sanctions.
- Oil consumption slowing down in countries like China.
In August of 2015, it was estimated that Iran’s return to the global oil market would add approximately one million barrels of oil a day to the market and decrease the price of oil by $10 per barrel. Iran is currently ready to increase exports by half a million barrels of oil per day, and the fear of further over-supply pushed the price of oil below $30 on Friday, January 15. Now, the question is when will oil prices recover? The Chief of the IEA estimated that oil prices will recover in 2017. Prices are predicted to remain low in 2016 as expected demand for oil is growing at lower rates than in the past thanks to economic slowdowns in China, India, and Europe. However, the growth in oil supply is predicted to slow in 2017 as the current cuts in research and development catch up with many exploration and production companies. We must also remind ourselves of the crash in oil prices in 1985 that remained below $20 until 2003.
As previously mentioned, PUDs are typically valued using the same DCF model as proven producing reserves after adding in an estimate for the capital costs (capital expenditures) to drill. Then the pricing level is adjusted for the incremental risk and the uncertainty of drilling “success,” i.e., commercial volumes, life and risk of excessive water volumes, etc. This incremental risk could be accounted for with either a higher discount rate in the DCF, a RAF or a haircut. Historically, in a similar oil price environment as we face today, a raw DCF would suggest little or no value for the PUDs or unproven reserves. Interestingly, market transactions with similar reserves (i.e., with little or no proven producing reserves) have demonstrated significant amounts attributable to non-producing reserves, thus demonstrating the marketplace’s recognition of this optionality upside.
Studies have shown that NYMEX futures are not a very accurate predictor of the future, and yet buyers are estimating the value of this option into the prices they are willing to pay. When NYMEX forecasts $35 per barrel, it could actually be $45 when that future date rolls around.
So what actions do acquirers take when values are out of the money in terms of drilling economic wells? Why do acquirers still pay for the non-producing and seemingly unprofitable acreage? Experienced dealmakers realize that the NYMEX future projections amount to informed speculation by analysts and economists which many times vary widely from actual results. Note in the chart above how much the future forecasted prices changed in only one year.
Real Options: Valuation Framework
In practice, undeveloped acreage ownership functions as an option for reserve owners; therefore, an option pricing model can be a realistic way to guide a prospective acquirer or valuation expert to the appropriate segment of market pricing for undeveloped acreage. This is especially true at the bottom of the historic pricing range occurring for the NG commodity currently.
This technique is not a new concept as several papers have been written on this premise. Articles on this subject were written as far back as 1988 or perhaps further, and some have been presented at international seminars.
The PUD and unproved valuation model is typically seen as an adaptation of the Black Scholes option model. An applicability signal for this method is when the owners of the PUDs have the opportunity, but not the requirement, to drill the PUD and unproven wells and the time periods are long, i.e. five to 10 years. The value of the PUDs thus includes both a DCF value, if applicable, plus the optionality of the upside driven by potentially higher future commodity prices and other factors. The comparative inputs, viewed as a real option, are shown in table below.
Pitfalls and fine print
There are, of course, key differences in PUD optionality and stock options as well as limitations to the model. Amid its usefulness, the model can be challenging to implement. Below are some areas in particular where keen rigorous analysis can be critical:
- Observable market – Unlike a common stock, there is no direct observable market price for PUDs. The inherent value of a PUD is the present value of a series of cash flows or market pricing for proven reserves, if available. All commodity prices are volatile, but oil and gas prices are more volatile than most since they have both year-to-year supply and demand changes in addition to significant seasonal swings.
- Risk quantification – We have found that oil and gas price volatility benchmarks (such as long term index volatilities) are not all-encompassing risk proxies when valuing specific oil and gas assets. If not analyzed carefully, the model can sometimes have trouble capturing some critical production profile and geologic risks that could affect future cash flow streams considerably. Risks can include items such as (1) production profile assumptions; (2) acreage spacing; (3) localized pricing versus a benchmark (such as Henry Hub or West Texas Intermediate Crude); and (4) statistical “tail risk” in the assumed distribution of price movements.
- Sensitivity to capital expenditure assumptions – Underlying analysis of an asset or a project’s economics can present particular sensitivity to assumed capital expenditure costs. In assessing capital expenditure’s role as both (1) a cash flow input and (2) an option model input, estimations of future costs can be very acute, yet challenging, assumptions to properly measure.
- Time to expiration – This input can require granular analysis of field production life estimates coupled with expiring acreage, then filtered within the drilling plans of an operator. The resulting weighted time estimate can present problems with assumption certainty.
The availability of drilling resources tends to decline while the costs of drilling and oilfield services tend to rise, often precipitously, when oil and gas prices rise. These factors can present an oscillating delta in both cost and timing uncertainties as the marketplace responds by investing capital into underdeveloped reserves while the fuse burns on existing lease rights. The time value of an option can increase significantly if (1) the mineral rights are owned; (2) unconventional resource play reserves are included; (3) there are foreign reserves; or (4) the reserves are held by production. In these instances, the PUD and unproved reserve option to drill can be deferred over many years, thereby extending the option.
Summary
Utilization of modified option theory is not in the conventional vocabulary among many oil patch dealmakers, but the concept is clearly implicitly considered (as evidenced in many market transactions). This application of option modeling becomes most relevant near the bottom of historic cycles for a commodity. Here, the DCF will often yield little or no value even though transactions are being made for substantial values, thereby validating our belief that option theory is being utilized in the marketplace either directly or indirectly. If the right to drill can be postponed an extended period of time, i.e. five to ten years, the time value of those out of money drilling opportunities can have significant worth in the marketplace.
We caution, however, that there are limitations in the model’s effectiveness. Black Sholes’ inputs do not always capture some of the inherent risks that must be considered in proper valuation efforts. Specific and careful applications of assumptions are musts. Nevertheless, option pricing can be a valuable tool if wielded with knowledge, skill, and good information, providing an additional lens to peer into a sometimes murky marketplace.
Mercer Capital has significant experience valuing assets and companies in the energy industry, primarily oil and gas, bio fuels and other minerals. Contact a Mercer Capital professional today to discuss your valuation needs in confidence.
How to Combat the Margin Blues?
Following the Great Recession, significant attention has been focused on bank earnings and earning power. While community bank returns on equity (ROE) have improved since the depths of the recession, they are still below pre-recession levels. One factor squeezing revenue is falling net interest margins (i.e., the difference between rates earned on loans and securities, and rates paid to depositors). Community banks are more margin dependent than their larger brethren and have been impacted to a greater extent from this declining NIM trend. As detailed in Figure 1 below, NIMs for community banks (defined to be those with assets between $100 million and $5 billion) have steadily declined and were at their lowest point in the last ten years in early 2015.
While there are a number of factors that impact NIMs, the primary culprit for the declining trend is the interest rate environment. As the Federal Reserve’s zero-interest rate policy (“ZIRP”) grinds on, earning asset yields continue to reprice lower while deposit costs reached a floor several quarters ago. Loan growth has also been challenging for many banks for a variety of reasons, which has stoked competitive pressures and negatively impacted lending margins. While competitive pressures can come in many forms, several data-points indicate intense loan competition giving way to easing terms. For example, the April 2015 Senior Loan Officer Opinion Survey on Bank Lending Practices noted continued easing on terms in a number of loan segments. This appears to be supported further by reported community bank loan yields, which have slid close to 200 basis points (in all loan segments analyzed) since 2008 as shown in Figure 2.
Aside from paying tribute to the late B.B. King and playing “Everyday, everyday I have the blues,” what can community bankers do in order to combat the margin blues? While not all-encompassing, below we have listed a few strategic options to consider:
- Increase Leverage. One strategic consideration to maintain ROE in light of declining NIMs may be to increase leverage subject to regulatory limits. Some potential ways to deploy available capital include growing loans organically, M&A, stock buybacks, and/or shareholder dividends. For those below $1 billion in assets, recent legislation has relaxed holding company capital requirements by exempting them from the consolidated regulatory capital ratios. For those that are capable, small bank holding companies may choose to upstream excess capital to the holding company from bank dividends or lever the holding company to fund special dividends and/or buybacks. This higher leverage strategy may be viewed as too aggressive by some shareholders and investors though.
- Consider M&A. An investor at a recent community bank conference noted that he would rather see banks sell than head down lending’s slippery slope. This is not surprising to hear because competitive lending pressures usually seed tomorrow’s problem assets. M&A represents a classic solution to revenue headwinds in a mature industry whereby less profitable smaller companies sell to the larger ones creating economies of scale and enhanced profitability. Some signs of this can be seen in recent periods as deal activity has picked up. Beyond expense synergies, acquirers may see temporary NIM relief resulting from accretion income on the acquired assets, which are marked to fair value at acquisition. For those community banks below $1 billion in assets, the combination of the relaxed capital requirements for their holding companies and more options for holding company debt may attract some to consider M&A as a strategic option.
- Acquire/Partner with Non-Financials. Another strategic option may be to expand into non-traditional bank business lines that are less capital intensive and offer prospects for non-interest income growth such as acquisitions or partnerships with insurance, wealth management, specialty finance, and/or financial technology companies. We have spoken on acquiring non-financials in different venues and there is some evidence of increased activity in the sector. For example, a recent article noted a growing trend in acquisitions of insurance brokers or agencies by banks and thrifts, with deal volume on pace to significantly exceed 2014. Another interesting example of this strategy being deployed includes the recent partnership announced between Lending Club and BancAlliance that allows over 200 community banks to access the peer-to-peer lending space.
- Improve Efficiency by Leveraging Financial Technology. While compliance and regulatory costs continue to rise as NIMs decline, the industry faces intense pressure to improve efficiency. Technology is an opportunity to do so as both commercial and consumer customers become more comfortable with mobile and online banking. Thus, many banks may view the margin blues as a catalyst to consolidate and/or modernize their branch network and/or invest in improved technology offerings to reduce longer-term operating costs and still meet or exceed customer expectations.
- Maintain Status Quo. Experience may lead bankers to wait on the Fed to act and usher a return to “normal” yields and “normal” NIMs. Banks with a healthy amount of variable rate loans and non-interest bearing deposits will see an immediate bump in revenue if short-term rates rise, while most traditional banks eventually will see a reversal in NIM trends. But as has been enumerated in past Bank Watch articles, rates have been expected to rise for a “considerable time,” and yet continue to remain at historic lows. Further, the potential negative impact of rising rates on credit quality is difficult to foretell. Yet, even this status quo strategy may present some opportunities for those bankers to employ certain of the other strategies mentioned previously in small doses.
Mercer Capital has a long history of working with banks and helping to solve complex problems ranging from valuation issues to considering different strategic options. If you would like to discuss your bank’s unique situation in confidence and ways that your bank may consider addressing the margin blues, feel free to give us a call or email.
Using Employee Stock Ownership Plans: Helping Community Banks with Strategic Issues
In our view, Employee Stock Ownership Plans (ESOPs) are an important omission in the current financial environment as a number of companies and banks lack a broader, strategic understanding of the possible roles of ESOPs as a tool to manage a variety of strategic issues facing community banks. Given the strategic challenges facing community banks, we strive to help our clients, as well as the broader industry, fill this gap, and discuss some common questions related to ESOPs in the following article.
We will be glad to discuss your bank’s current situation as well as the role an ESOP can play in detail. If you are interested in learning more about ESOPs, read our book, The ESOP Handbook for Banks: Exploring an Alternative for Liquidity and Capital While Maintaining Independence. In addition, if you would like to speak to a Mercer Capital professional, contact Jay Wilson at 901.685.2120 or wilsonj@mercercapital.com.
For those less familiar with ESOPs, we answer a few basic questions related to ESOPs. For those more familiar with ESOPs, skip to the question entitled “How can an ESOP help the bank deal with strategic issues?”.
What Is an ESOP and How Does It Work?
ESOPs are a written, defined contribution retirement plan, designed to qualify for some tax-favored treatments under IRC Section 401(a). While similar to a more typical profit-sharing plan, the fundamental difference is that the ESOP must be primarily invested in the stock of the sponsoring company (only S or C corporations). ESOPs can acquire shares through employer contributions (either in cash or existing/newly issued shares) or by borrowing money to purchase stock (existing or newly issued) of the sponsoring company. Once holding shares, the ESOP obtains cash via sponsor contributions, borrowing money, or dividends/distributions on shares held by the ESOP. When an employee exits the plan, the sponsoring company must facilitate the repurchase of the shares, and the ESOP may use cash to purchase shares from the participant. Following repurchase, those shares are then reallocated among the remaining participants.
What Are Some Tax Benefits Related to ESOPs?
Similar to other profit-sharing plans, contributions (subject to certain limitations) to the ESOP are tax-deductible to the sponsoring company. The ESOP is treated as a single tax-exempt shareholder. This can be of particular benefit to S corporations, as the earnings attributable to the ESOP’s interest in the sponsoring company are untaxed. The tax liability related to ESOP planholder’s accounts is at the participant level and generally deferred similar to a 401(k) until employees take distributions from the plan.
Who Can Sponsor an ESOP?
Both publicly traded and private banks/holding companies (C or S-Corps.) can sponsor ESOPs, but the benefits are often more profound for private institutions that are not as actively traded, as the ESOP can promote a more active market and enhance liquidity more for the privately-held shares.
How Can an ESOP Help The Bank Deal With Strategic Issues?
While not suitable in all circumstances, an Employee Stock Ownership Plan may provide assistance in resolving a number of strategic issues facing community banks and can offer benefits to plan participants, existing shareholders, and the sponsor company, including:
- Augmenting capital, particularly for profitable institutions facing limited access to external capital. Though an ESOP strategy generally builds capital more slowly than a private placement alternative or a public offering, it provides certain tax advantages and may result in less dilution to existing shareholders. For additional perspective, consider the following example. Let us assume that the holding company has $5 million of debt or preferred stock (this example could also include TARP or SBLF funding) with a five year term and an interest rate of 5%. Assuming that the subsidiary bank is the holding company’s primary source of cash (which is often the case for most community banks), the typical option to service this holding company obligation would be dividends from the bank to the holding company. However, an ESOP is another option that might be worth considering as ESOP contributions are tax-deductible expenses and this allows the bank’s capital position to benefit.
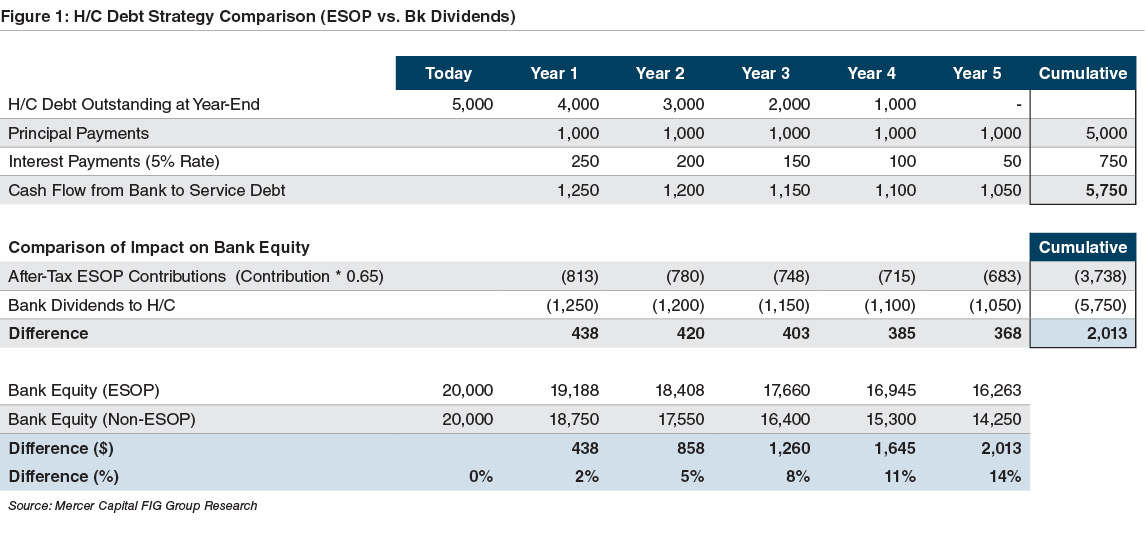
In the ESOP strategy, cash contributions received by the ESOP are used to purchase newly issued shares of the sponsor’s common stock (in this case, the holding company), providing liquidity that the bank holding company then uses to service holding company’s debt. As detailed in the table below, the ESOP strategy provides the necessary cash flow to the holding company for its obligations but results in approximately $2 million of added bank capital (approximately 35% of the cash needed to service the holding company obligation) at the end of the five-year period. This higher capital could be used in a variety of ways by the underlying bank, either to fund future earning asset growth organically or through acquisitions, pay additional distributions to the holding company for shareholder dividends, or as a cushion against adverse events such as credit losses. However, there is a trade-off to augmenting the bank’s capital using the ESOP strategy, as the holding company’s shares outstanding will increase thereby causing dilution to existing shareholders. - Facilitating stock purchases and providing liquidity absent a sale of the bank to outsiders by creating an “internal” stock market whose transaction activity can promote confidence in stock pricing. The ESOP offers the further advantage of providing a vehicle to own shares that is “friendly” to the existing board of directors. For example, the ESOP can offer an alternative exit strategy beyond selling the bank to outside investors through an IPO or acquisition by providing a liquidity avenue that allows for ownership transition while maintaining independence. For C-corporations, the shareholder may even have the ability to sell his or her shares in a tax-free manner subject to certain limitations related to a Section 1042 rollover, including the ESOP owning 30% or more of each class of outstanding stock after the transaction and the seller reinvesting the proceeds into qualified replacement property from 3 to 12 months after the sale; and,
- Providing employee benefits and increasing long-term shareholder value. ESOPs provide a beneficial tool in rewarding employees at no direct cost to themselves by providing common stock and tying their reward to the long-term stock performance of the bank/company, which can serve to increase employee morale and shareholder value over time. For example, a recent study by Ernst & Young1 found that the total return for S Corporation ESOPs from 2002 to 2012 was a compound annual growth rate of 11.5% compared to the total return of the S&P 500 over the same period of 7.1%. The measure of S ESOP returns considers cumulative distributions as well as growth in value of net assets, net of those distributions (i.e., growth in underlying value per share).
What Is the First Step for Those Considering an ESOP?
For those considering implementing ESOPs, the first step is generally a feasibility study of what the ESOP would actually look like once implemented at your bank. Parts of the study would include determining the value of the company’s shares, the pro-forma implications from the potential transaction/installation, as well as what after-tax proceeds the seller might expect. This will help determine whether the bank should proceed, wait a few years to implement, or move to another strategic option. There are typically a number of parties involved in implementations including among others an appraiser/valuation provider, trustee, attorney or plan designer, and administrative committee.
What Are Some Potential Drawbacks to ESOPs?
ESOPs are subject to both tax and benefit law provisions (such as the ERISA act of 1974). Certain negatives associated with them can include:
- The costs of setting up and maintaining the plans
- The repurchase obligation for the sponsoring company as employees retire or exit the plan
- Regulatory issues with the Deportment of Labor serving as primary regulator and the IRS being able to review plan activities
- Fiduciary roles associated with ESOP trustees
- Potential complexities related to shareholder dilution from issuing new shares
Are There Any New Developments for ESOP Trustees to Consider?
For existing ESOPs, two recent legal and regulatory developments have brought up important issues for trustees to consider as well.
Dudenhoeffer
In 2014, the Supreme Court ruled on the case of Fifth Third Bancorp v. Dudenhoeffer, which involved a public company that matched employee contributions to a 401(k) plan by contributing employer stock to an ESOP that was part of the plan. The ruling states that the standard of prudence applicable to all ERISA fiduciaries also applies to ESOPs, though ESOP fiduciaries are not required to diversify the ESOP’s holdings. The Court ruling was focused on public company ESOPs, but its implications for private company ESOPs are unclear. However, trustees should consider ensuring an investment policy statement is in place for the ESOP, stating that the policy is to invest primarily in employer stock in accordance with the purpose of the Plan; and, if applicable, the policy statement could potentially clarify that employees have diversification options through other benefit plans such as a 401(k) plan.
GreatBanc Trust
Scrutiny related to ESOPs, particularly as it relates to certain valuation issues, has increased in recent years, with the DOL bringing a number of cases against trustees and other parties. In the case of Perez, Secretary of the DOL v. GreatBanc Trust Company, there is a process agreement that we encourage ESOP companies and their trustees to review. While the process requirements are only specific to GreatBanc, the case has received a lot of attention in the ESOP community.
In October 2012, The U.S. Department of Labor filed a lawsuit against GreatBanc Trust Co. and Sierra Aluminum Co. in the U.S. District Court for the Central District of California. Among other issues identified in the suit, the DOL alleged that GreatBanc violated the Employee Retirement Income Security Act by breaching its fiduciary duties to the Sierra Aluminum Employee Stock Ownership Plan when it allowed the plan to pay more than fair market value for employer stock in June 2006. The suit also named the ESOP’s sponsor, Sierra Aluminum, as a defendant. The sponsor’s indemnification agreement with GreatBanc allegedly violated ERISA regulations. The suit focuses on the quality of the appraisal on which the trustee relied, particularly on the supportability of the assumptions used in the cash flow projection.
As part of the settlement negotiations, the DOL and GreatBanc have agreed upon a specific set of policies and procedures as trustee of an ESOP. While specific to GreatBanc, the transaction procedures are presumed to be applicable to all Trustees and related appraiser relationships. The process requirements cover the following areas:
- Selection and Use of Valuation Advisor
- Oversight of Valuation Advisor
- Financial Statements
- Fiduciary Review Process
- Preservation of Documents
- Fair Market Value
- Consideration of Claw-Back
- Other Professionals
In general, the process agreement makes clear that trustees must ensure that ESOP valuations are well documented with thoroughly supported assumptions.
How Can Mercer Capital Help?
Mercer Capital has been providing ESOP appraisal services for over 25 years and has extensive ESOP experience through providing annual valuations, installation advisory, feasibility studies, financial expert services related to legal disputes, and fairness opinions. Our appraisals are prepared in accordance with the Employee Retirement Income Security Act (“ERISA”), the Department of Labor, and the Internal Revenue Service guidelines, as well as Uniform Standards of Professional Appraisal Practice (“USPAP”). We are active members of The ESOP Association and the National Center for Employee Ownership (NCEO). Our professionals have been frequent speakers on topics related to ESOP valuation throughout our 32-year history. Mercer Capital professionals also co-authored the publication, The ESOP Handbook for Banks (2011), which provides insight into key ESOP-related issues affecting banking organizations.
For additional ESOP resources, view our whitepapers Insights on ESOPs and Choosing a New ESOP Appraiser.
Endnote
1 Contribution of S ESOPs to participants’ retirement security: Prepared for Employee-Owned S Corporations of America March 2015) Report can be accessed at: http://www.efesonline.org/LIBRARY/2015/EY_ESCA_S_ESOP_retirement_ security_analysis_2015.pdf.
The Value of a Trust & Wealth Management Franchise
Trust franchises can add value to banks, but how much? This session will focus on what drives value in trust franchises, and how to build trust and wealth management operations to enhance the value of a bank.
This presentation, delivered on February 1, 2016, at Bank Director’s Acquire or Be Acquired conference in Phoenix, Arizona, by Matthew R. Crow, ASA, CFA, and Brooks K. Hamner, CFA, addresses building value for trust and wealth management operations.
Dual Fairness Opinions and the Role of the Valuation Firm
In transactions, boards of directors rely on fairness opinions as one element of a decision process that creates a safe harbor related to significant decisions. Fairness opinions are issued by a financial advisor at the request of a board that is contemplating a significant corporate event such as selling, acquiring, going private, raising dilutive capital, and/or repurchasing a large block of shares. Under U.S. case law, the concept of the “business judgment rule” presumes directors will make informed decisions that reflect good faith, care and loyalty to shareholders. Directors are to make informed decisions that are in the best interest of shareholders. Boards that obtain fairness opinions are doing so as part of their broader mandate to make an informed decision.
The fairness opinion states that a transaction is fair from a financial point of view of the subject company’s shareholders. The opinion does not express a view about where a security may trade in the future; nor does it offer a view as to why a board elected to take a certain action. Valuation is at the heart of a fairness opinion, though valuation typically is a range concept that may (or may not) encompass the contemplated transaction value.
This presentation, delivered on November 30, 2015 at the IV OIV International Business Valuation Conference in Milan, Italy by Jeff K. Davis, CFA, managing director of Mercer Capital’s Financial Institutions Group, addresses the topic of dual fairness opinions and the role of the valuation firm.
Fairness Opinions and Down Markets
August has become the new October for markets in terms of increased volatility and downward pressure on equities and high yield credit. This year has seen similar volatility as was the case in some memorable years such as 1998 (Russian default; LTCM implosion), 2007 (tremors in credit markets), 2008 (earthquakes in credit and equity markets) and 2011 (European debt crisis; S&P’s downgrade of the U.S.). Declining commodity markets, exchange rate volatility and a pronounced widening of credit spreads finally began to reverberate in global equity markets this year.
So far the downdraft in equities and widening high yield credit spreads has not slowed M&A activity. Preliminary data from Thomson Reuters for the third quarter indicates global M&A exceeded $1 trillion, which represents the third highest quarter on record and an increase of 11% over the year ago quarter. Activity is less broad-based though as 8,989 deals were announced compared to 10,614 a year ago.
Immediately prior to intensified pressure on risk-assets, Thomson Reuters estimated that as of August 13 global M&A was on pace for a record year with $2.9 trillion of announced transactions globally (+40% vs. LYTD) and $1.4 trillion in the U.S. (+62%). Within the U.S., strategic buyer activity rose 53% to $1.1 trillion while PE M&A rose 101% to $326 billion.
LBO multiples have been trending higher since 2009. The median LBO EBITDA multiple for broadly syndicated large deals was 10.1x through September, while middle market multiples expanded to 10.3x. Debt to EBITDA multiples for LBOs were 6.0x for large deals YTD and 5.5x for middle market transactions.
No one knows what the future holds for markets. Deal activity could slow somewhat; however, a weak environment for organic revenue growth will keep many strategic buyers engaged, while lower prices for sellers if sustained will make more targets affordable for private equity provided debt financing costs do not rise too much. As of October 14, the option-adjusted-spread (OAS) on Bank of America Merrill Lynch’s High Yield Index was 6.31%, up from 5.04% at year-end and 4.83% a year ago.
The role of the financial advisor becomes tougher too when markets are declining sharply. Obviously, sellers who do not have to sell may prefer to wait to see how market turmoil will play out while buyers may push to strike at a lower valuation. Questions of value and even fair dealing may be subjected to more scrutiny.
Fairness opinions seek to answer the question whether a proposed transaction is fair to a company’s shareholders from a financial point of view. Process and especially value are at the core of the opinion. A fairness opinion does not predict where a security—e.g. an acquirer’s shares—may trade in the future. Nor does a fairness opinion approve or disapprove a board’s course of action. The opinion, backed by a rigorous valuation analysis and review of the process that led to the transaction, is just that: an opinion of fairness from a financial point of view. Nevertheless, declining markets in the context of negotiating and opining on a transaction will raise the question: How do current market conditions impact fairness?
There is no short answer; however, the advisor’s role of reviewing the process, valuation, facts and circumstances of the transaction in a declining market should provide the board with confidence about its decision and the merits of the opinion. Some of the issues that may weigh on the decision process and the rendering of a fairness opinion in a falling market include the following:
- Process vs. Timing. Process can always be tricky in a transaction. A review of fair dealing procedures when markets have fallen sharply should be sensitive to actions that may favor a particular shareholder or other party. A management-led LBO after the market has fallen or a board that agrees to buyback a significant shareholder’s interest when prices were higher are examples. Even an auction of a company may be subject to second guessing if the auction occurred in a weak environment.
- Corporate Forecasts. Like the market, no one knows how the economy will perform over the next several years; however, consideration should be given to whether declining equity markets and widening credit spreads point to a coming economic slowdown. A baseline forecast that projects rising sales and earnings or even stable trends may be suspect if the target’s sales and earnings typically fall when the economy enters recession. A board should consider the implications of any sustained economic slowdown on the subject’s expected financial performance with follow-through implications for valuation.
- Valuation. Unless markets experience a sharp drop from a valuation level that reflects a widely held view that multiples were excessive, a sharp pullback in the market will cause uncertainty about what’s “fair” in terms of value. DCF valuations and guideline M&A transaction data may derive indications that are above what is obtainable in the current market. Transactions that were negotiated in mid-2007 and closed during 2008 may have felt wildly generous to the seller as conditions deteriorated. Likewise, deals negotiated in mid-2012 that closed in 2013 when markets were appreciating may have felt like sellers left money on the table. There is no right or wrong, only the perspective provided from the market’s “bloodless verdict” of obtaining a robust market check if a company or significant asset is being sold. It is up to the board to decide what course of action to take, which is something a fairness opinion does not address.
- Exchange Ratios. Acquisitions structured as share exchanges can be especially challenging when markets are falling. Sellers will tend to focus on a fixed price, while buyers will want to limit the number of shares to be issued. The exchange ratio can be (a) fixed when the agreement is signed; (b) fixed immediately prior to closing (usually based upon a 10 day volume-weighted average price of the buyer); or (c) a hybrid such as when the ratio floats based upon an agreed upon value for the seller provided the buyer’s shares remain within a specified band. Floating exchange ratios can be seen as straightjackets for buyers and lifejackets for sellers in falling markets; rising markets entail opposite viewpoints.
- Buyer’s Shares. An evaluation of the buyer’s shares in transactions that are structured as a share exchange is an important part of the fairness analysis. Like profitability, valuation of the buyer’s shares should be judged relative to its history and a peer group presently and relative to a peer group through time to examine how investors’ views of the shares may have evolved through market and profit cycles. The historical perspective can then be compared with the current down market to make inferences about relative performance and valuation that is or is not consistent with comparable periods from the past.
- Financing. If consummation of a transaction is dependent upon the buyer raising cash via selling shares or issuing debt, a sharp drop in the market may limit financing availability. If so, the board and the financial advisor will want to make sure the buyer has back-up financing lined-up from a bank. The absence of back-stop financing, no matter how remote, is an out-of-no-where potential that a board and an advisor should think through. Down markets make the highly unlikely possible if capital market conditions deteriorate unabated. While markets periodically become unhinged, a board entering into an agreement without a backstop plan may open itself to ill-informed deal making if events go awry.
A market saw states that bull markets take the escalator up and bear markets take the elevator down. Maybe the August sell-off will be the pause that refreshes, leading to new highs, tighter credit spreads, and more M&A. Maybe the October rebound in equities (but not credit, so far) will fade and the downtrend will resume. It is unknowable.
What is known is that boards that rely upon fairness opinions as one element of a decision process to evaluate a significant transaction are taking a step to create a safe harbor. Under U.S. case law, the concept of the “business judgment rule” presumes directors will make informed decisions that reflect good faith, care and loyalty to shareholders. The evaluation process is trickier when markets have or are falling sharply, but it is not unmanageable. We at Mercer Capital have extensive experience in valuing and evaluating the shares (and debt) of financial and non-financial service companies engaged in transactions during bull, bear and sideways markets garnered from over three decades of business.
An Introduction to Dividends and Dividend Policy for Private Companies
Excerpted from Z. Christopher Mercer, FASA, CFA, ABAR,’s newest book, Unlocking Private Company Wealth. It is reprinted here with permission.
The issue of dividends and dividend policy is of great significance to owners of closely held and family businesses and deserves considered attention.
Fortunately, I had an early introduction to dividend policy beginning with a call from a client back in the 1980s.
I had been valuing a family business, Plumley Rubber Company, founded by Mr. Harold Plumley, for a number of years. One day in the latter 1980s, Mr. Plumley called me and asked me to help him establish a formal dividend policy for his company, which was owned by himself and his four sons, all of whom worked in the business.
Normally I do not divulge the names of clients, but my association with the Plumley family and Plumley Companies (its later name) was made public in 1996 when Michael Plumley, oldest son of the founder and then President of the company, spoke at the 1996 International Business Valuation Conference of the American Society of Appraisers held in Memphis, Tennessee. He told the story of Plumley Companies and was kind enough to share a portion of my involvement with them over nearly 20 years at that point.
Let’s put dividends into perspective, beginning with a discussion of (net) earnings and (net) cash flow. These are two very important concepts for any discussion about dividends and dividend policy for closely held and family businesses. To simplify, I’ll often drop the (net) when discussion earnings and cash flow, but you will see that this little word is important.
(Net) Earnings of a Business
The earnings of a business can be expressed by the simple equation:
Earnings = Total Revenue – Total Cost
Costs include all the operating costs of a business, including taxes.
- C Corporations. If your corporation is a C corporation, it will pay taxes on its earnings and earnings will be net of taxes. The line on the income statement is that of net income, or the income remaining after all expenses, including taxes, both state and federal, have been paid. By the way, if your company is a C corporation, feel free to give me a call to start a conversation about this decision.
- S Corporations and LLCs. If your corporation is an S corporation or an LLC (limited liability company), the company will make a distribution so that its owners can pay their pass-through taxes on the income. To get to the equivalent point of net income on a C corporation’s income statement, it is necessary to go to the line called net income (but it is not) and to subtract the total amount of distributions paid to owners for them to pay the state and federal income taxes they owe on the company’s (i.e., their pass through) earnings. This amount would come from the cash flow statement or the statement of changes in retained earnings.
Ignoring any differences in tax rates, the net income, after taxes (corporate or personal) should be about the same for C corporations and pass-through entities.
(Net) Cash Flow
Companies have non-cash charges like depreciation and amortization related to fixed assets and intangible assets. They also have cash charges for things that don’t flow through the income statement. Capital expenditures for plant and equipment, buildings, computers and other fixed assets are netted against depreciation and amortization, and the result is either positive or negative in a given year. Capital expenditures tend to be “lumpy” while the related depreciation expenses are amortized over a period of years, often causing swings in the net of the two.
There are other “expenses” and “income” of businesses that do not flow through the income statement. These investments, either positive or negative, relate to the working capital of a business. Working capital assets include inventories and accounts receivable, and working capital liabilities include accounts payable and other short-term obligations. Changes in working capital can lead to a range of outcomes for a business. Consider these two extremes that could occur regarding cash in a given year:
- Make lots of money but have no cash. Rapidly growing companies may find that while they have positive earnings, they have no cash left at the end of the month or year. They have to finance their rapid growth by leaving all or more than all of earnings in the business in the form of working capital to finance investments in accounts receivable and/or inventories and in the purchase of fixed assets to support that growth.
- Make little money, even have losses, and generate cash. Companies that experience sales declines may earn little, or even lose money on the income statement, and still generate lots of cash because they collect prior receivables or convert previously accumulated inventories into cash during the slowdown.
Working capital on the balance sheet is the difference between current assets and current liabilities. Many companies have short-term lines of credit with which they finance working capital investments. The concept of working capital, then, may include changes in short-term debt.
In addition, companies generate cash by borrowing funds on a longer-term basis, for example, to finance lumpy capital expenditures. In the course of a year, a company may be a net borrower of long-term debt or be in a position of paying down its long-term debt. So we’ll need to consider the net change in long-term debt if we want to understand what happens to cash in a business during a given year.
We are developing a concept of (net) cash flow, which can be defined as follows in Figure 11.
Most financial analysts and bankers will agree that this is a pretty good definition of Net Cash Flow.
Net Cash Flow is the Source of Good Things
We focus on cash flow because it is the source of all good things that come from a business. The current year’s cash flow for a business is, for example, the source of:
- Long-term debt repayment. Paying debt is good. Bankers are extremely focused on cash flow, because they only want to lend long-term funds to businesses that have the expectation of sufficient cash flow to repay the debt, including principal and interest on the scheduled basis. Interest expense has already been paid when we look at net cash flow. Companies borrow on a long-term basis to finance a number of things like land, buildings and equipment, software and hardware, and many other productive assets that may be difficult to finance currently. They may also borrow on a long term basis to finance stock repurchases or special dividends.
- Reinvestment for future growth. Investment in a business is good if adequate returns are available. If a company generates positive cash flow in a given year, it is available to reinvest in the business to finance its future growth. Reinvested earnings are a critical source of investment capital for closely held and private companies Reinvesting with the expectation of future growth (in dividends and capital gains) is an important source of shareholder returns, but the return is deferred, at least in the form of cash, until a future date.
- Dividends or distributions. Corporate dividends are also good, particularly if you are a recipient. Cash flow is also the normal source for dividends (for C corporation owners) or what we call “economic distributions,” or distributions net of shareholder pass-through taxes (for S corporation and LLC owners).
What is a Dividend?
At its simplest, a dividend (or economic distribution) reflects the portion of earnings not reinvested in a business in a given year, but paid out to owners in the form of current returns.
For some or many closely held and family businesses, effective dividends can include another component, and that is the amount of any discretionary expenses that likely would be “normalized” if they were to be sold. Discretionary expenses include:
- Above-market compensation for owner-managers. Owners of some private businesses who compensate themselves and/or family members at above-market rates should realize that the above-market portion of such compensation is an effective dividend.
- Mystery employees on the payroll. Some companies place non-working spouses, children or other relatives on the payroll when no work is required of them.
- Expenses associated with non-operating assets used for owners’ personal benefit. Non-operating assets can include company-owned vacation homes, aircraft not necessary for the operation of the business, vehicles operated by non-working family members, and others.
It is essential to analyze above-market compensation and other discretionary expenses from owners’ viewpoints to ascertain the real rate of return that is obtained from investments in private businesses. In an earlier chapter, we touched on the concept of the rate of return on investment for a closely held business. Assuming that there were no realized capital gains from a business during a given year, the annual return (AR) is measured as follows:
Now, we add to this any discretionary expenses that are above market or not normal operating expenses of the business that are taken out by owners:
We now know what dividends are, and they include discretionary benefits that will likely be ceased and normalized into earnings in the event of a sale.
We won’t focus on discretionary benefits in the continuing discussion of dividends and dividend policy. However, it is important for business owners to understand that, to the extent discretionary benefits exist, they reflect portions of their returns on investments in their businesses.
In summary, dividends are current returns to the owners of a business. Dividends are normally residual payments to owners after all other necessary debt obligations have been paid and all desirable reinvestments in the business have been made.
Dividends and Dividend Policy for Private Companies
With the above introduction to dividends for private companies, we can now talk about dividend policy. The remainder of this chapter focuses on seven critical things for consideration as you think about your company’s dividend policy.
- Every company has a dividend policy.
- Dividend policy influences return on business investment.
- Dividend policy is a starting point for portfolio diversification.
- Special dividends enhance personal liquidity and diversification.
- Dividend policy does matter for private companies.
- Dividend policy focuses management attention on financial performance.
- Boards of directors need to establish thoughtful dividend policies.
We now focus on each of these seven factors you need to know about your company’s dividend policy.
Every Company Has a Dividend Policy
Let’s begin with the obvious observation that your company has a dividend policy. It may not be a formal policy, but you have one. Every year, every company earns money (or not) and generates cash flow (or not). Assume for the moment that a company generates positive earnings as we defined the term above. If you think about it, there are only three things that can be done with the earnings of a business:
- Reinvest the earnings in the business, either in the form of working capital, plant and equipment, software and computers, and the like, or even excess or surplus assets.
- Pay down debt.
- Pay dividends to owners (or economic distributions – after pass-through taxes – for S corporations and LLCs) or repurchase stock (another form of returns to shareholders).
That’s it. Those are all the choices. Every business will do one or more of these things with its earnings each year. If a business generates excess cash and reinvests in CDs, or accumulates other non-operating assets, it is reinvesting in the business, although likely not at an optimal rate of return on the reinvestment. Even if your business does not pay a dividend to you and your fellow owners, you have a dividend policy and your dividend payout ratio is 0% of earnings.
On the other hand, if your business generates substantial cash flow and does not require significant reinvestment to grow, it may be possible to have a dividend policy of paying out 90% or even up to 100% of earnings in most years. This is often the case in non capital intensive service businesses.
Recall that if a business pays discretionary benefits to its owners that are above market rates of compensation, or if it pays significant expenses that are personal to the owners, it is the economic equivalent of paying a dividend to owners. So when talking to business owners where such expenses are significant, we remind them that they are, indeed, paying dividends and should be aware of that fact.
Some may think that discretionary expenses are the provenance of only small businesses; however, they exist in many businesses of substantial size, even into the hundreds of millions in value.
Discretionary expenses are not necessarily bad, but they can create issues. In companies with more than one shareholder, discretionary expenses create the potential for (un)fairness issues. However, discretionary expenses are paid for the benefit of one shareholder or group of shareholders and not for others, they are still a return to some shareholders.
Every company, including yours, has a dividend policy. Is it the right policy for your company and its owners?
Dividend Policy Influences Return on Business Investment
To see the relationship between dividend policy and return on investment we can examine a couple of equations. This brief discussion is based on a lengthier discussion in my book, Business Valuation: An Integrated Theory Second Edition (John Wiley & Sons, 2007). There is a basic valuation equation, referred to as the Gordon Model. This model states that the price (P0) of a security is its expected dividend (D1) capitalized at its discount rate (R) minus its expected long term growth rate in the dividend (Gd). This model is expressed as follows:
D1 is equal to Earnings times the portion of earnings paid out, or the dividend payout ratio (DPO), so we can rewrite the basic equation as follows:
What this equation says is that the more that a company pays out in dividends, the less rapidly it will be able to grow, because Gd, or the growth rate in the dividend, is actually the expected growth rate of earnings based on the relevant dividend policy.
We can look at this simplistically in word equations as follows:
Dividend Income + Capital Gains = Total Return
Dividend Yield + Growth (Appreciation) = Cost of Equity (or the discount rate, R)
These equations reflect basic corporate finance principles that pertain, not only to public companies, but to private businesses as well. There is an important assumption in all of the above equations – cash flow not paid out in dividends is reinvested in the business at its discount rate, R.
There are many examples of successful private companies that do not pay dividends, even in the face of unfavorable reinvestment opportunities. To the extent that dividends are not paid and earnings are reinvested in low-yielding assets, the accumulation of excess assets will tend to dampen the return on equity and investment returns for all shareholders.
Further, the accumulation of excess assets dampens the relative valuation of companies, because return on equity (ROE) is an important driver of value. For example, consider the following relationship without proof:
ROE x Price/Earnings Multiple = Price/Book Value
At a given multiple of (net) earnings available in the marketplace, a company’s ROE will determine its price/book value multiple. The price/book value multiple tells how valuable a company is in relationship to its book value, or the depreciated cost value of its shareholders’ investments in the business.
Let’s consider a simple example. Assume that a company generates an ROE of 10% and that the relevant market price/earnings multiple (P/E) is 10x. Using the formula above:
In this example, the company would be valued at its book value and the shareholders would not benefit from any “goodwill,” or value in excess of book value. Consider, however, that a similar company earns an ROE of 15%.
- Assuming the same P/E of 10x, it would be valued at 150% of its book value.
- Suppose the second company, because of its superior returns, received a P/E of 11x. In that case the price/book multiple would be 165%.
To the extent that a company’s dividend policy influences its ongoing ROE, it influences its relative value in the marketplace and the ongoing returns its shareholders receive.
In short, your dividend policy influences your return on investment in your business, as well as your current returns from that investment.
Dividend Policy is a Starting Point for Portfolio Diversification
Recall the story of my being asked to help develop a dividend policy for a private company. The company had grown rapidly for a number of years and its growth and diversification opportunities in the auto parts supply business were not as attractive as they had been. The CEO, who was the majority shareholder, realized this and also that his sons (his fellow shareholders) could benefit from a current return on their investments in the company, which, collectively, were significant.
We reviewed the dividend policies of all of the public companies that we believed to be reasonably comparable to the company. I don’t recall the exact numbers now, but I believe that the average dividend yield for the public companies was in the range of 3%. As I analyzed the private company, it was clear that it was still growing somewhat faster than the publics, so the ultimate recommendation for a dividend was about 1.5% of value.
The value that the 1.5% dividend yield was compared to was the independent appraisal that we prepared each year. Based on the value at the time, I recall that the annual dividend began at something on the order of $300,000 per year. But, for the father and the sons, it was a beginning point for diversification of their portfolios away from total concentration in their successful private business.
Your dividend policy can be the starting point for wealth diversification, or it can enhance the diversification process if it is already underway.
Special Dividends Enhance Personal Liquidity and Diversification
A number of years ago, I was an adviser to a publicly traded bank holding company. Because of past anemic dividends, this bank had accumulated several million dollars of excess capital. The stock was very thinly traded and the market price was quite low, reflecting a very low ROE (remember the discussion above).
Because of the very thin market for shares, a stock repurchase program was not considered workable. After some analysis, I recommended that the board of directors approve a large, one-time special dividend. At the same time I suggested they approve a small increase in the ongoing quarterly dividend. Both of these recommendations provided shareholders with liquidity and the opportunity to diversify their holdings.
Since the board of directors collectively held a large portion of the stock, the discussion of liquidity and diversification opportunities while maintaining their relative ownership position in the bank was attractive.
At the final board meeting before the transaction, one of the directors did a little bit of math. He noted that if they paid out a large special dividend, the bank would lose earnings on those millions and earnings would decline. I agreed with his math, but pointed out (calculations already in the board package) that the assets being liquidated were very low in yield and that earnings (and earnings per share) would not decline much. With equity being reduced by a larger percentage, the bank’s ROE should increase. So that increase in ROE, given a steady P/E multiple in the marketplace, should increase the bank’s Price/Book Value multiple.
The director put me on the spot. He asked point blank: “What will happen to the stock price?” I told him that I didn’t know for sure (does one ever?) but that it should increase somewhat and, if the markets believed that they would operate similarly in the future, it could increase a good bit. The stock price increased more than 20% following the special dividend.
Special dividends, to the extent that your company has excess assets, can enhance personal liquidity and diversification. They can also help increase ongoing shareholder returns. I have always been against retaining significant excess assets on company balance sheets because of their negative effect on shareholder returns and their adverse psychological impact. It is too easy for management to get “comfortable” with a bloated balance sheet.
If your business has excess assets, consider paying a special dividend. Your shareholders will appreciate it.
Dividend Policy Does Matter for Private Companies
Someone once said that earnings are a matter of opinion, but dividends are a matter of fact. What we know is that when dividends are paid, the owners of companies enjoy their benefit, pay their taxes, and make individual choices regarding their reinvestment or consumption.
The total return from an investment in a business equals its dividend yield plus appreciation (assuming no capital gains), relative to beginning value. However, unlike unrealized appreciation, returns from dividends are current and bankable. They reduce the uncertainty of achieving returns. Further, if a company’s growth has slowed because of relatively few good reinvestment opportunities, a healthy dividend policy can help assure continuing favorable returns overall.
Based on many years of working with closely held businesses, we have observed that companies that do not pay dividends and, instead, accumulate excess assets, tend to have lower returns over time. There is, however, a more insidious issue. The management of companies that maintain lots of excess assets may tend to get lazy-minded. Worse, however, is the opposite tendency. With lots of cash on hand, it is too easy to feel pressure to make a large and perhaps unwise investment, e.g., an acquisition, that will not only consume the excess cash but detract from returns in the remainder of the business.
Dividend policy is the throttle by which well-run companies gauge their speed of reinvestment. If investment opportunities abound, then a no- or low-dividend payout may be appropriate. However, if reinvestment opportunities are slim, then a heavy dividend payout may be entirely appropriate.
Any way you cut it, dividend policy does matter for private companies.
Dividend Policy Focuses Management Attention on Financial Performance
Boards of directors are generally cautious with dividends and once regular dividends are being paid, are reluctant to cut them. The need, based on declared policy, to pay out, say, 35% of earnings in the form of shareholder dividends (example only) will focus management’s attention on generating sufficient earnings and cash flow each year to pay the dividend and to make necessary reinvestments in the business to keep it growing.
No management (even if it is you) wants to have to tell a board of directors (even if you are on it) or shareholder group that the dividend may need to be reduced or eliminated because of poor financial performance.
Boards of Directors Need to Establish Thoughtful Dividend Policies
If dividend policy is the throttle with which to manage cash flow not needed for reinvestment in a business, it makes sense to handle that throttle carefully and thoughtfully. Returns to shareholders can come in the form of dividends or in the form of share repurchases.
While a share repurchase is not a cash dividend, it does provide cash to selling shareholders and offsetting benefits to remaining shareholders. Chapter 10 of the book (Leveraged Share Repurchase: An Illustrative Example) provides an example of a substantial leveraged share repurchase from a controlling shareholder to provide liquidity and diversification.
From a theoretical and practical standpoint, the primary reason to withhold available dividends today is to reinvest to be able to provide larger future dividends – and larger in present value terms today. It is not a good dividend policy to withhold dividends for reasons like the following:
- A patriarch withholds dividends to prevent the second (or third or more) generations from being able to have access to funds.
- A control group chooses to defer dividends to avoid making distributions to certain minority shareholders.
- Dividends are not paid because management (and the board) want to build a large nest egg against possible future
adversities. - Dividends are not paid to accumulate excess or non-operating assets on the balance sheet for personal or vanity
reasons.
Dividend policy is important and your board of directors needs to establish a thoughtful dividend policy for your business.
Conclusion
Dividends and dividend policies are important for the owners of closely held and family businesses. Dividends can provide a source of liquidity and diversification for owners of private companies. Dividend policy can also have an impact on the way that management focuses on financial performance.
To discuss corporate valuation or transaction advisory issues in confidence, please contact us.
Unicorn Valuations: What’s Obvious Isn’t Real, and What’s Real Isn’t Obvious
In the two short years since Aileen Lee introduced the term “unicorn” into the VC parlance, the number of such companies has steadily increased from the 39 identified by Lee’s team at Cowboy Ventures to nearly 150 (and growing weekly) by most current estimates. Pundits and analysts have offered a variety of explanations for the phenomenon, with some identifying unicorns as the sign that the tech bubble of the late 1990s has returned under a different guise, others attributing the existence of such companies to structural changes in how innovation is funded in the economy, and the most intrepid of the group suggesting that the previously undreamt valuations are fully supported by the underlying fundamentals given the maturity and ubiquity of the internet, smart phones, tablets, and related technologies.
We suspect there is merit to each of these perspectives. As valuation analysts, however, what sets our hearts atwitter is the very definition of “unicorn”, which is predicated on valuation. Since companies are christened unicorns upon closing a financing round, one would assume valuation to be self-evident. Alas, that is generally far from the case. Because of the common features of VC investments, the “headline” valuation numbers are not reliable measures of the market value of the underlying enterprises. As a result, the frequent breathless comparisons of the value of startup X to publicly traded stalwart Y are often overblown and potentially misleading.
Consider the following example. The capitalization of a hypothetical freshly-minted unicorn, BlueCo, is summarized in the following table:
With 200 million fully-diluted shares post issuance, the $5.00 per share Series E offering results in a headline valuation of $1.0 billion (on a pre-money basis, BlueCo’s headline valuation is $825 million). But is BlueCo really worth $1 billion? In other words, what does the Series E investment imply about the value of the stakes in BlueCo held by other investors?
The value of the whole is equal to the sum of the individual parts. So, for BlueCo to truly be worth $1 billion, all 200 million fully-diluted shares must be worth $5.00 each. But the various share classes are not created equal. At each subsequent funding stage, investors in startup companies negotiate terms to provide downside protection to their investment while preserving the upside potential if the subject company turns out to be a home run. Such provisions commonly include some or all of the following:
- Liquidation preferences that put the latest investors at the front of the line for exit proceeds. This is especially advantageous in the event the Company fails to meet expectations (basically LIFO treatment: the last one in is the first one out).
- Cumulative dividend rights that cause the liquidation preference to increase over time. When such rights are present, the preferred investors not only stand at the front of the line, but are entitled to a return on their investment if there are sufficient proceeds.
- Anti-dilution or ratchet provisions that allow preferred investors to hit the reset button on many of their economic rights in the event the company is forced to raise money in the future at a lower price.
- Participation rights that allow the preferred investors to simultaneously benefit from the payoff to common shares while also recovering their initial investment via liquidation preference.
A recent New York Times article highlighted additional, more exotic rights and privileges being attached to recent financings.
For the sake of illustration, we will assume that the terms of BlueCo’s Series E preferred shares are generally favorable to the other investors: pro rata liquidation preference to other preferred investors, non-cumulative dividends, and no participation rights. Despite these relatively benign terms, owning Class E shares is clearly preferable to owning more junior classes. Consider the waterfall of proceeds under various strategic sale exit scenarios:
Even under the relatively disappointing $400 million exit scenario, the Scenario E shareholders are entitled to return of their investment, or $5.00 per share, while the proceeds to more subordinate classes range from $1.14 per share to $3.00 per share. The following chart depicts the superiority of the proceeds for Series E preferred shares to Series A shares over enterprise exit values less than $1.0 billion:
The area between the payoff lines for Class E and Class A preferred shares represents the incremental value available to the more senior Class E shares. Borrowing from the fair value measurement lexicon, if the recent Series E issuance price of $5.00 per share is consonant with market participant expectations, then that same group of market participants would rationally assign a lower value to the Class A shares. Valuation analysts use two primary techniques for estimating the magnitude of the difference in share value across the various classes. Examining the relative merits of the two techniques (the probability-weighted expected return method, or PWERM, and the option pricing method, or OPM) is beyond the scope of this blog post. Both models are reasonably intuitive but require numerous assumptions for which irrefutable support can prove elusive.
We use the OPM to illustrate the impact of the rights and preferences of the most senior preferred shareholders on the economic value of a nominal unicorn. The two most subjective assumptions in the OPM are the time remaining until exit and the return volatility of the underlying business. The sensitivity table below depicts the implied total enterprise value of BlueCo (that would reconcile to the $5.00 per Series E preferred share transaction price) using the OPM under a range of assumptions for exit timing, given assumed volatility of 100%:
Over the range of exit timing assumptions noted above, the implied total enterprise value ranges from less than $600 million to just over $800 million, meaningful discounts to the $1 billion headline number. The reliability of the OPM and the assumed inputs can be debated; however the point remains that, since the subordinate classes are necessarily worth less than Series E, the total enterprise value is less than $1 billion.
So what?
Is the preceding analysis just so much valuation pedantry? Perhaps, but we suggest that these observations reflect one practical peril of high valuations for late stage investors and management teams. The implied enterprise value based on rights and preferences of senior investors is relevant precisely because buyers in the exit markets for start-up companies – strategic sales and IPOs – assess the value of the entire enterprise, not individual interests. The exit markets assign a value for the entire company, exhibiting a serene indifference to how that value is allocated to various investors. This can result in unflattering headlines and unpleasant outcomes for late stage investors.
Let’s return to the BlueCo example to illustrate. Assume that the appropriate assumptions for BlueCo from the sensitivity table above are three years to exit, implying an enterprise value of $748 million. In the year following the Series E investment, BlueCo management executes its strategy successfully, causing the enterprise value to increase 30% to $975 million. If BlueCo exits via a strategic sale at that point, none of the incremental enterprise value will accrue to the Series E investors; despite identifying an attractive company, and the strong execution of management, the Series E investors will receive their capital back with no return.
If the exit occurs instead by IPO, things get even more awkward. In contrast to a strategic sale, an IPO is a pro rata exit, meaning that the realized return for the Series E preferred investors will actually be negative, despite the 30% increase in enterprise value. Further, the Company and its management team will likely be subject to some unfavorable press for executing a “downround” IPO, although in reality, it generated a handsome return for the investor group as a whole.
So when is a unicorn really a unicorn? We hesitate to draw a bright line; circumstances and assumptions vary. Regardless of size, the lesson for investors and management teams at early-stage companies is to beware the headline valuation number. Appearances can be deceiving.
Related Links
New York’s Largest Corporate Dissolution Case: AriZona Iced Tea
After several years of litigation involving a number of hearings and trials on various issues, a trial to conclude the collective fair value of a group of related companies known as the AriZona Entities (also referred to as “AriZona” or “the Company”), occurred. The trial was held in the Supreme Court, State of New York, Nassau County, New York, the Hon. Timothy Driscoll, presiding. The trial lasted from May 22, 2014 until July 2, 2014.1
The Court’s decision in what I will refer to as “the AriZona matter” (or “the matter”) was filed on October 14, 2014. I have not previously written about the AriZona matter because I was a business valuation expert witness on behalf of one side.2 I was asked not to publish anything while the matter was still pending. The parties recently closed a private settlement of the matter, so there will be no appeal.
There are numerous quotes from the Court’s decision in Ferolito v. Vultaggio throughout this article. However, in an informal article of this type, I will not cite specific pages for simplicity and ease of reading.
Background about the Case
The overall litigation had numerous complexities; however, the valuation and related issues were ultimately fairly straightforward. The Court had to determine the fair value, under New York law, of a combined 50% interest in the AriZona Entities as of two valuation dates. The first date, October 5, 2010, pertained to a portion of the 50% block, and the remainder of the block was to be valued as of January 31, 2010.
The Court’s decision focused on the first valuation date, or October 5, 2010, and we will do the same in this analysis of the case.
The case citation in the footnote below provides the names for all plaintiffs and defendants in the matter. For purposes of this discussion, we simplify the naming of the “sides” in the litigation, following the Court’s convention.
- The group of plaintiffs, led by John Ferolito, is referred to as “Ferolito” herein. I worked on behalf of Ferolito.
- Similarly, the group of defendants, led by Dominick Vultaggio, is referred to as “Vultaggio.”
Expert witnesses for Ferolito included Z. Christopher Mercer (Mercer Capital), Basil Imburgia (FTI Consulting), Dr. David Tabak (NERA Economic Consulting), Christopher Stradling (Lincoln International), and Michael Bellas (Beverage Marketing Corporation). Mercer was the primary business valuation expert. Imburgia testified on developing adjusted earnings for AriZona. Stradling, an investment banker, also testified regarding the value of AriZona. Finally, Bellas testified regarding the revenue forecast he developed for AriZona and that was employed by Mercer in the discounted cash flow method.
Expert witnesses for Vultaggio included Professor Richard S. Ruback (Harvard Business School and Charles River Associates), who was the primary valuation expert, and Dr. Shannon P. Pratt (Shannon Pratt Valuations). Pratt testified on the topic of the discount for lack of marketability but did not offer an independent valuation opinion. Other experts worked on behalf of Vultaggio, but their opinions received little treatment in the Court’s decision.
Background about the AriZona Entities
The AriZona Entities market beverages (principally ready-to-drink iced teas, lemonade-tea blends, and assorted fruit juices) under the AriZona Iced Tea and other brand names. At the valuation dates, the Company sold product through multiple channels, including convenience stores, grocery stores, and other retailers, primarily in the United States. International sales comprised about 9% of total sales.
The Company was founded in 1992 by Vultaggio and Ferolito, who each owned 50% of the stock at that time. It grew rapidly to the range of $200 million in sales and significant profitability and remained at that level until 2002, at which time sales began to rise rapidly and consistently, reaching about $1 billion in 2010.
Normalized EBITDA (earnings before interest, taxes, depreciation and amortization), as determined by Basil Imburgia on behalf of Ferolito, was $181 million for the trailing twelve months ending September 2010, which the Court accepted. While the text of the decision states that Imburgio’s EBITDA for that time period was $173 million and a table shows it as $169 million, Imburgio’s concluded EBITDA was, indeed, $181 million, which the Court accepted and Mercer accepted, as well.
Ruback’s estimate of EBITDA for calendar 2010 was $168 million. There was no disagreement over the recent strong earnings of AriZona.
AriZona was, at the valuation dates, an attractive, profitable and growing company that was gaining market share in the ready-to-drink (RTD) tea industry. It was the only private company in the $1 billion sales range in the non-alcoholic beverage industry in the United States. In the years and months leading to the valuation date, several very large companies, including Coca-Cola, Tata Tea, and Nestle Waters, held discussions with either Vultaggio and the Company, Ferolito, or both, regarding the potential acquisition of either the Company or the 50% Ferolito interest.
The Level of Value for Fair Value
Counsel for Ferolito interpreted fair value in New York as being at the strategic control level based on the following case law guidance:
“[I]n fixing fair value, courts should determine the minority shareholder’s proportionate interest in the going concern value of the corporation as a whole, that is, ‘what a willing purchaser, in an arm’s length transaction, would offer for the corporation as an operating business.'” 3
Mercer provided a conclusion of fair value at the strategic control level of $3.2 billion, which included the consideration of the sharing of certain expected operating synergies with hypothetical buyers. Stradling offered a conclusion of strategic control value in the range of $3.0 billion to $3.6 billion.
The Court did not consider that strategic value was appropriate for its determination of fair value. After citing several cases, including Friedman v. Beway Realty Corp. (“Beway”), the Court concluded:4
These principles make clear that the Court may not consider AriZona’s “strategic” or “synergistic” value to a hypothetical third-party purchaser, as Ferolito urges. A valuation that incorporates such a “strategic” or “synergistic” element would not rely on actual facts that relate to AriZona as an operating business, but rather would force the Court to speculate about the future.
Interestingly, the Court did not quote the language from Beway noted just above. What would a willing purchaser like Tata Tea, Coca-Cola, or Nestle Waters pay for AriZona? Whatever price these “willing purchaser[s], in an arm’s length transaction” would offer would certainly include consideration of potential synergies. I do not say this to argue with the Court’s conclusion, but to point out that the conclusion is not reconciled with the plain language of Beway.
The Court concluded that it would value the Company using the “financial control” measurement (as described by Mercer in the Mercer Report and in testimony at trial). However, that decision did force the Court to “speculate about the future” because the Court’s conclusion, which was based on Mercer’s discounted cash flow (DCF) method, employed a ten year forecast of revenues and expenses.
In anticipation of the Court’s decision regarding strategic control value, Mercer also provided conclusions of fair value at the financial control level. These values were $2.4 billion as of October 5, 2010 and $2.3 billion as of January 31, 2011.
The Ruback Report offered a standard of value that can be described as “business as usual.” 5
It is my understanding that, under New York law, the fair value of shares of Arizona Iced Tea values the company as a going concern operated by its current management with its usual business practices and policies.
No case law guidance was offered by Ruback for this “business as usual” standard, which included management’s inability or unwillingness ever to raise product prices.
The Ruback Report’s conclusion of fair value for 100% of AriZona’s equity was $426 million. The concluded enterprise value is well below 3x EBITDA.
In its decision, the Court concluded that consideration of expected synergies was speculative and did not consider Mercer’s conclusions at the strategic control level of value. The Court focused instead on Mercer’s financial control valuations. The Court rejected the “business as usual” standard offered in the Ruback Report.
The Court Focuses on Discounted Cash Flow
The Ruback Report took the position that the discounted cash flow method was the appropriate method for the determination of the fair value of AriZona.
Mercer applied a weighting of 80% to the DCF method. But Mercer and Stradling considered the use of guideline public companies and guideline transactions, as well. Mercer accorded the guideline public company indications with the remaining weight of 20%. Because of the substantial weight placed on the DCF method by Mercer, the difference in position was relatively minor.
The issue for the Court was one of comparability. Obviously, I thought the use of guideline public companies was relevant, and that the selected group of public companies was sufficiently comparable to provide solid valuation evidence at the financial control level. Nevertheless, the Court disagreed and focused solely on the discounted cash flow valuation.
The Court’s Determination of Fair Value
Having determined that the focus would be on the discounted cash flow method, the Court looked at the key components of the DCF methods employed by Mercer and Ruback. As noted, the Court’s starting point was the discounted cash flow analysis from the October 5, 2010 DCF method from the Mercer Report.
After concluding that Mercer’s DCF method was the starting point for analysis, the Court developed a very logical examination of the key components of the DCF analysis, providing sections reaching conclusions on the following assumptions:
- Revenue
- Costs
- Terminal Value
- Tax Amortization Benefit
- Tax Rate
- “Key Man” Discount
- Discount Rate
- Outstanding Cash, Non-Operating Assets, and Debt
- Discount for Lack of Marketability
In the following sections, we address each of these assumptions, although I have reordered them to facilitate the discussion.
The starting point is the DCF conclusion already includes one assumption made by the Court. In disregarding Mercer’s guideline public company method and its somewhat lower indicated value, the starting point for the Court’s analysis was increased by $79.2 million, or from $2.36 billion to $2.44 billion.
1. Anticipated Revenue
The Bellas Report provided a ten year forecast of expected future revenues for AriZona. He forecasted domestic revenues and provided a separate forecast for expected future international sales assuming a conscious effort on the part of the Company to focus on international sales, which comprised some 9% of revenues at the valuation date. The Court wrote:6
Based on the depth and breadth of Bellas’ experience, the significant research regarding the trends in the RTD industry and AriZona in particular, and his demeanor throughout this testimony, the Court credits Bellas’ testimony in its entirety regarding AriZona’s future revenues.
The Court provided a review of the Bellas Report’s analysis and my adoption of the analysis, concluding as follows:7
Upon relying on Bellas’ projections for AriZona’s domestic and international prospects, Mercer projected AriZona’s revenue to grow a compounded annual growth (“CAGR”) rate of 10.2%, which is consistent (and may well be conservative when compared to) AriZona’s CAGR from 2006-10 of 13.9%. The Court thus adopts Mercer’s revenue projections. In so doing, the Court notes Mercer’s impressive expertise in the field of business valuation, including (a) completing some 400 business valuation per year [that’s 400 for Mercer Capital, not Mercer], including a significant number of valuations exceeding $1 billion, (b) extensive business appraisal credentials, and (c) publication of over 80 articles regarding different valuation issues. By contrast, Ruback’s experience in business valuation is almost entirely academic in nature.
In the final analysis, the Court adopted the revenue projection of the Bellas Report which, in turn, was reviewed, analyzed and accepted for the Mercer Report.8 Revenues were forecasted to increase about 7.7%, rising from the last twelve months in September 2010 of $958 million to $2.0 billion in 2020.
Although the Bellas revenue forecast adopted by Mercer was deemed aggressive by the Vultaggio side, AriZona’s revenues were forecasted to reach $2.2 billion by 2020 in the Ruback Report.
2. Operating Costs
The Court observed that in the past, AriZona had been able to manage costs. The Court was presented information regarding historical cost of goods sold, operating expenses, and resulting EBITDA, both in dollar terms and in terms of the resulting historical EBITDA margins.
The Court noted that Mercer used past costs as a basis to forecast future costs. The Ruback Report assumed that future costs would rise faster than revenue, with resulting pressure on profit margins.
To make the point about the unreasonableness of the Ruback Report’s cost assumptions, the Court quoted a portion of my trial testimony:9
[Ruback] utilizes a business plan that I don’t believe has any bearing in history or any bearing in any evidence I have seen. He conducts – he assumes a business plan that basically assumes that Mr. Vultaggio and the management at AriZona are incompetent and [in]capable of adapting to evolving business conditions.
The Ruback Report made two critical assumptions that resulted in an unrealistic and unreasonable forecast of costs and the resulting impact on forecasted EBITDA and EBITDA margins. First, costs were projected to increase with expected inflation. Second, all prices were held constant over the entire projection period. The result was a precipitous drop in the forecasted EBITDA margin. A picture is helpful.
The chart below provides historical EBITDA margins and the forecasted margins employed in the Mercer Report (green) and the Ruback Report (red).
In the final analysis, the Court credited Mercer’s testimony regarding AriZona’s anticipated costs. In so doing, having already adopted its revenue forecast, the Court adopted the Mercer Report’s forecasted income for the ten year forecast period employed in that report.
3. Tax Rate Assumption
The Court did not, however, entirely adopt the forecasted net income and net cash flow of the Mercer Report. For some reason, the Court selected tax rates from the Ruback Report, which were the sum of the marginal personal rate and the marginal state rates, presumably because of AriZona’s S corporation status.
The Ruback Report assumed a personal marginal tax rate of 35%, an average state income tax rate of 4.5%, and a corporate tax rate of 4% for AriZona itself. These were added together, not accounting for the deductibility of state taxes for federal income tax purposes, and a tax rate of 43.5% was posited for the forecast.
The Court correctly noted that there was no explanation of the use of the blended federal/tax rate in the Mercer Report. I can only say that the usual table that illustrates the calculation of the blended federal and state tax rate was missing from the relevant valuation exhibits. Nevertheless, the investment bankers who provided testimony also provided blended federal/state rates similar to the 38% used in the Mercer Report. I did not have an opportunity to address this issue, either on direct or cross-examination during trial testimony.
It is fairly standard to begin the valuation of an S corporation on as “as if” C corporation basis. Then, if there are benefits that are additive to value for the S corporation, they can be considered separately. I valued AriZona on an “as if” C corporation basis and then separately considered the tax amortization benefit as being accretive to value for the Company.
Pratt, who testified for Vultaggio, agrees with this, as was pointed out in Part I of the Gilbert Matthews article series cited in endnote 2.
It is important to recognize that both C corps and S corps pay taxes on corporate income. Whether that tax is actually paid by the corporation or the individual is absolutely irrelevant. What is relevant is the difference between the value of a company valued as a C corporation…and [as] an S corporation. It is for this reason that most S corporation models begin by valuing the company “as if” a C corporation… and then go on to recognize the benefits of the Sub-chapter S election.10
All parties, including Stradling and the other investment bankers who provided opinions or whose work was introduced into evidence (except Professor Ruback) valued AriZona, which was an S corporation, as if it were a C corporation, because the likely buyers of the Company were publicly traded C corporations.
There has been an ongoing debate in the valuation profession regarding whether there should be a valuation premium accorded to an S corporation like AriZona relative to a similar C corporation. I have written and testified that an S corporation is worth no more than an otherwise identical C corporation. However, it is hard to find otherwise identical corporations for comparison.
What I have written is that there is no inherent increase (or decrease) in the value of enterprise cash flows whether their corporate wrapper is an S corporation or a C corporation. There are lots of things that can change the proceeds of a sale to a seller between the two types of corporations, including:
- An S corporation that retains earnings enables its owners to build basis in their shares, thus sheltering future capital gains taxes. The basis of ownership in C corporations remains at cost until the shares are sold.
- An S corporation’s assets can be sold, enabling the buyers to write up assets for future depreciation or amortization. This write-up and subsequent amortization provides a tax amortization benefit that can enable buyers to pay more for an S corporation. See the next section. In the alternative, the parties can elect a Section 338(h)(10) Election, which provides substantially the same effect as a purchase of assets.
- A C corporation may have embedded capital gains on assets that would be realized upon a sale of assets.
By raising the tax rate above the expected tax rates of likely buyers, the Court effectively lowered the DCF value in the Mercer Report by $196 million, or about 8%. This is simply an incorrect treatment, in my opinion from economic or financial viewpoints.
It is my understanding that the Court later requested additional information on the issue of appropriate tax rates for the valuation of an S corporation like AriZona. No one knows if a change might have been made because the matter has settled.
4. Tax Amortization Benefit
The Court did not agree with the consideration of a tax amortization benefit in the Mercer Report. The tax amortization benefit was calculated on the assumption that, in a hypothetical sale of AriZona as an S corporation (assumed to be structured as an asset sale), the write-up of intangible assets over the minimal tangible assets on the balance sheet would give rise to a tax amortization benefit to the buyer. The present value of this benefit was calculated over the 15 year amortization period allowed under then current tax law.
On cross-examination, I noted that I had not used such a benefit before in valuing an S corporation. However, I did note that this benefit had been a point of negotiation between the AriZona parties and Nestle Waters, and was included in valuation calculations leading to a $2.9 billion offer (that was not finalized) in the months leading up to the valuation date.
I also noted that while this synergy had been provided to the seller in the financial control valuation, all other potential synergies, including those from operating expenses or enhanced revenues or lower cost of capital, were specifically allocated to hypothetical buyers.
The Court did not allow this benefit, noting that I have written that
S corporations should not be worth more than C corporations. What I have long said is that S corporations should not be worth more than otherwise identical C corporations. The Court’s decisions regarding the tax rate above assured that AriZona was valued at less than an otherwise identical C corporation. The decision regarding the tax amortization benefit denied the value impact of a benefit that was clearly already on the table in negotiations ongoing only a few months before the valuation date.
The effect of not including the tax amortization benefit lowered the Court’s conclusion of fair value by about 14% (about $336 million) relative to the $2.364 billion conclusion of financial control value in the Mercer Report.
5. The Terminal Value Estimation
The final cash flow in the DCF method is the estimation of the terminal value, which represents the present value of then-remaining future cash flows at the end of the finite projection period.
The Court rejected the terminal value estimation in the Ruback Report, which called for a liquidation of the business at the end of the ten year forecast period. The Court believed that AriZona was a company poised for long-term growth.
The long-term growth rate assumption used in the terminal value estimation in the Mercer Report was 4.5%, which was the sum of long-term real growth and inflation, as discussed in the Mercer Report. The weighted average cost of capital was 10.8%, so the terminal multiple of net cash flow was [1 / (10.8% – 4.5%)], or an implied multiple of terminal year EBITDA of just under 9x.
The Court accepted the terminal value estimation from the Mercer Report, noting that it might be too conservative.
6. The Discount Rate (Weighted Average Cost of Capital)
There was little development of the discount rate in the Ruback Report, which concluded with a weighted average cost of capital (“WACC”) of 11.0%.
The WACC was developed in the Mercer Report using a “build-up method” to reach an equity discount rate. The equity discount rate included consideration for company-specific risk associated with the centrality of Mr. Vultaggio to the Company’s operations as well as risks associated with the sustainability of new product innovation.
The cost of debt was estimated and a capital structure was assumed based on the (non-comparable per the Court) guideline public companies in the Mercer Report.
The resulting WACC was 10.8% for the October 5, 2010 valuation date, which was accepted by the Court.
7. “Key Man” Discount
As noted above, the Mercer Report included consideration of Mr. Vultaggio’s importance to the Company in the development of the discount rate. Pratt testified on behalf of Vultaggio regarding a key man discount, but none was employed in the Ruback Report.
Given the testimony at trial about the importance of Vultaggio to the operations of AriZona, the Court believed that it was important for this to be considered in the valuation process. Pratt also testified that consideration for a key person discount could be included as an adjustment to the discount rate in a discounted cash flow method.
The Court considered that the Mercer Report had made appropriate consideration of key man issues in the discount rate development, which was accepted as noted above.
8. Outstanding Cash, Non-Operating Assets and Debt
The Court accepted the analysis of non-operating assets and the consideration of debt as presented in the Mercer Report. There was significant cash on hand at both valuation dates as well as other non-operating assets that were readily collectible. There was also some debt owed primarily to Vultaggio.
The Ruback Report subtracted debt at the valuation date, but did not include cash or other non-operating assets in its conclusion. Rather, those assets were held for the ten years of the forecast period and then discounted for ten years to the present in the Ruback Report, which argued that the cash was needed for operations. Given the 11.0% WACC in the report, this effectively discounted the non-operating assets by 65%, or about $100 million.
A specious argument was made in the Ruback Report that the cash was needed to pay for the valuation judgment. The Court saw clearly that the cash was a part of value at the valuation date and that payment of the valuation judgment was a separate issue.
The Court observed that the net non-operating assets were $137.6 million at October 5, 2011 and $161.4 million at January 31, 2011. Both totals were derived from the Mercer Report.
The Court’s Financial Control Value
The Court did not provide a separate section to develop its financial control value, so we will do so now for clarity. Figure 1 summarizes the discussion to this point.
The economics of the Court’s analysis can now be summarized in relationship with the original DCF valuation in the Mercer Report. As the preceding discussion shows, the Court accepted the Mercer Report’s Financial Control conclusion with three exceptions:
- No weight was placed on the guideline public company method. This had the effect of increasing value by about 3%. So the beginning point of the Court’s analysis was $2.443 billion, as shown in Figure 1.
- The Court changed the blended federal/state tax rate of 38% in the Mercer Report to the personal rate of 43.5% from the Ruback Report. This had the effect of decreasing the Court’s conclusion by about 8%, or by $196 million.
- Finally, the Court did not allow the tax amortization benefit employed in the Mercer DCF analysis. This lowered the Court’s conclusion by $336 million, or about 14%.
Overall, my interpretation of the Court’s financial control value was $1.911 billion. Relative to the $2.364 billion conclusion of financial control value in the Mercer Report, the Court’s conclusion was lower by $453 million, or about 19%.
The Court’s financial control value of $1.991 billion is 4.7 times greater than the analogous conclusion in the Ruback Report of $426 million. I make the comparison at the financial control level because that’s the level at which such comparisons should be made in a fair value matter in New York. I say that because courts, and this Court, often show an ability to understand the economics of valuations. Justice Driscoll certainly did that.
But when it comes to the next assumption, the discount for lack of marketability, or DLOM, or marketability discount, the courts in New York make the rules. The only problem is that they don’t tell appraisers or anyone what the rules are.
9. The Marketability Discount (DLOM)
The Court’s treatment of the marketability discount does not make sense from my perspective as a business valuer and a businessman. The discussion of the marketability discount, which is a $478 million adjustment in the Court’s analysis, consists of just over three pages.
Because this marketability discount is such a large and important adjustment, I will spend a significant amount of space discussing it.
The Pratt and Ruback Reports
The Court’s determination of fair value was clearly conducted at the financial control level of value. The beginning point for the Court’s determination was the financial control values provided in the Mercer Report as of October 5, 2010. The methodology of the Ruback Report also yielded a conclusion at the financial control level of value.
The Ruback Report cited two studies in developing the DLOM, the Longstaff Model and the Silber Study.11 The Ruback Report stated that the Longstaff Model provided an “upper bound” for marketability discounts, and it was ignored in the final conclusion regarding the marketability discount.
The Silber study reported an average restricted stock discount of 34%, and this was used as the basis for the Ruback Report’s conclusion of a 35% marketability discount.
As pointed out in the Reply Report, this use of the average from the Silber Study was inappropriate and misleading.12
- The Silber Study broke its sample into two distinct populations, those with discounts greater than 35% and those with discounts less than 35%.
- The group with discounts greater than 35% had a mean discount of 54%, median prior year revenues of $13.9 million and median prior year loss of $1.4 million. This group had an average market capitalization of $34 million.
- The group with discounts less than 35% looked entirely different. The mean discount was a much lower 14%, average revenues were $65 million, with median prior year earnings of $3.2 million, and an average market capitalization of $75 million.
- Compared with the second group of the Silber Study, AriZona had revenues of approximately $1.0 billion and pro forma after-tax net income of approximately $100 million. Even using the Ruback Report’s flawed equity valuation of $426 million (before discounts), AriZona would be among the most attractive companies in the second group, if not the most attractive. If detailed transactional information were available from the Silber Study, relevant comparisons might suggest that a premium (i.e., a negative discount) should be applied. The range of “discounts” in the Silber Study was from a minus 13% (a premium of 13%) to a discount of 84%. Given AriZona’s attractiveness relative to the sample of companies studied, the Silber Study supports a marketability discount of zero percent.
Pratt also testified that the appropriate marketability discount should have been 35%. The Pratt Report cited numerous minority interest studies and analyzed a number of factors, most of which applied to illiquid minority interests of companies, although he also testified that any DLOM should be based only on corporate or enterprise factors and not on shareholder level factors.
Unfortunately, I did not get time during direct testimony to address Ruback’s 35% DLOM. Counsel for AriZona certainly did not want to question me about it during their cross-examination of me.
The Mercer Report
The Mercer Report cited a number of New York cases in support of a recommended marketability discount of 0%. I will discuss those in the context of the analysis of the Court’s treatment below.
The bottom line is that AriZona is a large, highly successful company in a niche in the beverage industry that many players, both in the beverage industry and outside it, would like to own. Graphically, this positioning was shown in the Mercer Report as follows:
AriZona (and Ferolito) had had significant discussions with Coca-Cola, Nestle Waters, and Tata Tea in the months and years prior to the valuation date. These discussions yielded informal offers ranging from $2.9 billion to more than $4 billion for 100% of the AriZona Entities.
The record was clear that Vultaggio did not want to sell his shares or the Company in total. He exhibited reluctance to complete any transaction leading to the valuation dates and did not cooperate to facilitate the sale of the Ferolito shares. Ultimately, there were no transactions leading to the valuation date.
The Mercer Report referred to discussions like those noted above as indicative of the interest of capable buyers. This was one factor considered in concluding that the appropriate marketability discount was 0%.
The Court’s Analysis
The Court began its analysis by stating:13
At the outset, nearly all courts in New York that have considered the question of whether to apply a DLOM have answered in the affirmative.
I knew trouble was coming when I read that sentence. The Court then went on:14
The instant case is readily distinguishable from each of the three cases upon which Ferolito relies in support of his claim that there should not be any DLOM at all. [emphasis added]
I’m not a lawyer, but it seems to beg the question to begin an analysis by saying that nearly all courts have said positive marketability discounts were appropriate as a basis for applying one in the case of AriZona. Every case is fact-dependent. The fact is, there are a growing number of New York fair value decisions where 0% or very small marketability discounts have been concluded. This should make it important to reference at least some of them to see how AriZona compares.
I testified in Giaimo, which involved two real estate holding companies. In that case, a special master concluded that the appropriate marketability discount was 0%.15 The 0% discount was affirmed by the New York Supreme Court, although using only a portion of the logic that I testified about. On appeal, the marketability discount was concluded to be 16%.16
I also testified in the case Man Choi Chiu and 42-52 Northern Boulevard, LLC v. Winston Chiu, involving another real estate holding company.17 In that case, the New York Supreme Court held that a 0% marketability discount was appropriate. That decision was left untouched in the appeal of the matter.
As we will see, there are other 0% marketability discount cases, some of which are more relevant to AriZona than real estate holding companies.
The Court said that Ferolito (Mercer) relied on three cases in support of no marketability discount. There were actually six cases analyzed in the Mercer Report from business and valuation perspectives.
Friedman v. Beway18
Beway was cited in the Mercer Report in support of the selection of the control level of value. Beway was cited in the early “General Principles of Valuation” section of the Court’s decision, but it was not cited in the Court’s short discussion of the marketability discount.
However, Beway itself is instructive regarding the applicability of a marketability discount, at least from a logical standpoint. Key citations were included in the discussion. Beway is quoted in the Mercer Report to illustrate important guidance in fair value determinations:
“[I]n fixing fair value, courts should determine the minority shareholder’s proportionate interest in the going concern value of the corporation as a whole, that is, ‘what a willing purchaser, in an arm’s length transaction, would offer for the corporation as an operating business.'”
This is the same quotation found at the beginning of this analysis regarding the appropriate level of value. Beway addresses the applicability of a minority discount:
“[a] minority discount would necessarily deprive minority shareholders of their proportionate interest in a going concern,”
This is important because such a discount:
“would result in minority shares being valued below that of majority shares, thus violating our mandate of equal treatment of all shares of the same class in minority stockholder buyouts.”
Beway also argues against the unjust enrichment that would occur if a minority discount were allowed in a New York fair value determination.
“to fail to accord to a minority shareholder the full proportionate value of his [or her] shares imposes a penalty for lack of control, and unfairly enriches the majority stockholders who may reap a windfall from the appraisal process by cashing out a dissenting shareholder.”
Again, I’m not a lawyer, but the economic effect of applying a marketability discount is to lower the price below that which “a willing purchaser, in an arm’s length transaction, would offer” for a business as a going concern.
Further, the application of marketability discount results in “minority shares being valued below that of majority shares” and therefore violates the principle that “all shares of the same class” be treated equally.
Finally regarding these quotes, the application of a marketability discount provides a windfall to control shareholders by imposing “a penalty for lack of control,” because no controlling shareholder would ever sell his or her shares based on a discount for lack of marketability. We will see the effect of this penalty below.
Beway, unfortunately, is inconsistent on its face in arguing strongly against the application of a minority discount while calling for consideration of a marketability discount, which, if applied, undermines the very principles that the case espouses. Obviously, that is my opinion from business and valuation perspectives. I have no legal opinions.
Matter of Walt’s Submarine Sandwiches, Inc.19
The Court attempted to distinguish Walt’s Submarine Sandwiches, which provided for a 0% marketability discount, from AriZona. In Walt’s Submarine Sandwiches, “a DLOM was not appropriate where there was testimony of increased profits, expansion and 120 responses to a ‘for sale’ advertisement in the Wall Street Journal.”
First, there was adequate testimony of “increased profits and expansion” for AriZona leading to the valuation dates (covered above). The Court seemed to think that because there were a “geometrically smaller number of expressions of interest for AriZona”, this is not a valid comparison from a business perspective. However, companies like AriZona are not sold through advertisements in the Wall Street Journal or anywhere. Large companies are carefully marketed by qualified professionals to limited universes of carefully selected financial and strategic buyers. There was substantial testimony from investment bankers regarding the attractiveness and marketability of AriZona.
The Mercer Report stated about Walt’s Submarine Sandwiches specifically, following significant discussion regarding the attractiveness and marketability of AriZona:20
In Matter of Walt’s Submarine Sandwiches, the Court rejected application of a marketability discount, finding that: “The record, including testimony of increased profits, expansion and 120 responses to a ‘for sale’ advertisement in The Wall Street Journal, amply supports a finding of respondent’s marketability.” If offered for sale, multiple potential acquirers would be interested in acquiring the AriZona Entities.
The AriZona Court’s analysis of Walt’s Submarine Sandwiches, in my opinion from a business perspective, fails to demonstrate that the relevant facts are “readily distinguishable” from AriZona.
Ruggiero v. Ruggiero21
The AriZona Court noted that in Ruggiero, “there was ‘insufficient explanation’ to support a DLOM, which is far from the case here.” That’s the entire distinction made. If we look at the decision in Ruggiero, we see something different:22
The sole issue the Court had with Mr. Glazer’s explanation was his 20% discount for lack of marketability for which he did not provide sufficient explanation. In this sense the Court agreed with Plaintiff’s expert that Zan’s does constitute a somewhat unique niche business. Thus, the Court removed…the deduction for lack of marketability.
One expert did not provide sufficient explanation for a 20% marketability discount. The other described the company as a “somewhat unique niche business,” and apparently suggested a 0% marketability discount. The Ruggiero Court agreed with that characterization, and removed the marketability discount.
The AriZona Court also noted that Ruggiero was not a BCL § 1118 case. This would appear to be a distinction without a difference because Beway instructs that the same valuation principles hold for BCL § 623 cases.
In the Mercer Report, it was noted:23
In Ruggiero v. Ruggiero, the Court concluded that no marketability discount was appropriate since the subject business constituted “a somewhat unique niche business.” Among the unique attributes of the AriZona Entities is the fact that it is one of only four (and the only private) available U.S. non-alcoholic beverage systems with scale available to potential acquirers.
The AriZona Court’s analysis of Ruggiero, in my opinion from a business perspective, fails to demonstrate that the relevant facts are “readily distinguishable” from AriZona.
O’Brien v. Academe Paving, Inc.24
The AriZona Court’s entire dismissal of O’Brien v. Academe Paving is in a single sentence: “Finally, in O’Brien v. Academe Paving, Inc. (citations omitted) the trial court appears to have applied an impermissible minority discount, rather than a DLOM.” 25
The O’Brien Court did refuse to allow an impermissible minority discount, citing the same passage from Beway noted above. Unfortunately, the characterization of the discussion regarding the DLOM would appear to be incorrect.
The Court in O’Brien quoted Beway about the appropriateness of consideration of marketability discounts and then noted:
The Court continued, in that same decision [Beway], and repeats here, that marketability discounts for close corporations (such as these here) are entirely proper if it is a factor used in valuing the corporation as a whole, not just a minority interest. 26
At several points, the O’Brien Court stated that Academe/JOB was a very desirable and marketable commodity within the paving industry. The purpose of valuations conducted near the valuation date was to assist with a potential sale of the business. The business was marketable, attractive and was for sale.
The O’Brien Court concluded regarding the marketability discount:
As Mr. Griswold saw no need to factor an illiquidity discount into his analysis of the “enterprise value” of Academe/JOB for either April or November of 1999, so the Court sees no need to do so now.
It should be clear that the application of a 0% marketability discount in O’Brien v. Academe Paving was an intentional decision by that Court based on the facts and circumstances of the case.
The analysis in the Mercer Report stated the following about O’Brien:
In O’Brien v. Academe Paving, Inc. the Court noted that marketability discounts are appropriate in fair value determinations in cases for which “the reduction of value of close corporations is thought to be necessary to reflect the (theoretical) circumstance that no ‘market’ buyer would want to buy into such a corporation, even if shareholders were willing to sell their interests (which, under most circumstances, they are not).” Noting that, in a sale of the subject business, petitioners’ shares would not be subject to discount, the Court concluded that, since the subject company was “a very desirable/marketable commodity” within its industry, the appropriate marketability discount was 0%. The attractiveness and desirability of the AriZona Entities to potential acquirers has been discussed throughout this report.27
The AriZona Court’s analysis of O’Brien v. Academe Paving, in my opinion from a business perspective, fails to demonstrate that the relevant facts are “readily distinguishable” from AriZona.
The Mercer Report discussed two other cases.
In Quill v. Cathedral Corp., the Court noted that the receipt of offers for the subject business (and a subsequent sale at the asking price within a reasonable period of time) indicated that “the actual sales price received reflected any marketability discount and that no further deduction should be made from the value of petitioners’ shares.”28 The Supreme Court’s reasoning was upheld on appeal.29 We should note that there was a second, apparently less marketable company involved in this litigation. For that company, the Supreme Court applied a 15% marketability discount, which was also upheld on appeal. With respect to the AriZona Entities, the conclusion of fair value is consistent with the offers from potential acquirers discussed previously in this report.30
and,
In Adelstein v. Finest Food Distributing Co.,31 the Court determined that a 5% marketability discount was appropriate for the subject business by reference to assumed transaction costs involved in a sale. As a percentage of the sales price, transaction costs are generally inversely related to the amount of the proceeds. In the event of the sale of a multi-billion company like AriZona, one would anticipate transaction costs to be much less than 5% of the purchase price.32
Another case was mentioned by the AriZona Court, that of Zelouf International Corp. v. Zelouf, which was published shortly before the decision in AriZona.33 In that case, Justice Kornreich did not apply a marketability discount. The AriZona Court noted that “as readily demonstrated by the stalled Nestle negotiations, the very reasons for a DLOM here have resulted in – or are at least strongly correlated with – the failure of Ferolito to sell his shares prior to the proceeding.”
Zelouf actually stands for another principle (as I read it from business and valuation perspectives), that the lack of desire on the part of controlling shareholders to sell, potentially ever, should not be the cause for imposing an illiquidity discount on the dissenters (or, by inference, on Ferolito in the AriZona matter). Peter Mahler, writer of the well-known New York Business Divorce Blog, wrote the following:
Justice Kornreich found the risk of illiquidity associated with the company “more theoretical than real,” explaining there was little or no likelihood the controlling shareholders would sell the company, i.e, themselves would incur illiquidity risk upon sale. Imposing DLOM in valuing the dissenting shareholder’s stake, therefore, would be tantamount to levying a prohibited discount for lack of control a/k/a minority discount.34
The AriZona Court distinguished this matter from Zelouf based on stalled Nestle negotiations involving Ferolito. In Zelouf, Justice Kornreich accepted a 0% marketability discount because the controlling shareholders did not want to sell, potentially ever. The logic was that if the controlling shareholders would never suffer from illiquidity, then the dissenting shareholder should not be charged with a marketability discount. Vultaggio did not want to sell at all and was very clear about that in both word and actions.
A further development in Zelouf was published December 22, 2014.35 In this supplemental decision, Justice Kornreich made the following statements:
[N]o New York appellate court has ever held that a DLOM must be applied to a fair value appraisal of a closely held company. On the contrary, the Court of Appeals has held that “there is no single formula for mechanical application.” Matter of Seagroatt Floral Co., Inc., 78 NY2d 439, 445 (1991). Indeed, the Court of Appeals recognizes that “[v]aluing a closely held corporation is not an exact science” because such corporations “by their nature contradict the concept of a market’ value.” Id. at 446. As set forth in the Decision, since Danny is not likely to give up control of the Company, Nahal should not recover less due to possible illiquidity costs in the event of a sale that is not likely to occur. [emphasis added]
And further:
[I]n this case, under the unique set of facts set forth in the Decision, applying a DLOM is unfair. This court’s understanding of the applicable precedent is that, while many corporate valuation principles ought to guide this court’s analysis, this court’s role is not to blithely apply formalistic and buzzwordy principles so the resulting valuation is cloaked with an air of financial professionalism. To be sure, sound valuation principles ought to be and indeed were utilized in computing the Company’s value (i.e., the court’s adoption of most of Vannucci’s valuation). Nonetheless, the gravamen of the court’s valuation is fairness, a notion that is undefined, making it a classic question of fact for the court. Fairness, in this court’s view, necessarily requires contextualizing the applicable valuation principles to the actual company being valued, as opposed to merely deciding a priori, and in a vacuum, that certain adjustments must be part of the court’s calculus. From this perspective, the court reached its conclusion that an application of a DLOM here would be tantamount to the imposition of a minority discount. Consequently, the court finds it fairer to avoid applying a minority discount at all costs rather than ensuring that all hypothetical liquidity risks are accounted for. [Citation omitted.] [emphasis added]
Justice Kornreich went on to say that if forced to impose a marketability discount, it would be 10%, citing another recent New York fair value case, Cortes v. 3A N. Park Ave Rest Corp.36 Suffice it to say, Zelouf is not “readily distinguishable” from the AriZona matter, at least in my opinion from business and valuation perspectives. Rather, the logic of Zelouf supports a 0% marketability discount, since it was the actions of the controlling shareholder, Vultaggio, that caused Ferolito’s sale negotiations to break down.
The AriZona Court went on to agree with Vultaggio that their claims justified “some semblance of a discount.” Those bases included the following:
- the fact that AriZona did not have audited financial statements for many years prior to the valuation date
- the extensive litigation between the shareholders,
- the uncertainty about the company’s S Corporation status,
- the transfer restrictions in the Owner’s Agreement.
These issues do not, in my opinion, justify a marketability discount of 25% for AriZona, as will be seen through the Court’s own analysis.
- Testimony showed that absent shareholder fighting, AriZona’s financial statements could readily be audited. The reasons for the lack of a completed audit stemmed from the litigation at hand. The Court stated:
“First, as Gelling’s testimony established, AriZona’s financial statements can be readily audited, particularly when the shareholders are no longer battling with each other.” (emphasis added)
- Importantly, the litigation between the two shareholders would be terminated by the very case at hand. The Court stated:
“Second, as credibly explained by Ferolito’s investment banker Rita Keskinyan, the litigation between the two shareholders would necessarily cease when one shareholder’s interests are acquired.” (emphasis added)
And the litigation would surely cease if 100% of the Company were sold as a “going concern” in the hypothetical transaction contemplated by Beway.
- The so-called “uncertainty about the company’s S-Corporations status” was likely immaterial. The Court stated:
“Third, the uncertainty about the company’s S-Corporation status is, at most, a scenario about which reasonable minds have differed.” (emphasis added)
Further, no buyer of AriZona would be concerned about the S corporation status. The buyer would only purchase assets if there were any concern at all. Any remaining issues re S corporation status would be a problem for the remaining owners of shell S Corporation (i.e., after assets are sold), and not a problem for the purchaser, who bought assets.
- Transfer restrictions on interests in a company’s equity in an Owner’s Agreement should logically have no impact on the value of 100% of the equity of a business sold as a going concern, which is the standard from Beway, which states that such restrictions should be “literally inapplicable.”
The AriZona Court undermined its own logic for a substantial marketability discount in its own analysis, at least as I read the decision from business and valuation perspectives.
I think that this discussion shows that a 25% DLOM for an attractive, saleable company like AriZona, is excessive and unreasonable, or, to use Justice Kornreich’s term, perhaps unfair.
DLOM and Prejudgment Interest
The combined impact of the three changes to assumptions in the Mercer Report’s financial control analysis lowered the Court’s adjusted financial control value to $1.911 billion (from $2.364 billion), which was derived in Figure 1 above. Figure 2 picks up at that point.
The Court imposed a 25% marketability discount. What does that mean? Well, it lowered value by some $478 million. That is a tremendous price for so-called lack of marketability or illiquidity, particularly given the obvious and demonstrable desire of capable buyers to acquire AriZona. I seldom use words like that in writing, but it is unavoidable. The conclusion of financial control value was lowered from $1.911 billion to $1.433 billion, which was the Court’s conclusion of fair value in AriZona.
For context, a marketability discount of 5% was allowed in the Adelstein v. Finest Food Distributing Co. based on assumed transaction costs on a sale of the business. As noted above and in the Mercer Report, with a company the size of AriZona, such transaction costs would be substantially lower than 5%. A 5% marketability discount would provide for almost $100 million of transaction costs in an actual sale of Arizona at the Court’s financial control value of $1.911 billion. That would, in my opinion, be quite excessive in itself.
At this point, we see that the Court found that prejudgment interest was due Ferolito because of the wait between the October 2010 valuation date and the October 2014 decision date. The prejudgment interest, which was set at 9%, continued based on the decision until the matter was resolved.
Prejudgment interest at a simple interest rate of 9% per year amounts to $129 million on a base fair value of $1.433 billion. In the four years between the valuation and decision dates, the accrual of interest raised the Court’s conclusion to $1.949 billion, as estimated in Figure 2.
The value of the combined Ferolito 50% interest in AriZona based on the conclusion of fair value plus prejudgment interest was therefore $975 billion, which was to accrue prejudgment interest at the rate of 9% (simple), or $64.5 million per year (or half of $129 million on 100% of the concluded fair value). These are big numbers, but AriZona is a big and valuable private company.
An Impermissible Minority Discount?
The Court performed its analysis and developed a conclusion of fair value at the financial control level of value of $1.911 billion. It then took a 25% marketability discount. We examined prejudgment interest in Figure 2. However, prejudgment interest is not part of value. It is interest, or payment for waiting from October 2010 (valuation date) to October 2014 (decision date) to receive the judicial determination of fair value.
We return to examining only the conclusion of fair value before the imposition of prejudgment interest in Figure 3.
Assume with me that the conclusion of strategic value in the Mercer Report of $3.204 billion is reasonable. In a real transaction, corporate tax rates would be used by real market participants and the tax amortization benefit would be considered in the negotiations leading to a transaction.
I am not arguing with the Court about the decision to disregard strategic control value in favor of financial control value, but it is important to see the impact of decisions and examine them in that light. As seen above, there is a $1.293 billion discount from the strategic control value to the Court’s financial control value. In the absence of litigation, Ferolito and Vultaggio each owns half of the option value of selling the company and receiving their respective shares of strategic control value.
The decision to move to financial control reduces the Ferolito share by $647 million, which is a direct addition to the Vultaggio option value. We will use this result below.
The Court imposed a 25% marketability discount to its concluded financial control value of $1.911 billion, yielding a resulting conclusion of fair value of $1.433 billion. However, the focus of the analysis is on the marketability discount of 25%, or $478 million dollars. Figure 4 focuses only on financial control value.
Figure 4 begins with the Court’s concluded financial control value of $1.911 billion.
Remember, value is value and interest is interest, so to understand the value transfers involved in the Court’s analysis, we have to focus on financial control value.
Ferolito and Vultaggio share in financial control value at 50% each. Their pro rata shares are therefore $956 million each, or half of $1.911 billion each. The Court imposed a 25% marketability discount, so the Ferolito share is reduced by $239 million, yielding an indication of fair value of $717 million, or 50% of the Court’s after DLOM value conclusion of $1.433 billion (Figure 3).
The results get interesting here. While Ferolito’s value is reduced by the marketability discount, Vultaggio’s value is increased by exactly the same amount. Vultaggio’s share of the Court’s financial control value is $1.194 billion, or 62.5% of financial control value of $1.911 billion. Vultaggio’s $717 million share represents only 37.5% of that value.
The result of the imposition of a 25% marketability discount is to transfer $478 million of value to the Vultaggio column, resulting in a 66.7% premium in value for Vultaggio. In other words, the imposition of the marketability discount at the enterprise level ($478 million) resulted in a shift in value of that entire amount to Vultaggio’s 50% interest.
The imposition of a marketability discount of 25% results in a dollar-for-dollar penalty in value for the seller in a fair value case where the ownership is 50%-50%. What this boils down to deserves highlighting:
Mathematically and practically, the imposition of a minority discount would do exactly the same thing as the imposition of a marketability discount. However, transferring value by imposing a minority interest discount is forbidden by Beway. If transferring value from the minority (or non-controlling) owners to the controlling owners is forbidden on the one hand (i.e., a minority discount), it would seem that the other hand (i.e., the marketability discount) would be forbidden as well. From the viewpoint of the non-controlling shareholder, there is no distinction – value transferred to the controlling owner(s) is value transferred by whatever name it is given.
I’m reminded of the father who told his son not to hit his sister after he was caught in the act. He stopped, but a few minutes later, he kicked her. When his father asked why he had done that, he said because you didn’t tell me not to kick her. Well, the New York courts say emphatically that you can’t hit your sister (i.e., by imposing a minority discount). But then the father (New York appellate courts) say you can kick her (by imposing a marketability discount). No wonder the kids (judges, lawyers, and business appraisers) are confused.
This is an issue that desperately needs clear appellate court guidance in New York.
In Figure 5, we see that there is countervailing logic against the marketability discount, because given that the Court in the AriZona matter selected the financial control level of value rather than the strategic level, potential value is definitely transferred to Vultaggio in this case and controlling owners in general when marketability discounts are applied.
Figure 5 examines both the potential shift in value in moving from strategic to financial control as well as the actual shift in value by imposing a 25% marketability discount in the AriZona matter.
In Figure 5, we again begin with the strategic control value from the Mercer Report of $3.204 billion.
Line 1. Ferolito and Vultaggio each share, while they are 50%-50% owners, this potential value (or option), or $1.602 billion each in value. We calculated the discount in potential value from the strategic level down to Court’s financial control to be $1.293 billion (i.e., from $3.204 billion down to $1.911 billion) in Figure 3.
Line 2. This results in a loss of potential value of $647 million (half of the discount from Strategic Control to Financial Control) for Ferolito, which is accretive to value to Vultaggio by exactly the same amount. What that means is that, at least theoretically, the day after the settlement, Vultaggio could sell the Company for $3.204 billion and reap a substantial windfall. That potential windfall is the $647 million discount for Ferolito that is added to the Vultaggio column.
Line 3. The financial control value for Ferolito is $956 million. In practical terms, Vultaggio would receive $3.204 billion in the hypothetical sale and then pay Ferolito at the $956 million financial control value (or repay the lender), leaving him with $2.249 billion. This amount is 2.4 times greater than the financial control value accorded to Ferolito.
Line 4. At this point, we apply the Court’s 25% marketability discount in the Ferolito column. The way things work, this is a direct shift of an equivalent amount to Vultaggio.
Line 5. The concluded fair value for the 50% Ferolito share of AriZona is $717 million. This compares to the concluded potential value for Vultaggio of $2.488 billion, or 3.5 times greater.
I am not arguing for the use of strategic control value in New York fair value cases. That is a matter for New York appellate courts to decide. However, I am suggesting that for the potential benefit of strategic value that applies in operating business cases for remaining owners, equity (dare I use that word) could call for the elimination of the marketability discount in New York fair value cases.
Without providing detailed evidence at this point, I can safely say that the great majority of jurisdictions in the United States have reached this conclusion.
Concluding Thoughts
This has been a lengthy analysis. Let’s conclude with a few highlights:
- In my opinion, at least, the logic supporting a marketability discount of 0% for attractive, marketable companies, and relevant comparisons to AriZona, should have supported the 0% conclusion for the marketability discount in the Mercer Report in New York fair value cases.
- The case law logic supporting a minority discount of 0% in selected New York cases would also, if applied consistently, support a 0% marketability discount for an attractive, saleable company like AriZona.
- In this matter, any valuation discount, whether a minority discount or a marketability discount, has the effect of transferring value directly from the non-controlling owner(s) to the controlling owner(s).
- As shown in this analysis, the selection of financial control as the appropriate level of value for an operating company like AriZona already provides a potential “windfall” for controlling shareholders. I’m not suggesting that any court should order a sale of a company to achieve this value or select strategic value as the appropriate level of value for fair value. However, I do suggest that it is an equitable issue that could or should be considered in fair value determinations in New York.
- Lastly for this summary, prejudgment interest is not value as of a valuation date. We cannot reasonably look at the Court’s conclusion, including interest, as the conclusion of fair value. That conclusion represents fair value plus prejudgment interest, and interest is interest, not value. The enormous transfer of value and potential value that occurred with this decision is masked by thinking that the final conclusion, including interest, represents fair value. Fair value was – and had to be – determined at the valuation date of October 5, 2010.
In the final analysis, the Court substantially agreed with the DCF method as employed in the Mercer Report, differing only on three assumptions. The Court then applied a marketability discount of 25%, which, in my opinion and based on the analysis above, was not differentiated to AriZona and was not justified. In fact, it was undermined by the Court’s own analysis.
The good news is that the matter has been settled between the parties. A long and contentious period of litigation has ended. The settlement has not been made public, and that likely will not occur.
The bad news is that the Court of Appeals in New York will miss an excellent opportunity to reexamine the marketability discount issue.
ENDNOTES
- John M. Ferolito and JMF Investments Holdings, Inc., Plaintiffs, against AriZona Beverages USA LLC, AZ National Distributors LLC, AriZona Beverage Company LLC, Defendants, In the Matter of the Application of John M. Ferolito, the Holder of More Than 20 Percent of All Outstanding Shares of Beverage Marketing, USA, Inc., Petitioner, For the Dissolution of Beverage Marketing, USA, Inc., John M. Ferolito and the John Ferolito, Jr. Grantor Trust (John M. Ferolito and Carolyn Ferolito as Co-Trustees), both individually and derivatively on behalf of Beverage Marketing USA, Inc., Plaintiffs, against Domenick J. Vultaggio and David Menashi, Defendants. New York Supreme Court, Nassau County, No. 004058-12. (“Ferolito v. Vultaggio”)
- Others have written about the AriZona Matter, including:
Peter Mahler, New York Corporate Divorce Blog, “Court Rejects Potential Acquirers’ Expressions of Interest, Relies Solely on DCF Method to Determine Fair Value of 50% Interest in AriZona Iced Tea,” October 27, 2014
Gilbert E Matthews (Parts I and II) and Michelle Patterson (Part II):, Financial Valuation and Litigation Expert, “How the Court Undervalued the Plaintiffs’ Equity in Ferolito v. AriZona Beverages:”
“Part I: Tax-Affecting S Corporation Earnings” (April/May 2015)
“Part II: Ferolito and the Application of DLOM in New York Fair Value Cases” (June/July 2015).
- Friedman v. Beway Realty Corp., 87 N.Y.2d 161, 168 (1995) (emphasis in original) (quoting Matter of Pace Photographers, Ltd., 71 N.Y.2d 737, 748 (1988)).
- Ferolito v. Vultaggio.
- Expert Report of Richard S. Ruback, dated February 17, 2014, with valuation conclusions as of December 31, 2010 (“the Ruback Report”), page 4.
- Ferolito v. Vultaggio.
- Ferolito v. Vultaggio.
- The forecasted growth in the Mercer Report for financial control was actually at a CAGR of 7.7%. The Court’s reference to a 10.2% CAGR actually applied to Mercer’s strategic control value, which considered the ability of a strategic partner to enhance growth. Both forecasts were provided in the Bellas Report previously mentioned.
- Ferolito v. Vultaggio.
- Pratt, Shannon P., Valuing a Business Fifth Edition (McGraw Hill, 2008), pp. 618-619.
- Francis A. Longstaff. “How Much Can Marketability Affect Security Values?” The Journal of Finance, December 1995, Vol. 50, No. 5, pages 1767-1774, and William L. Silber. “Discounts on Restricted Stock: The Impact of Illiquidity on Stock Prices.” Financial Analysts Journal, July August 1991, pages 60-64.
- Citing an analysis prepared by Mercer in a book published in 1997. Mercer, Z. Christopher, Quantifying Marketability Discounts (Peabody Publishing, 1994), pages 63-66.
- Ferolito v. Vultaggio.
- Ferolito v. Vultaggio.
- Matter of Giaimo v. Vitale, 2011 NY Slip Op 50714(U) (Sup. Ct. NY County).
- Matter of Giaimo v. Vitale, 2012 NY Slip Op 08778 [101AD3d 523].
- Man Choi Chiu and 42-52 Northern Boulevard, LLC v Winston Chiu Index Nos. 21905/07, 25275/07.
- Beway v. Friedman.
- Matter of Walt’s Submarine Sandwiches, 173 A.D.2d 980, 981 (3d Dep’t 1991).
- The Mercer Report, Master Page 105.
- Ruggiero v. Ruggiero, Index No. 36299-2012 (2013).
- The Mercer Report, Master Page 104.
- The Mercer Report, Master Page 104.
- O’Brien v. Academe Paving, Inc., Index No. 99-2594 RJI No. 99-1794-M, at 13-14 (Sup. Ct. Broom Cnty. 2000).
- Ferolito v. Vultaggio.
- O’Brien v. Academe Paving, Inc., Index No. 99-2594 RJI No. 99-1794-M, at 13-14 (Sup. Ct. Broom Cnty. 2000).
- The Mercer Report, Master Page 104.
- Quill v. Cathedral Corp., RJI 10-90-2887, at 8 (Sup. Ct. Columbia Cnty, June 8, 1993).
- Quill v. Cathedral Corp. 215 A.D.2d 960 (3d Dep’t 1995).
- The Mercer Report, Master Page 104.
- Adelstein v. Finest Food Distributing Co., 2011 WL 6738941 (N.Y.Sup.), 2011 N.Y. Slip Op. 33256(U) (Sup. Ct. Queens Cnty. Nov. 3, 2011).
- Mercer Report, Master Page 105.
- Zelouf International Corp. v Zelouf, 2014 NY Slip Op 51462(U) [Sup Ct, NY County Oct. 6, 2014].
- Peter Mahler, New York Business Divorce Blog, “Court’s Rejection of Marketability Discount in Zelouf Case Guided by Fairness, Not ‘Formalistic and Buzzwordy Principles’,” January 5, 2015.
- Zelouf International Corp. v. Zelouf, Index 653652/2013 (Dec. 22, 2014).
- Cortes v 3A N. Park Ave Rest Corp., 2014 WL 5486477 (Sup Ct, Kings County Oct. 29, 2014).
Unlocking Private Company Wealth
Unlocking Private Company Wealth will be shipped to you within one business day of receipt of your order.
Quantity Discounts
- 1 – 4 books | $25.00 per
- 5 – 24 books | $20.00 per
- 25 – 49 books | $19.00 per
- 50 – 99 books | $18.00 per
- 100 – 199 books | $16.00 per
- 200 – 499 books | $15.00 per
- 500 – 999 books | $12.50 per
- 1,000+ books | $10.00 per
For Business Owners and Advisers to Business Owners
Unlocking Private Company Wealth is all about managing the wealth represented by your ownership of a private business. The book calls for business owners to treat their illiquid, private company wealth with the same care and respect as their liquid wealth and retirement funds.
Unlocking Private Company Wealth is written directly to you as a business owner. And if you are a baby boomer business owner, it will speak even more directly to you.
Unlocking Private Company Wealth will help you turn your business into the liquidity-creating vehicle it needs to be for you to become independent of the business and truly free to sell it, stay with it, or transition it to others of your choice.
Here what one business owner says:
I used to think it was odd how business owners would closely monitor the performance of a few hundred thousand dollars in a retirement account, but have no idea how many millions their business was worth. Stranger still was the fact that their financial advisers didn’t seem to recognize this as a problem.
Unlocking Private Company Wealth illuminates this lopsided view of wealth management and offers a number of smart solutions to fit any business owner situation. This book is a must read for business owners and their advisers.
Not reading it – or taking Chris Mercer’s wisdom to heart – is leaving money on the table. Unlocking Private Company Wealth brings clear perspective and concrete solutions to one of the missing pieces of business ownership – how to turn a lifetime of work into a legacy of wealth.
Barbara Taylor, MBA, Co-Founder, Allan Taylor & Company, Rogers, Arkansas
Business Advisers
If you are an adviser to private business owners, then Unlocking Private Company Wealth is also written for you. It will help you understand how to talk to business owners about managing their private company wealth. It will provide you with a diagnostic tool to help you understand your private company owners’ needs regarding wealth management. Unlocking Private Company Wealth will help you help your clients in ways they will appreciate.
Another business owner says:
It is best to take action when the circumstances are favorable and the timing is right. Unlocking Private Company Wealth examines strategies you can implement now to increase the future value of your closely held business.
Bill Rankin, CPA, Chief Financial Officer, Blue Bell Creameries, LP, Brenham, Texas
Like Bill Rankin says, you definitely want to bring strategies to the table to enhance the future wealth of your business owner clients.
Whether you are a business owner or an adviser to owners, Unlocking Private Company Wealth is a must-read for you. It is a must-share with your fellow owners, or, for business advisers, with your business owner clients.
