
Production and Activity Levels
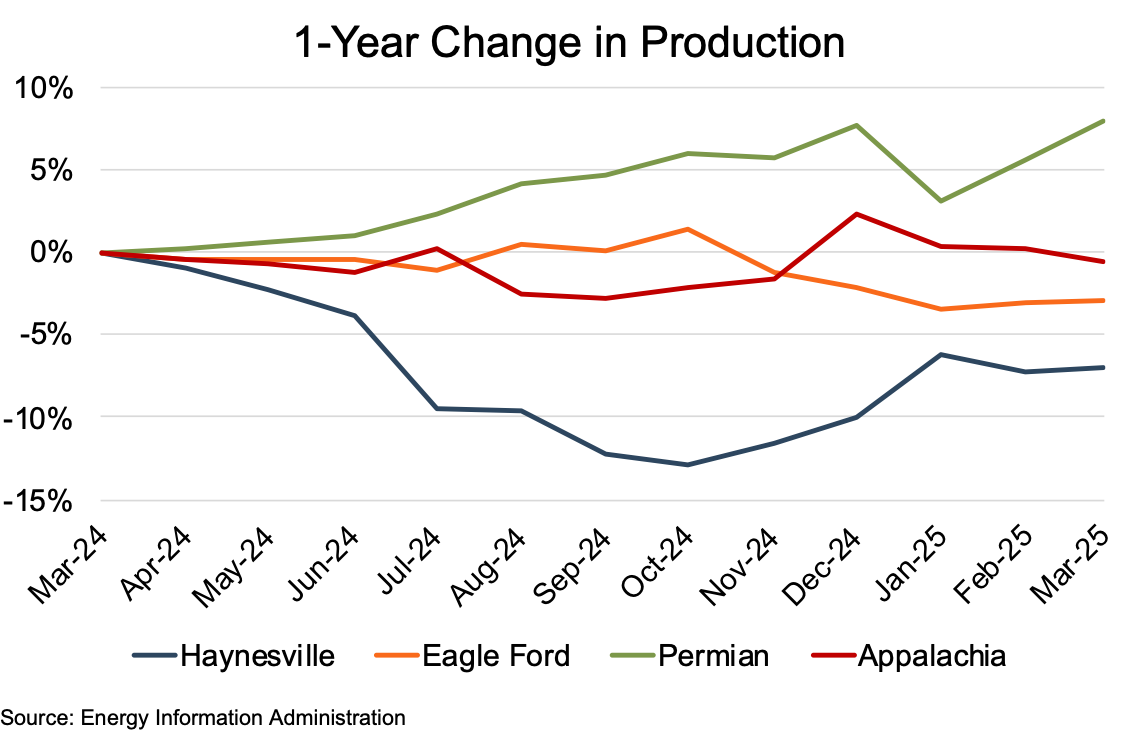
Eagle Ford production (on a barrels of oil equivalent, or “boe” basis) dipped 2.9% since March 2024. Production levels varied only slightly during the twelve-month period, with the rolling monthly percentage change in March varying between -3.5% and 1.4%. Appalachian production change over the period was similar to that of the Eagle Ford, ending at a 0.5% decline, with March 2024 varying between -2.8% and 2.3%.
The Permian and Haynesville year-over-year (YoY) production changes were markedly different, with the Permian ending the review period 7.9% above its March 2024 production level. Permian production saw fairly consistent monthly growth, with only two months where the production level declined from the previous month, one of those being a negligible 0.2% decrease. Haynesville posted the most significant decrease over the review period, ending with a YoY 7.1% decline. Over the last twelve months, Haynesville production ranged by as much as 12.9% below March 2024 levels after consistent decreases in the seven months through October.
The Haynesville production decline was spurred by weak natural gas prices and related cuts in Haynesville rig counts. The more modest production decrease in Appalachia, combined with the Haynesville decline, led to the first shale-based natural gas production decrease in the past 25 years.
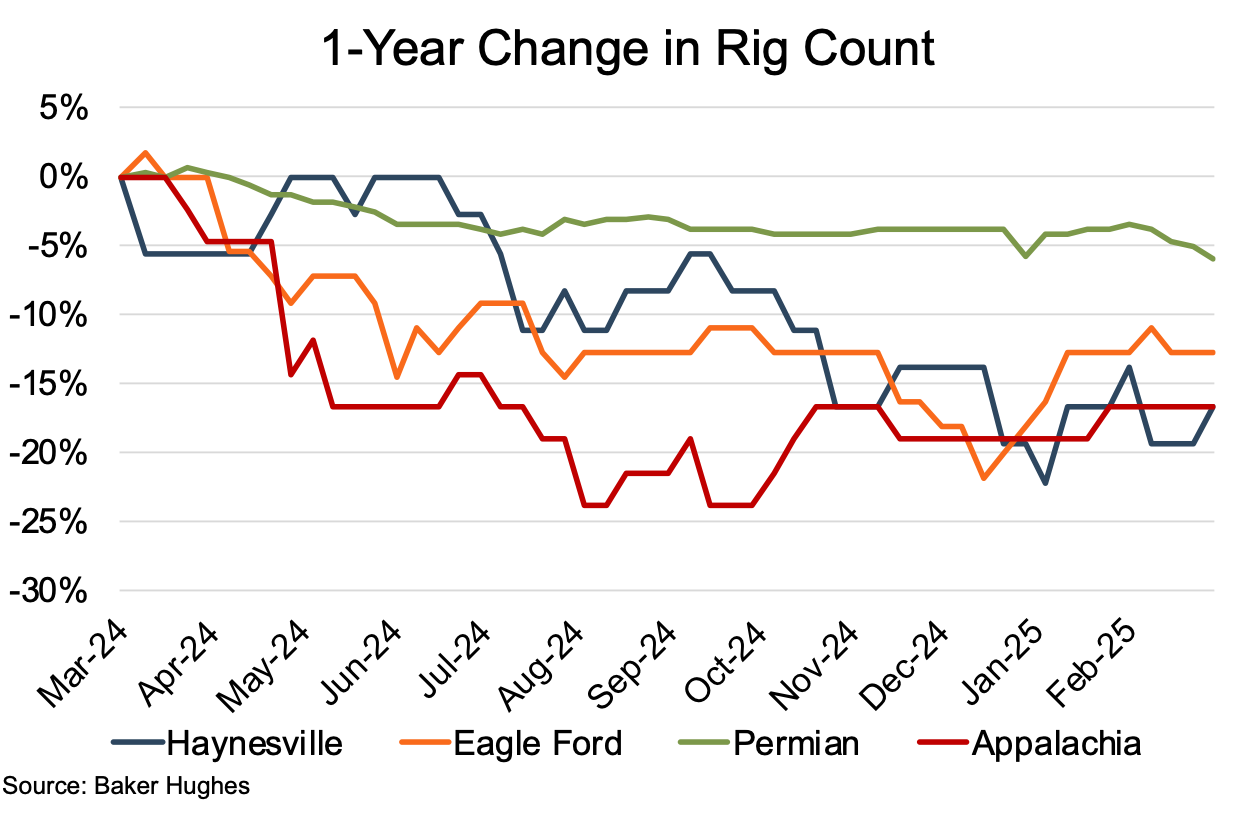
 All four regions suffered rig count declines over the year ending March 2025. Haynesville and Appalachia tied for the largest percentage decline at 17%, with Eagle Ford posting a slightly lower 13% decline. Even the stalwart Permian ended the period with a YoY decline, though the most modest for the four regions, at 6%. The returning culprit was reduced commodity prices, leading to the rig count reductions.
The oil-heavy Permian showed the least punctuated rig count declines, with the largest single-week drop being a mere 2%. The Eagle Ford and the gas-heavy Haynesville and Appalachia showed many more significant weekly dips. The Eagle Ford suffered weekly drops of 4% to 5% four times during the review period, while the Haynesville posted 6% weekly dips five different times. Appalachia posted three 5% decline weeks in just the first seven months of the review period and a period-record 10% plunge in May. Notably, the Appalachian rig count significantly stabilized following its last 5% dip in October. At one point in the review period, the Pennsylvanian rig count fell to only 12, marking the lowest statewide rig count in the last 17 years.
All four regions suffered rig count declines over the year ending March 2025. Haynesville and Appalachia tied for the largest percentage decline at 17%, with Eagle Ford posting a slightly lower 13% decline. Even the stalwart Permian ended the period with a YoY decline, though the most modest for the four regions, at 6%. The returning culprit was reduced commodity prices, leading to the rig count reductions.
The oil-heavy Permian showed the least punctuated rig count declines, with the largest single-week drop being a mere 2%. The Eagle Ford and the gas-heavy Haynesville and Appalachia showed many more significant weekly dips. The Eagle Ford suffered weekly drops of 4% to 5% four times during the review period, while the Haynesville posted 6% weekly dips five different times. Appalachia posted three 5% decline weeks in just the first seven months of the review period and a period-record 10% plunge in May. Notably, the Appalachian rig count significantly stabilized following its last 5% dip in October. At one point in the review period, the Pennsylvanian rig count fell to only 12, marking the lowest statewide rig count in the last 17 years.
Commodity Prices
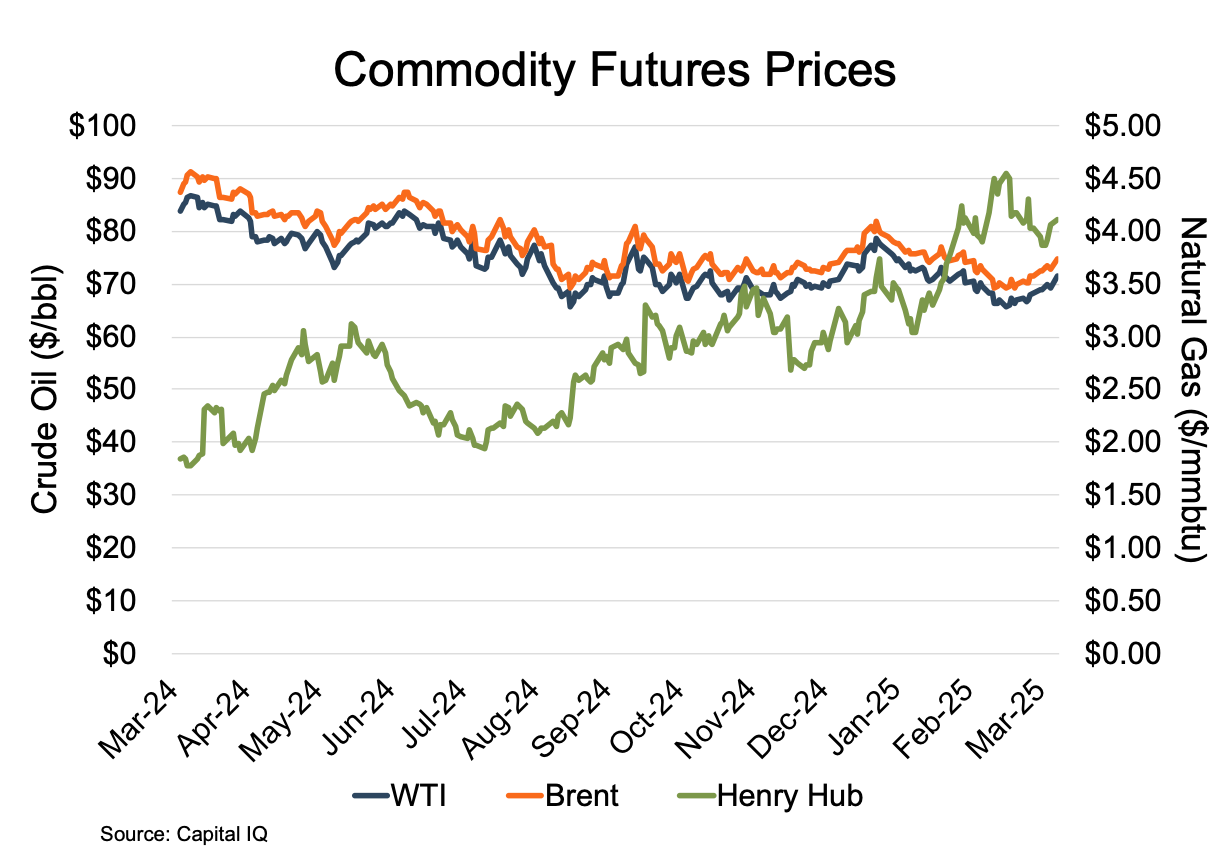
Oil prices, as represented by the West Texas Intermediate (WTI) and Brent Crude (Brent) front-month future contracts, generally declined over the year ending March 2024, ending the review period 15% and 14%, respectively, below their prior-year levels. Oil prices began the review period at $83.71 and $87.42, coming off a 3-month rise related to rising tensions in the Middle East and continuing OPEC+ production cuts that eased concerns about too much U.S. production.
Although OPEC+ continued its production decreases into mid-2024, the next five months saw a fairly steady decline in the oil benchmarks, with WTI reaching $65.75 (down 24% from early April) and Brent reaching $69.19 (down 23%) on non-OPEC production growth and economic weakness slowing oil consumption growth. Other than a short spike during the first week of October (again tied to Middle East tensions but with Iran launching an estimated 200 missiles into Israel), both futures held fairly steady through year-end, with WTI holding within a range of $66 to $71 and Brent at $72 to $76.
Prices rose in late December and early January on concerns over a potential reduction of Russian crude oil supplies when the United States imposed a new round of sanctions on Russia’s energy sector. The decline in the general review period returned in mid-January when WTI reached its review period low of $65.68 in mid-March.
Henry Hub natural gas front month futures prices began the review period with a 73% run-up from $1.79 in early April to $3.09 in mid-June. The run-up resulted from natural gas supplies increasing less than expected, indicating production pullback and upcoming summer demand. Prices fell back to late April levels by early August due to an unusually mild summer and rising storage inventories.
From that mid-2024 low, prices began an eight-month 112% climb to $4.12 at the end of March, with a particularly steep climb during the first three weeks of February that saw the price shoot up from $3.04 to $4.25. The late 2024 through Q1 2025 run was attributable to multiple factors, including unexpected severe winter weather driving up demand, weather-related “freeze-offs” that stifled production, reduced wind speeds limiting wind-based energy production, and rising global LNG demand.
Financial Performance
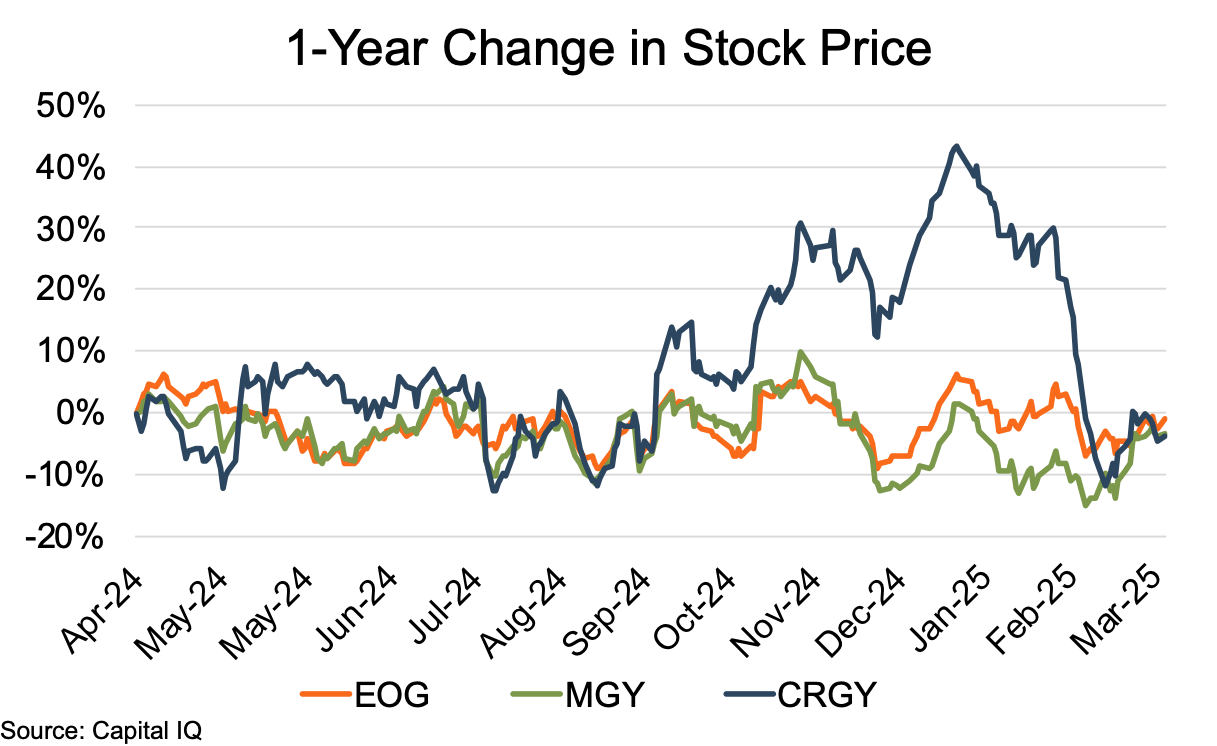
Stock prices among the public comparable group for Eagle Ford showed YoY declines within a narrow range of 1% to 4%. However, the “path” to those similar YoY declines was markedly different for EOG Resources (EOG) and Magnolia Oil & Gas (MGY) versus Crescent Energy (CRGY). EOG and MGY posted similar patterns of rises and falls during the review period, generally varying between year-to-date (YTD) increases and declines between +10% and -10%. Only MGY broke outside of that +10% to -10% range during the last four months of the period. Even the range breakout only took MGY’s YTD price change down to lows of -13% in mid-December and early February and to a review period low of -15% in early March.
CRGY followed a very different price path. Its stock price movements were somewhat similar to EOG and MGY through the end of September. However, starting in October, investor sentiment pushed the company’s share price upward in three separate spikes that carried its YTD performance from -6% in late September to 13% in early October, from 4% in late October to 30% in late November, and from 12% in mid-December to 42% in mid-January.
The upward drive was primarily the result of investors showing greater confidence in the company capitalizing on strategic initiatives, such as its successful integration of SilverBow, buying pressure resulting from the company being added to the S&P Small Cap 600 index, and the December announcement of its acquisition of Ridgemar Energy.
The share price turned downward in late January, near the time the Ridgemar deal closed, with the decline picking up steam in late February as the YTD price change fell from its review period high of 42% to 24% in mid-February and on down to -12% in mid-March. It took a mid- to late-March rebound to propel its YTD performance back to -4% at the end of the month.
Conclusion
Despite a notable rig count decline, Eagle Ford production was only modestly reduced over the twelve months ended March 2025. Modestly declining commodity prices combined with the formation’s falling rig count pushed the region’s benchmark groups’ stock prices into single-digit declines over the review period.
Although M&A activity in the Eagle Ford remained minimal, with only two material transactions over the last twelve months, Andrew Dittmar, with Enverus Intelligence Research, noted that the Eagle Ford remains the most fragmented of the major unconventional plays and provides substantial opportunities to build via acquisition.
Mercer Capital has assisted many clients with various valuation needs in the upstream oil and gas space for both conventional and unconventional plays in North America and around the world. Contact a Mercer Capital professional to discuss your needs in confidence and learn more about how we can help you succeed.