Appalachian Production Marches on Despite Henry Hub Plunge


The economics of oil & gas production vary by region. Mercer Capital focuses on trends in the Eagle Ford, Permian, Bakken, and Marcellus and Utica plays. The cost of producing oil and gas depends on the geological makeup of the reserve, depth of reserve, and cost to transport the raw crude to market. We can observe different costs in different regions depending on these factors. This quarter, we take a closer look at the Marcellus and Utica shales.
Production and Activity Levels
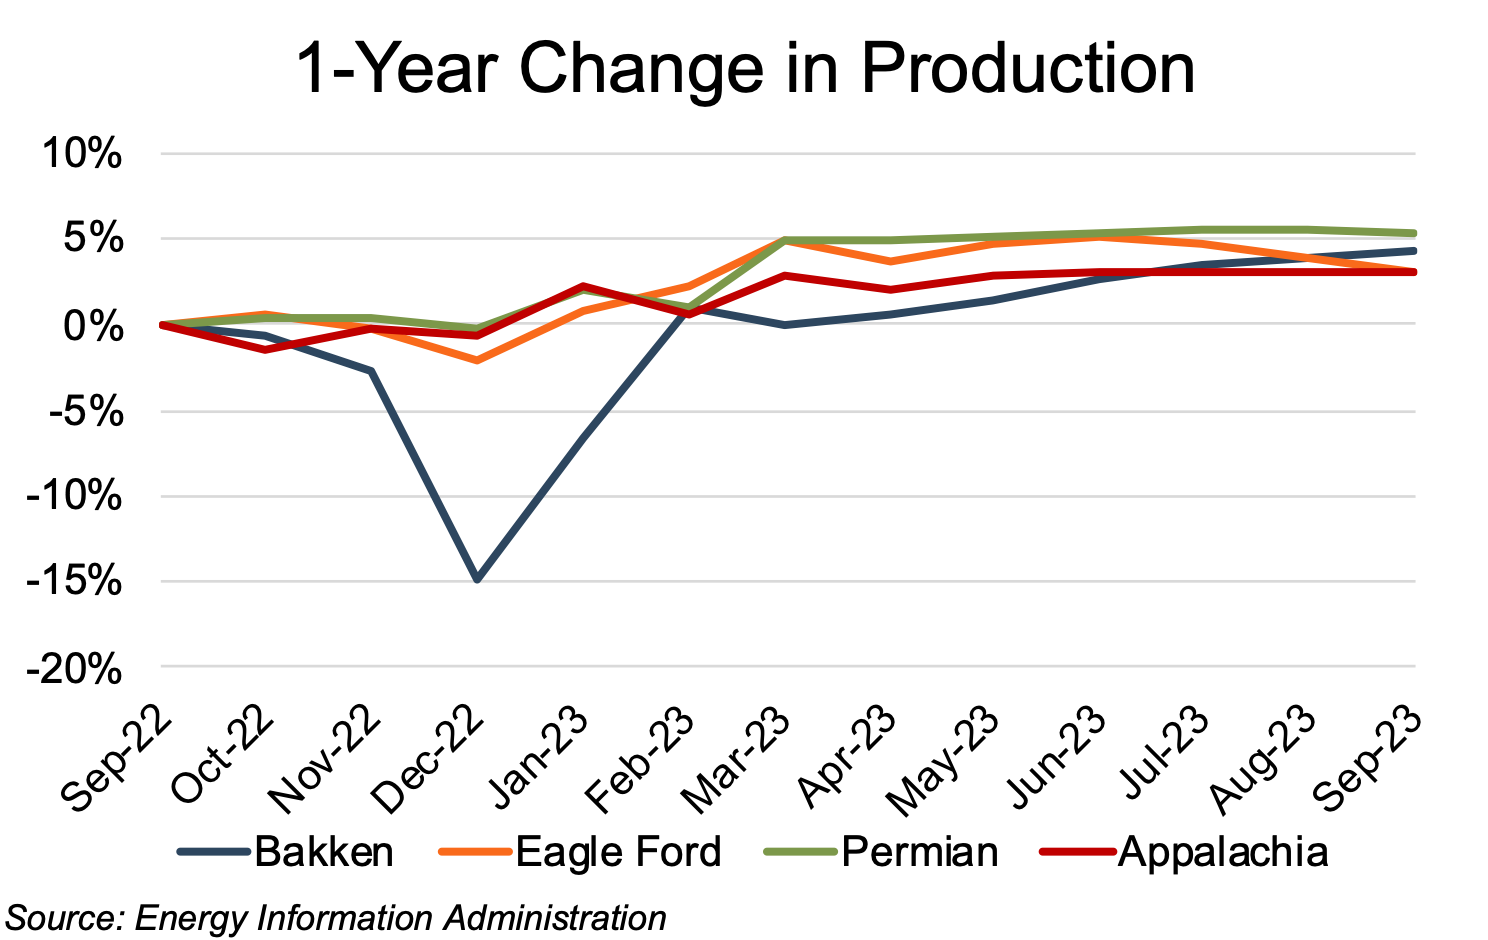
Estimated Appalachian production (on a barrels of oil equivalent, or “boe” basis) rose 3% year-over-year through August. The basin’s largest volume increases for the twelve-month review period occurred in December 2022 and February 2023, with monthly increases of 2% and 4%, respectively. Year-over-year production in the Eagle Ford, Permian, and Bakken increased 3%, 5%, and 4%, respectively, with little differentiation beyond the Bakken’s typical winter weather-induced interruption.
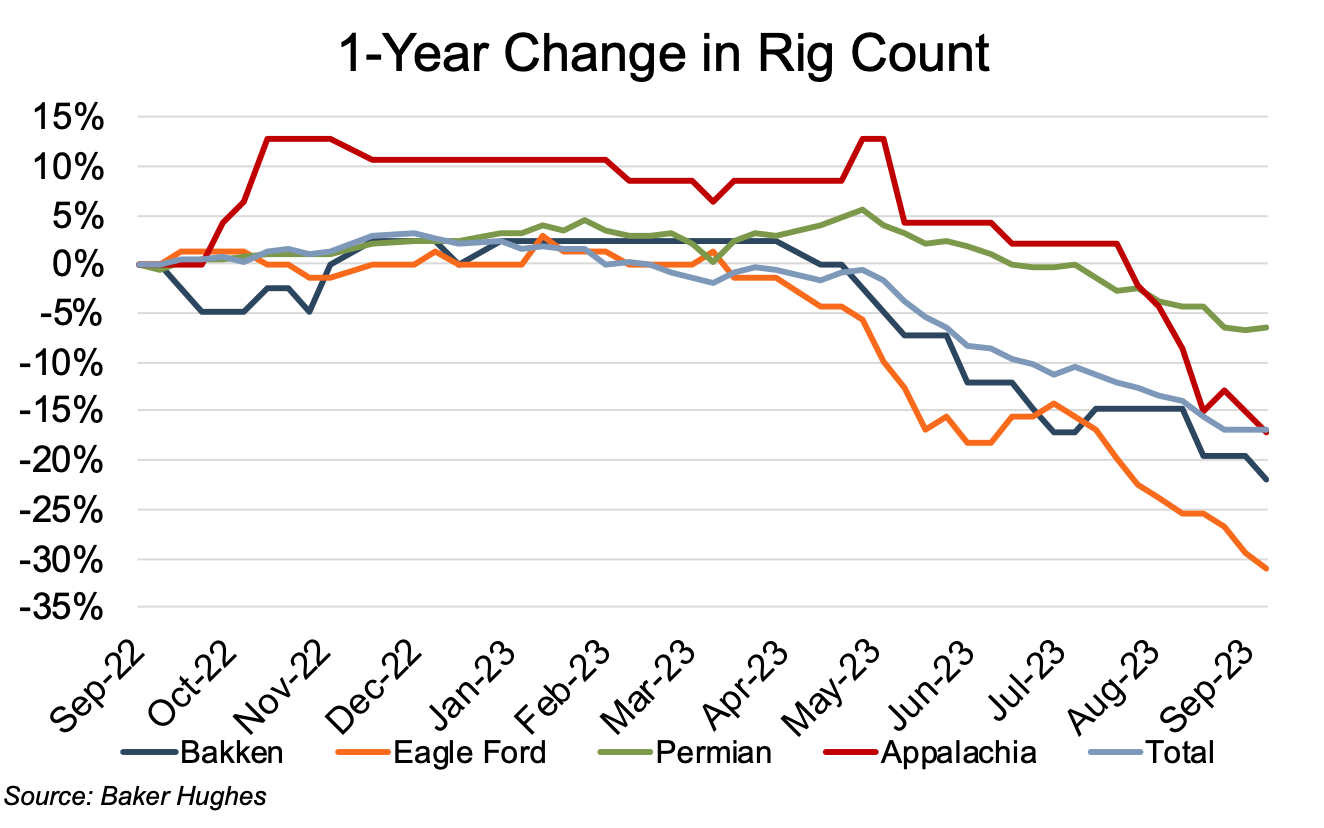
Rig counts fell markedly during the twelve-month period, with the steepest declines occurring from May to August. As is frequently the case, the higher production cost, oil-focused basins (the Bakken and Eagle Ford) posted the largest rig count declines at 22% and 31%, respectively. The lower production cost Permian posted a more modest 6% decline over the twelve-month period. The natural gas-rich Appalachia fell in between those extremes at a 17% decline. Total rig count dropped by 17% from 760 to 632.
Commodity Price Volatility
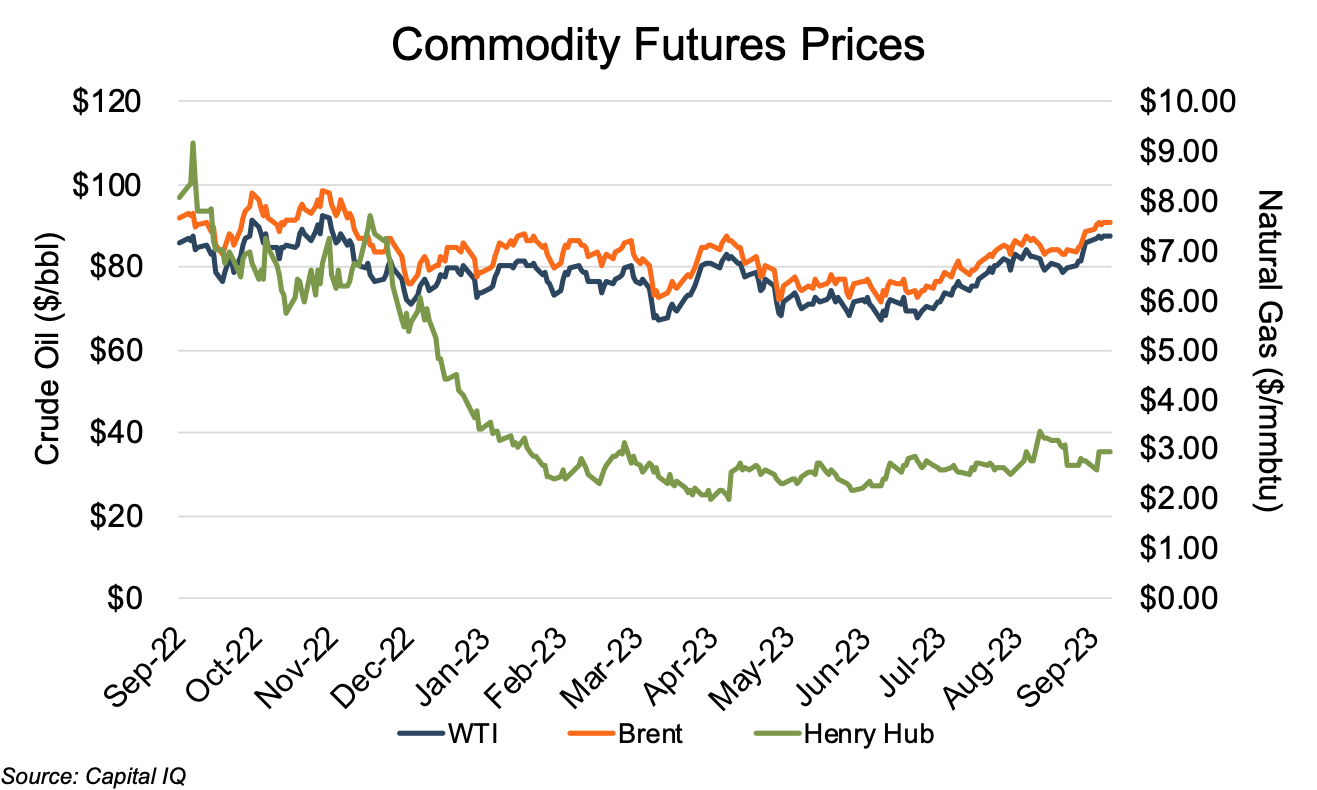
Henry Hub natural gas front month futures prices eased downward from the September 2022 average price of $7.62 ($/MMBtu) to an October-November 2023 average of $6.64 before plunging 61% over the December-January period to $2.68. Since then, the price has varied between $2.01 and $3.36, with only a slight upward trend. The winter month decline resulted from unexpectedly warmer temperatures across the country that reduced demand pressure and slightly increased supply.
Oil prices, as benchmarked by West Texas Intermediate (WTI) and Brent Crude (Brent), showed much less volatility during the twelve-month period, generally easing from November to June before beginning a fairly steady rise through August. The WTI decreased from its twelve-month high of $93/bbl in early November to $68/bbl in late June before its steady recovery to $89 in early September. Brent showed a near-mirror pricing pattern, albeit at its typical slightly high prices. Starting at $98/bbl in early November, the Brent price edged below $72 in mid-June before an upward march to nearly $91 in September.
Financial Performance
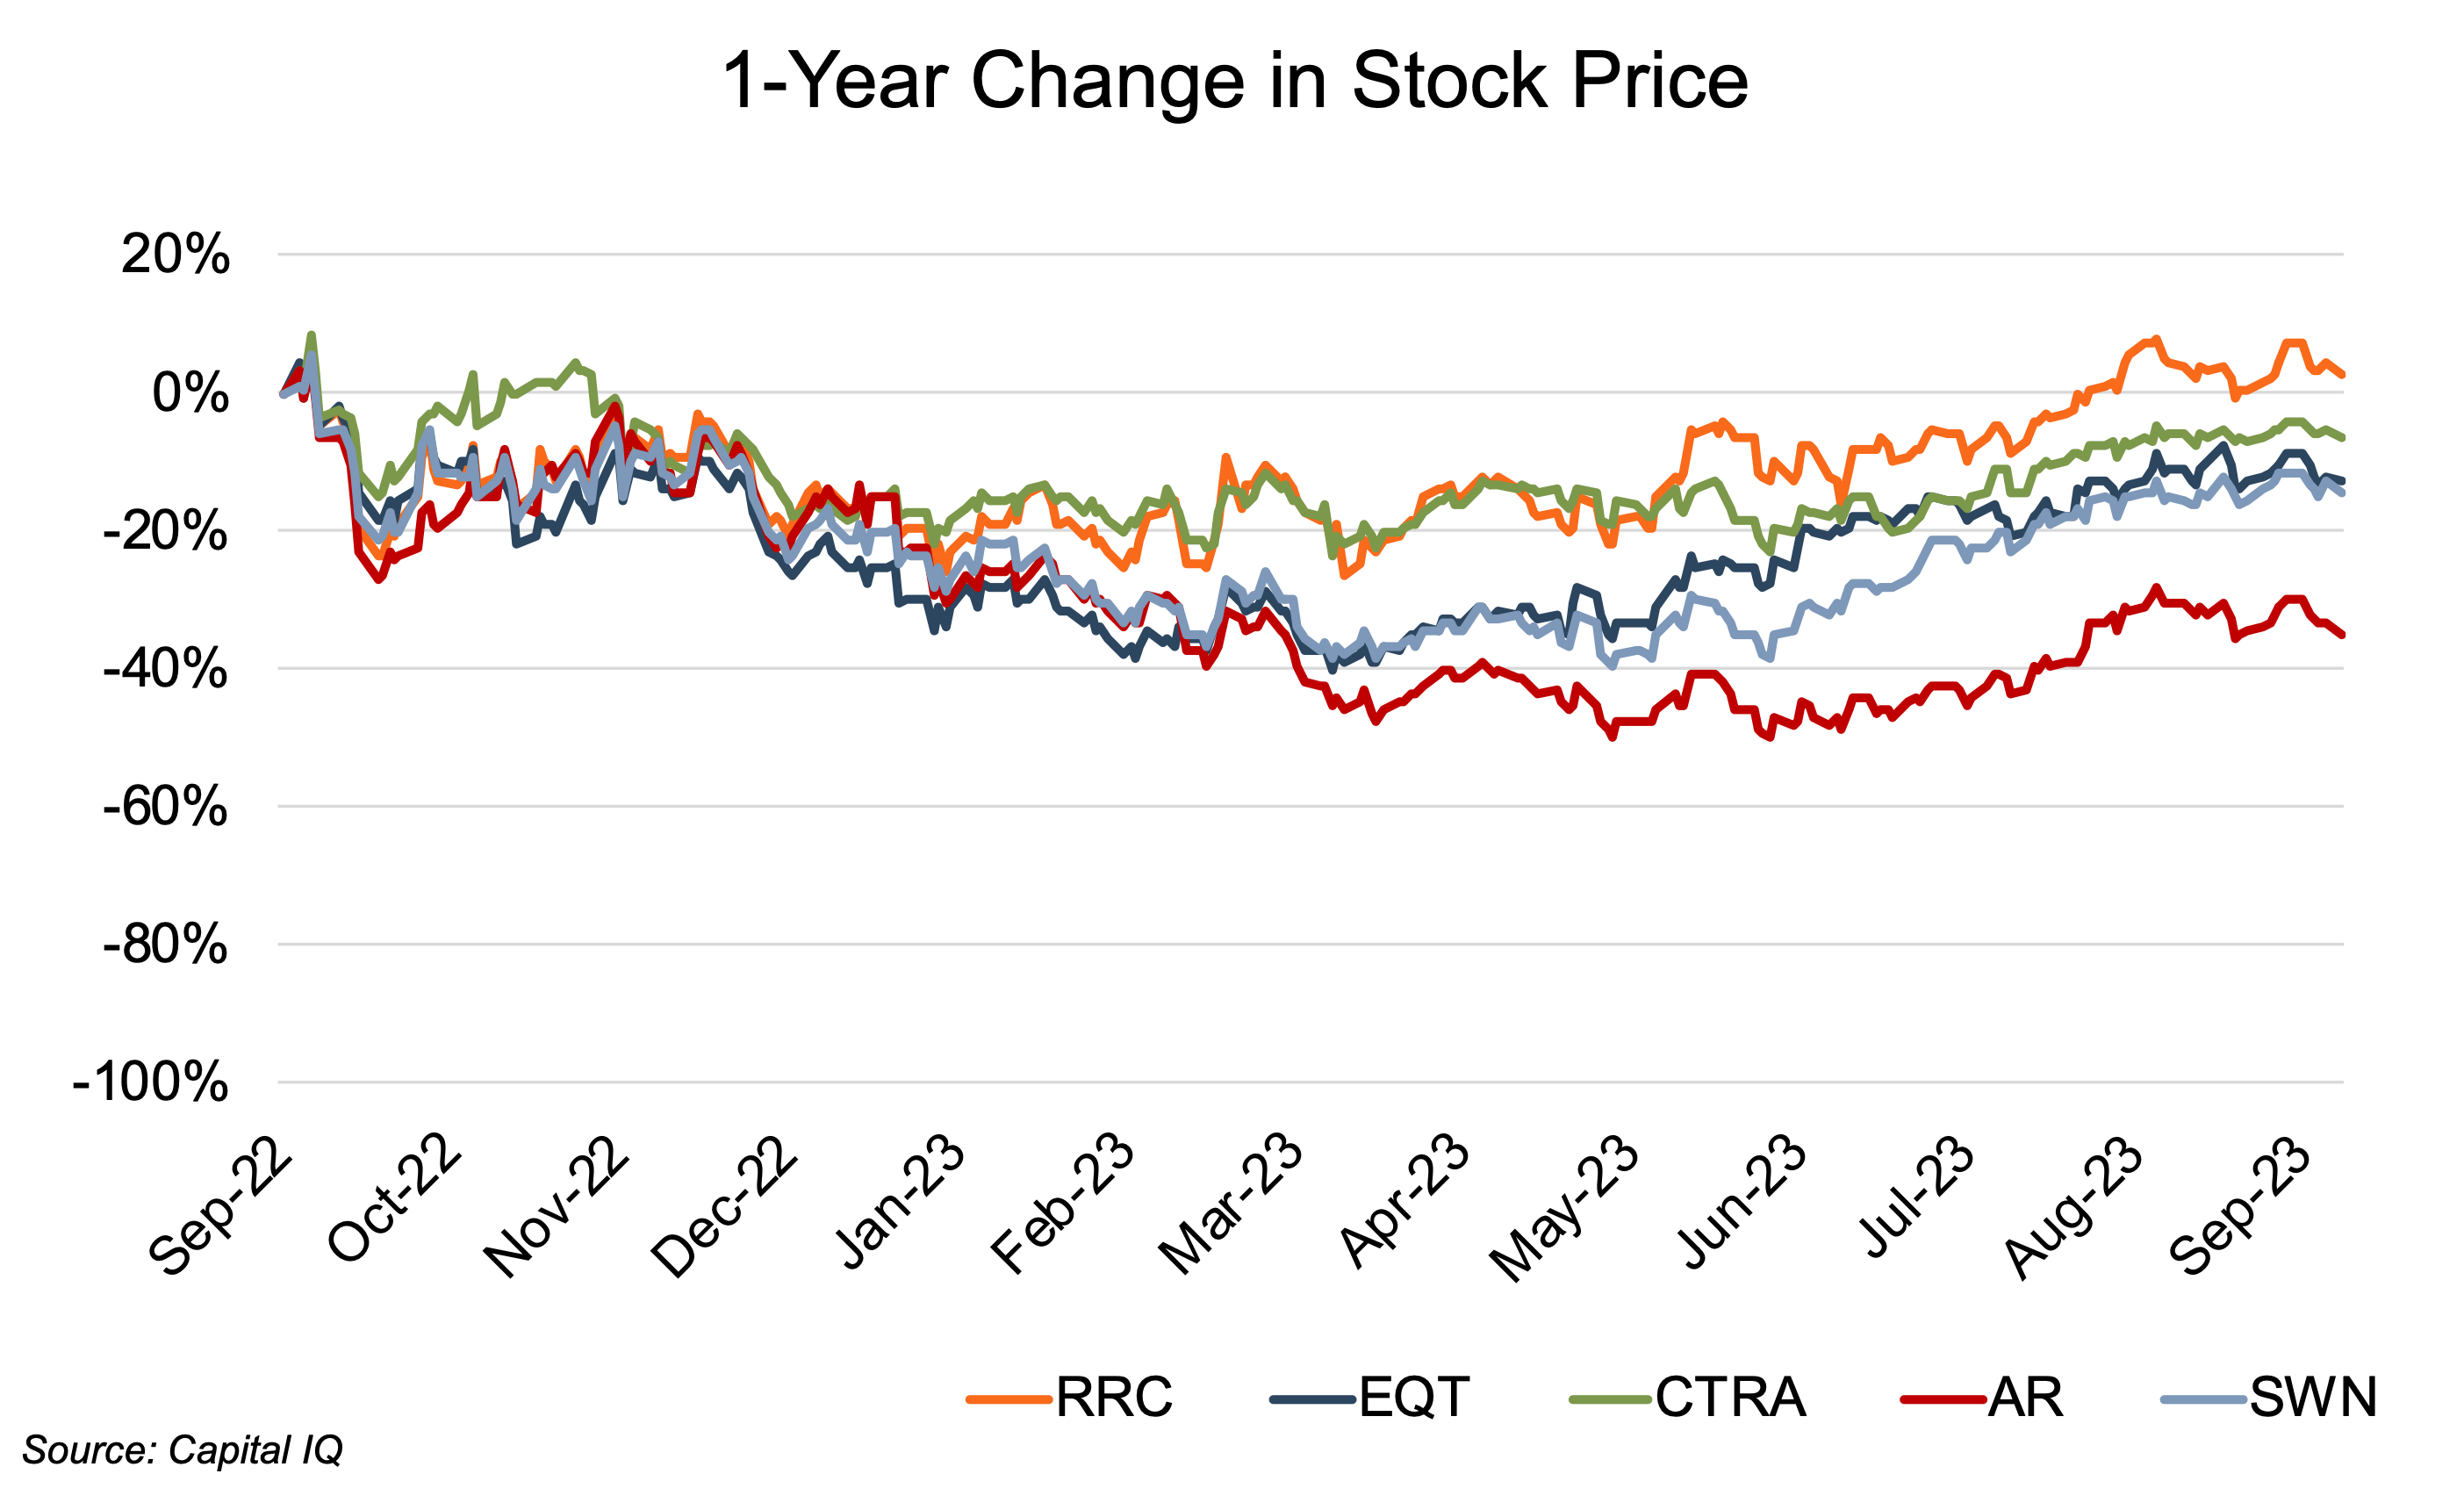
The Appalachian public comp group saw markedly weak stock price performance over the past year (through September 11, 2023), with only Range Resources ending the 12-month period above its September 2022 starting price. The remaining comp group members (EQT, Coterra, Antero, and Southwestern) all posted twelve-month declines ranging from 7% for Coterra to 35% for Antero. The comp group stock prices generally followed the trend in oil prices, although the early period decline only held through March, after which a general recovery ran through the end of the review period in September. Through mid-March, the average comp group decline had reached 34%. However, the subsequent recovery in oil prices led to an average comp group price increase of nearly 32% through early September.
Range Resources’ leading price-performance was buoyed by its lower average production cost compared to the Appalachian public comp group and compared to natural gas peers as a whole. With the lowest stock price performance during the review period, Antero was impacted by commodity derivative losses, including a $559 million cash payment on derivative loss settlements.
Conclusion
Appalachian production fared well during the twelve-month review period, particularly considering the sharp decline in the Henry Hub price. Despite the Henry Hub decline, the Appalachian rig count decline was less than that of two of the three oil-rich basins presented, largely due to Appalachia’s higher production declines, which require a higher rig count to maintain production levels. In addition, the U.S. Energy Information Administration (EIA) attributes some natural gas production volumes support to reduced power generation from coal-fired sources, which necessitates greater generation from natural gas-fired electricity sources. Furthermore, as detailed in our 2022 Energy Valuation Insights focused on the Appalachian basin, the demand for new natural gas supplies to Europe provides a countervailing wind to any potential downward movement in natural gas prices. As indicated in the American Gas Association’s September Natural Gas Market Indicators report, the U.S. exported more LNG than any other country during the first half of 2023, with a daily average of approximately 11.6 Bcf. Continued strong demand for LNG in Europe is a material consideration in the EIA’s expectation for even greater U.S. natural gas production in 2024.
We have assisted many clients with various valuation needs in the upstream oil and gas space for both conventional and unconventional plays in North America and around the world. Contact a Mercer Capital professional to discuss your needs in confidence and learn more about how we can help you succeed.