Eagle Ford Production Edges Down on Sharply Reduced Drilling


The economics of oil & gas production vary by region. Mercer Capital focuses on trends in the Eagle Ford, Permian, Haynesville, and Marcellus and Utica plays. This quarter we take a closer look at Eagle Ford.
Production and Activity Levels
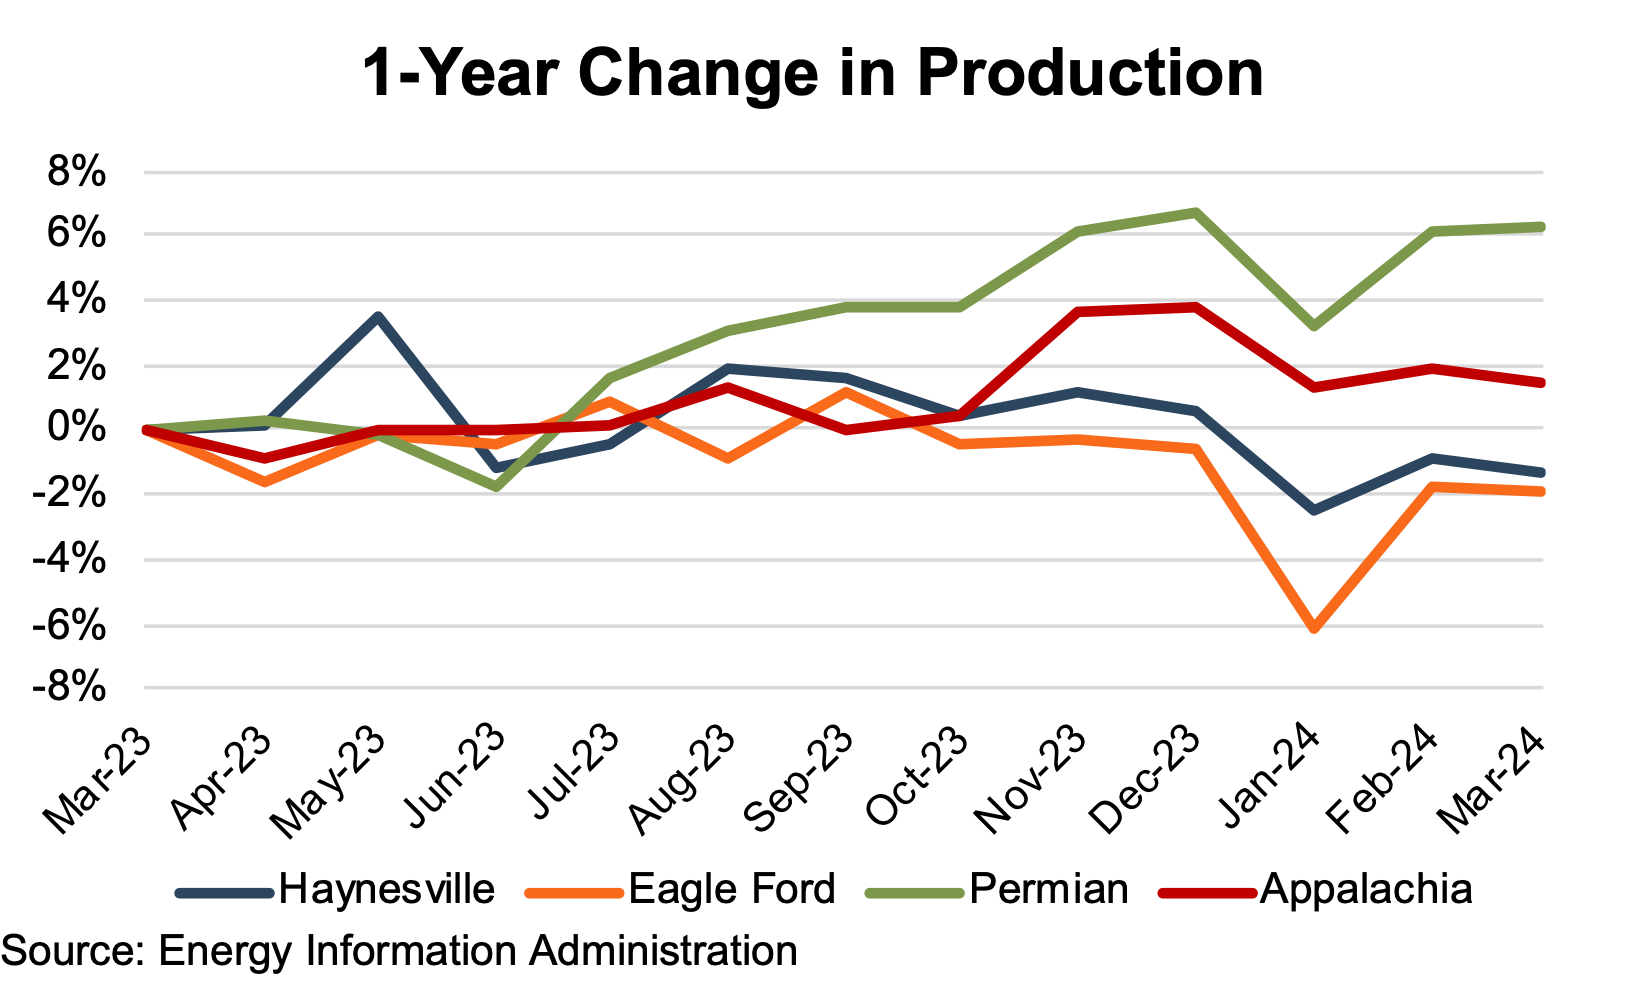
Eagle Ford production (on a barrels of oil equivalent, or “boe” basis) decreased nearly 2% year-over-year through March. Haynesville joined the Eagle Ford in posting year-over-year (YoY) production declines, albeit with a slightly smaller decline of just over 1%. The Appalachian basin (the Marcellus and Utica plays) posted a modest 2% YoY increase, while the Permian basin achieved a more robust 6% increase.
Production levels remained largely unchanged from March 2023 levels for the Eagle Ford, Permian, and Appalachian through July. Haynesville showed an unexpected jump in production in May (unexpected in light of operators’ first-quarter indications of expected fracking activity reductions). However, review period production changes fell back in line with the other basins the following month.
Beginning in July, Permian production steadily rose throughout the remaining review period. Eagle Ford, Haynesville, and Appalachian production generally continued along March 2023 levels through October. Beginning in November, Appalachian production rose to 1% – 4% above the March 2023 level, while Eagle Ford and Haynesville production held steady near March 2023 levels through December.
Production dipped in January across all the basins due to unseasonably cold weather but bounced back in February and March to end the quarter with only marginal declines. In volume, the Eagle Ford production began the review period at 2,428 mobe/d and generally declined throughout the twelve-month period to end at 2,383 mobe/d in March 2023.
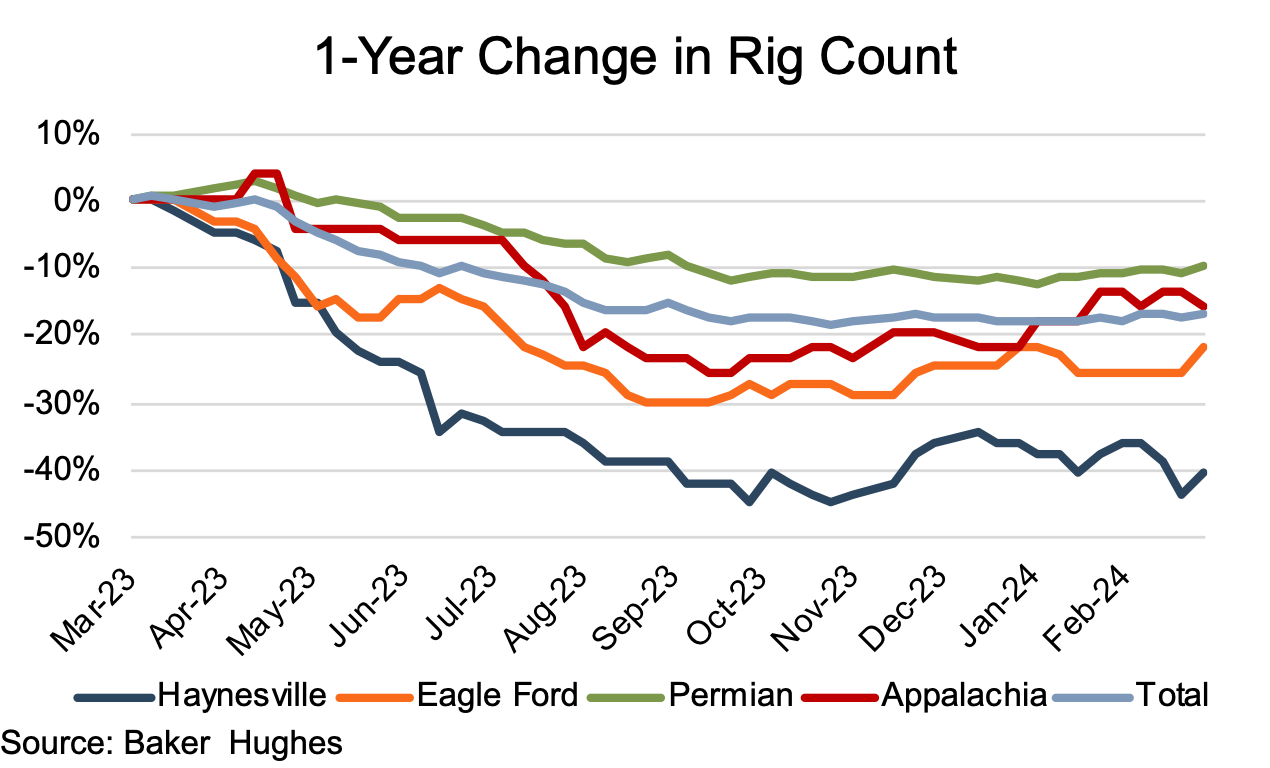
In light of production growth for the Permian and Appalachia and only modest production declines for the Eagle Ford and Haynesville basins, it might seem counterintuitive that rig counts turned markedly downward during the first half of the review period. YoY rig counts were down in all four basins — with a nearly 17% overall decline. The Eagle Ford posted a YoY decline of 21%, exceeded only by the Haynesville’s 40% plunge. The Permian showed the smallest decline at 10%, with Appalachia following at a 16% decline.
The majority of the YoY declines were incurred by late August, with the Permian rig count remaining largely unchanged for the next six months. Eagle Ford and Appalachia saw modest rig count growth in the latter half of the review period, with increases of 5% to 6%. Haynesville ended the last two quarters of the review period with an additional 2% decline. For the Eagle Ford, rig counts began the review period at 70 and trailed off to a period low of 49 rigs in September before a modest recovery to 55 rigs in March.
So, how were production levels maintained despite notable rig count declines? The answer is twofold — DUCs (drilled but uncompleted wells) and technology improvements. DUC counts declined from 5,435 to 4,483 (a nearly 18% decrease) over the review period, marking 952 wells that entered production without the current use of drilling rigs. In addition, the continuation of production technology improvements contributed to upholding production levels with less new drilling activity.
Commodity Prices
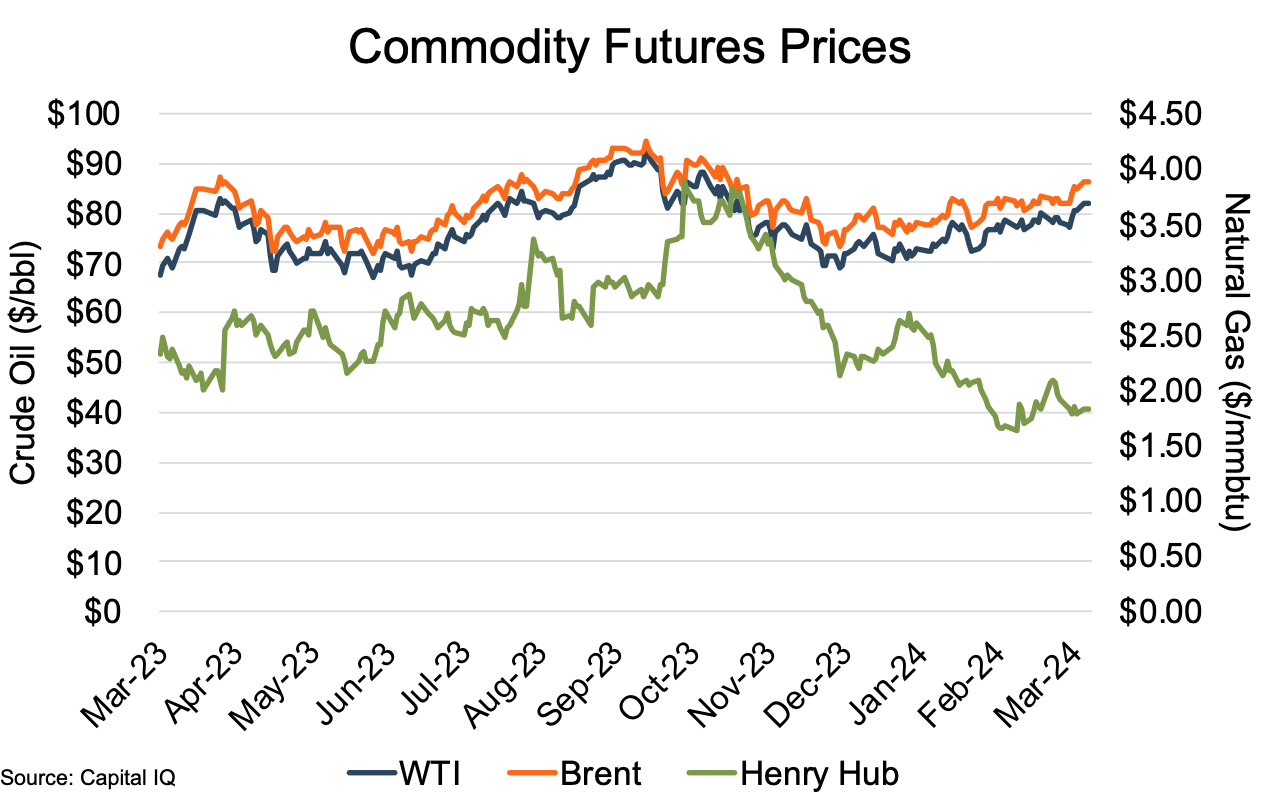
As represented by the WTI and Brent indices, oil prices rose 21% and 17%, respectively, over the review period, albeit with several directional changes over the year. WTI began the period at $67.82, with a period low of $67.29 in June and a high of $93.68 in September. Brent naturally followed a similar path, beginning at $73.54, with a review period low of $71.82 in June and a high of $94.36 in September.
Both indices saw early pricing increase through mid-April, reverse direction to return to March levels by early May, followed by a steady climb to review period highs in late September. During the latter half of the period, the indices initially declined through mid-December before a general increase through March 2024.
Natural gas prices, represented by the Henry Hub index, showed their typical greater volatility. After an early review period dip from $2.33 to $2.01 in mid-April, the index generally rose (albeit with multiple directional changes along the way) through early October to $2.84 before a spike to $3.88 in mid-October. During the latter half of the review period, the Henry Hub generally fell to end the period at $1.83.
Increased demand and stagnant production combined to push pricing upward through the 2023 summer months. However, late review period production increases and lower consumption in the residential and commercial sectors resulted in 11% higher inventories relative to the March 2023 level, pushing the index below its review period starting point for almost the entirety of 1Q2024.
Financial Performance
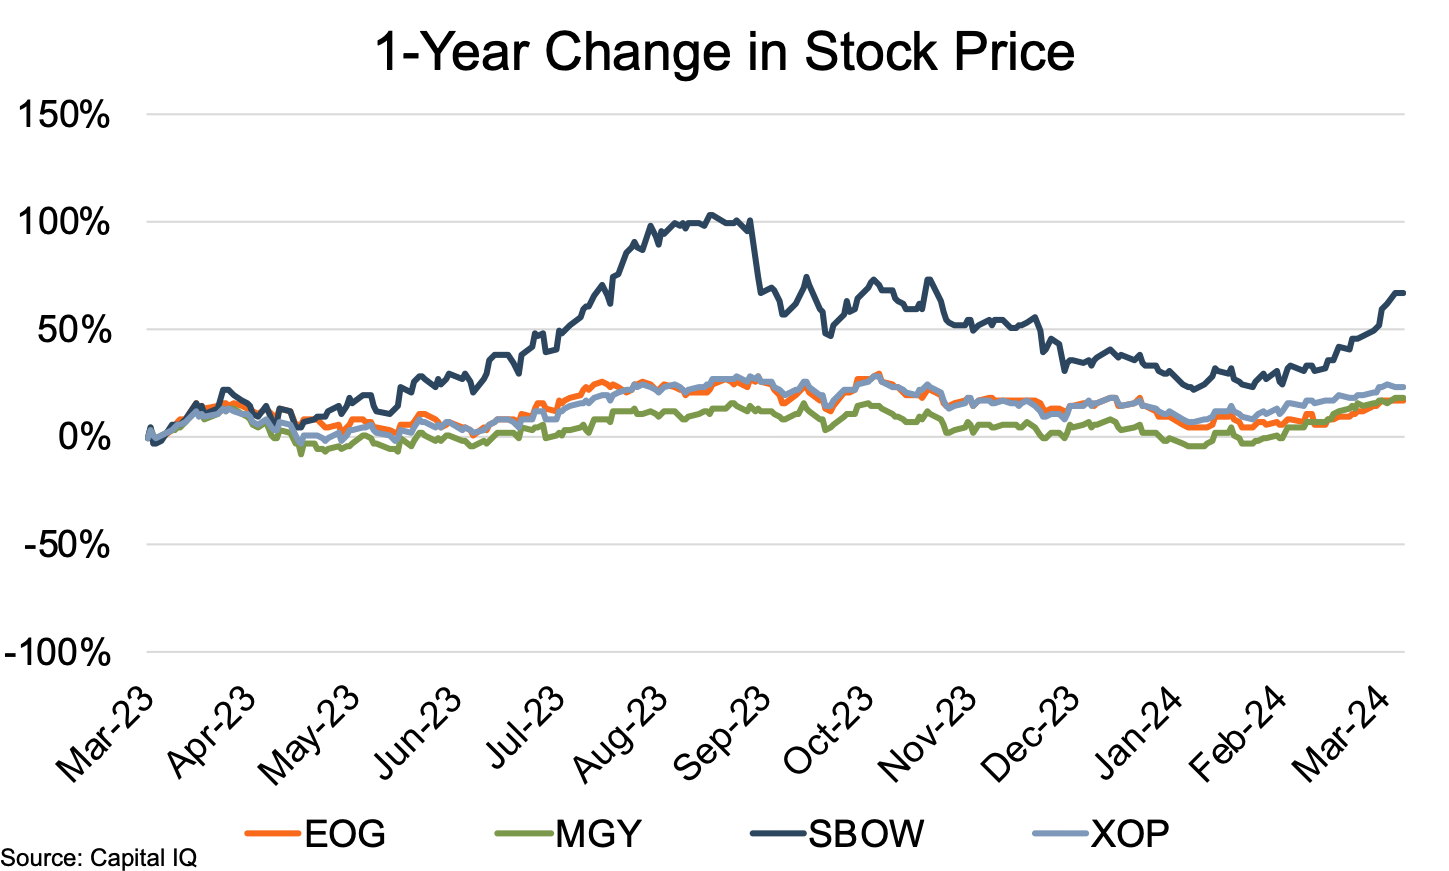
The public comp group for Eagle Ford showed stock price gains of 17% to 18%, excluding SBOWs 67% increase as a notable outlier. Review period share price increases for EOG and MGY ran as high as 29% and 18%, respectively, generally rising through September. Both companies’ share prices declined through mid-January before turning upward during the last two months of the review period.
SBOW’s stock price ran a different course, including strong runs over the summer months and again during the last two months of the review period. However, a long slide from mid-September ($42.16) to mid-January ($25.70) pushed the 104% review period increase as of August down to 23% as of mid-January.
Contributions to the share price’s wild ride included (i) a late spring call by a major shareholder for a review of strategic options including a possible sale, (ii) an agreement for a $700 million acquisition of Chesapeake Energy’s South Texas O&G assets in mid-summer, (iii) a public offering of three million shares in September, (iv) a shareholder push to re-vamp the company’s board in November, (v) a secondary offering of common stock in December, (vi) a take-over offer from the top shareholder (Kimmeridge Energy) in February (abandoned later that month), and (vii) a revised offer from Kimmeridge in March.
Conclusion
Despite significant rig-count declines, Eagle Ford production declined only modestly over the twelve months ended March 2024, aided by a significant number of DUCs going into production. Reasonably steady commodity prices helped offset the basin’s production decline, allowing the Basin comp group to post favorable price increases over the review period.
Although M&A activity in the Eagle Ford plummeted over the last twelve months with only two deals announced, Dani von Bassenheim, with Enverus Intelligence Research, notes that the Eagle Ford shale is one of a few areas that can expect an increased M&A activity in 2024 as the list of attractive targets in the Permian Basin has dwindled. Bassenheim further noted that “The core of the Eagle Ford is the gift that keeps giving for operators with the best acreage.” Despite denser development, recoveries remain high in core areas.
We have assisted many clients with various valuation needs in the upstream oil and gas space for both conventional and unconventional plays in North America and around the world. Contact a Mercer Capital professional to discuss your needs in confidence and learn more about how we can help you succeed.