Haynesville DUCs Buoy Production Despite Rig Count Decline


The economics of oil & gas production vary by region. Mercer Capital focuses on trends in the Eagle Ford, Permian, Haynesville, and Marcellus and Utica plays. The cost of producing oil and gas depends on the geological makeup of the reserve, depth of reserve, and cost to transport the raw crude to market. We can observe different costs in different regions depending on these factors. This quarter, we take a closer look at the Haynesville shale.
Production and Activity Levels
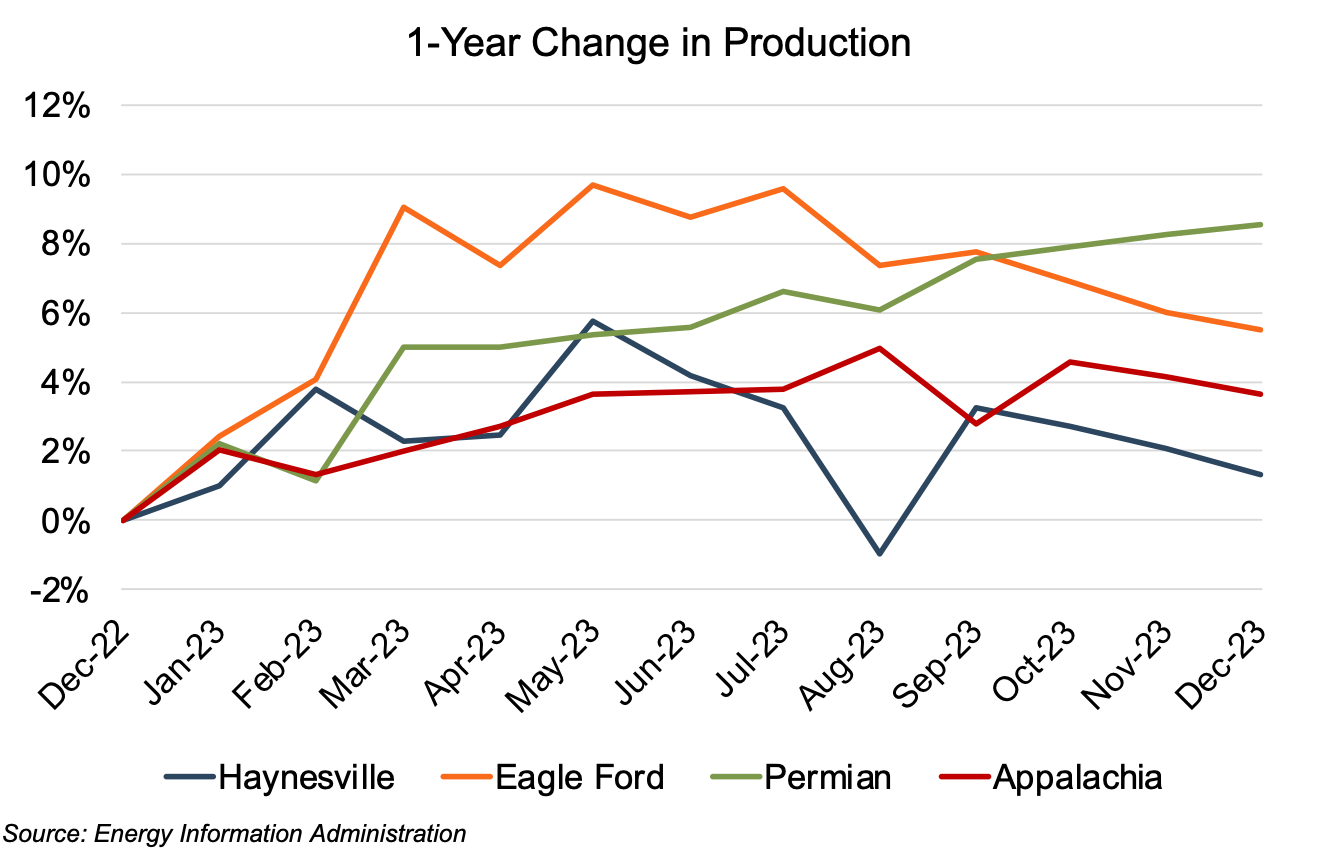
Estimated Haynesville production (on a barrels of oil equivalent, or “boe” basis) rose by 1.3% year-over-year through November — marking it as the basin with the smallest increase among those included in our analysis. While Haynesville production growth over December 2022 levels generally crept upward through April (reaching a high of 5.8% through April), the trajectory turned downward with only a single uptick month during the remainder of the year. Production growth in the remaining basins (the Eagle Ford, Permian, and Appalachian) was more robust, with the Eagle Ford posting the 2023 growth high mark at 9.7% in April. Year-over-year growth for those basins showed increases of 5.5%, 8.5%, and 3.6%, respectively. The slower expansion of the Haynesville can be attributed to its significant decline in rig count throughout 2023, surpassing the declines observed in the other three basins.
Achieving higher production in the face of declining rig counts (as discussed in the next section of our analysis) may seem contrary to logic. However, Robert Rapier (a senior Forbes contributor) points out that DUCs (drilled but uncompleted wells) declined from 5,300 near year-end 2022 to 4,500 in December 2023, for an 800 DUC decline. This represents 800 wells that began production during 2023 but without the need for any new drilling. Therefore, the basins were able to post increased production despite the decline in rig count.
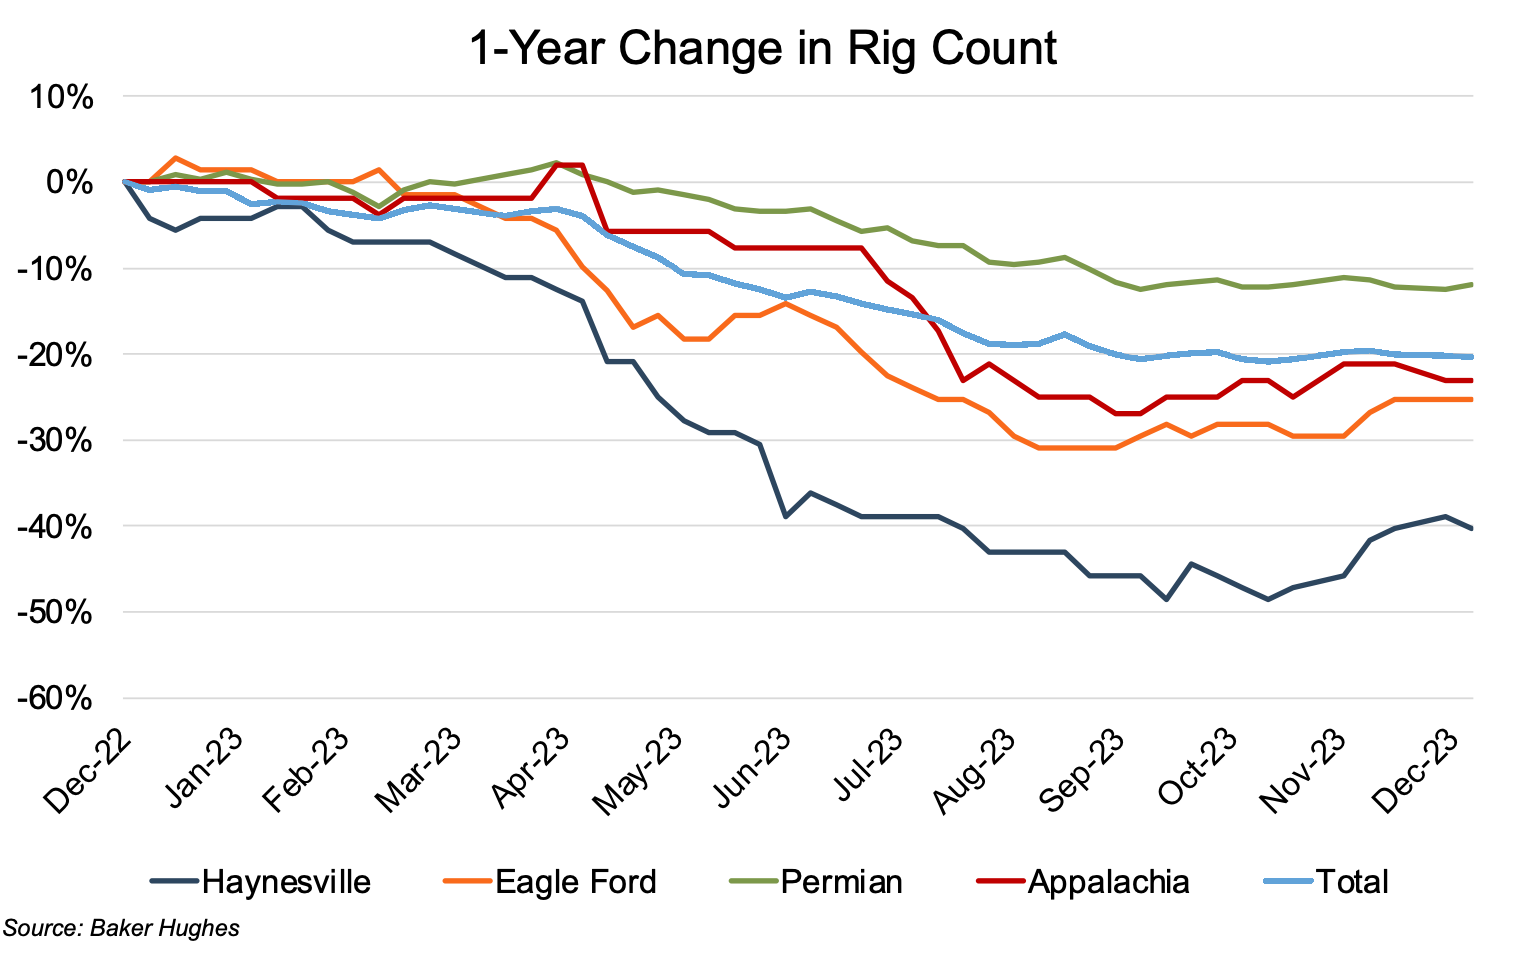
Rig counts fell by 20% over the course of the year, from 779 at year-end 2022 to 622 in the last week of 2023. Haynesville led the decline over the other basins with a year-over-year drop of 40% from 72 rigs to 43 with the Eagle Ford and Appalachian falling a much more modest 25% and 23%, respectively. The Permian, with its lower production costs, posted the smallest decline at 12%, from 353 to 310 rigs. The sharpest declines occurred in May and July-August for the Eagle Ford, Permian, and Appalachian basins. The Haynesville’s heavy decline period ran from February to June, with only eight weeks of no-change and one weekly increase during that 21-week period. That marked a rig count decline of 36%. EDA attributed the Haynesville decline to a rebalancing of the oversupplied natural gas market.
Commodity Price Volatility
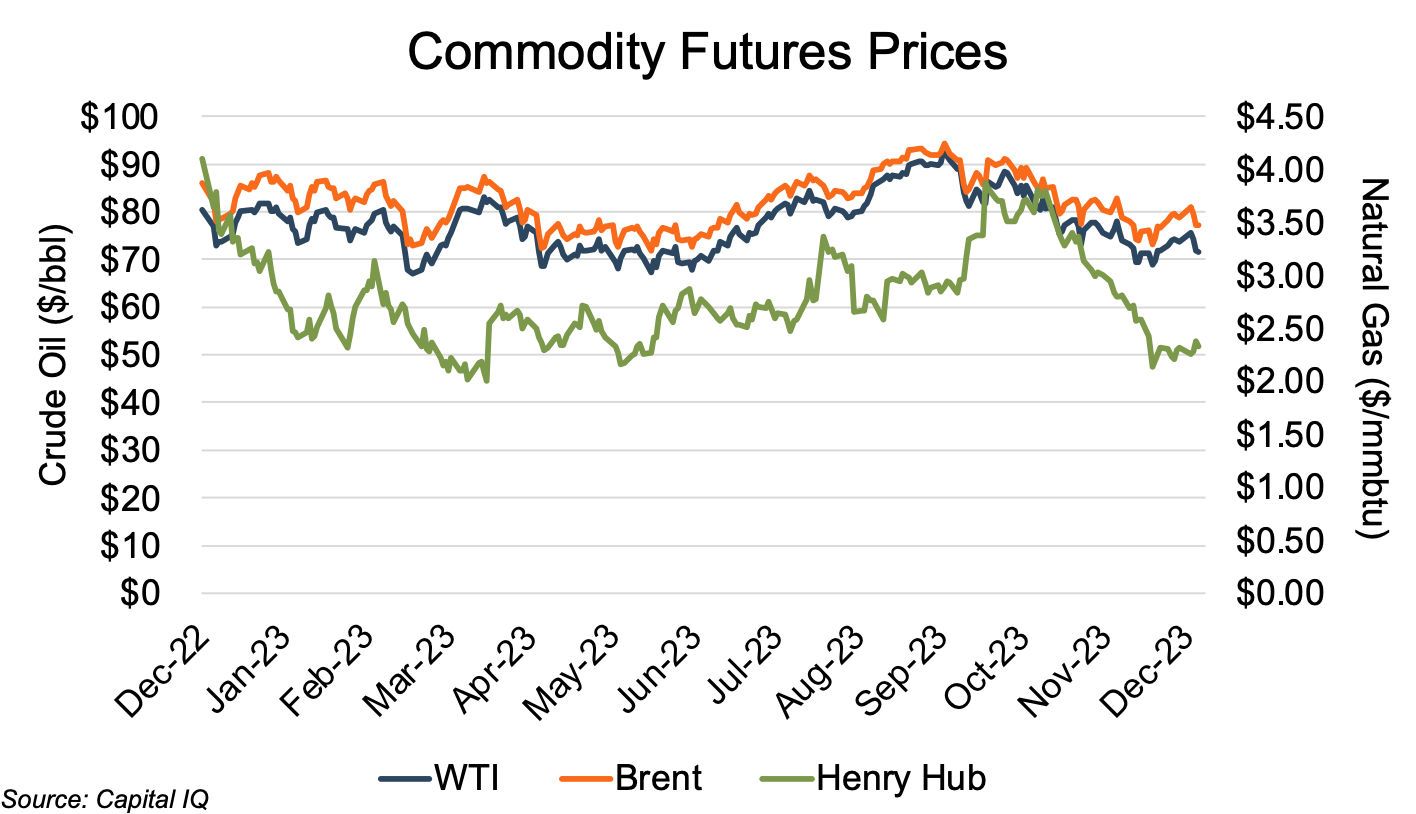
Henry Hub natural gas front month futures prices generally pushed downward through early April (albeit with a two-week upward run in late February), from $4.10 to $2.01, before beginning an April to October run-up to $3.80 in the first week of November. The natural gas benchmark turned south for the next nine weeks, reaching a second-half 2023 low of $2.14 in mid-December. While the Henry Hub pricing generally followed the same pattern of change as the West Texas Intermediate (WTI) and Brent Crude (Brent) oil benchmark prices, as is typical, the Henry Hub pricing showed much greater volatility with more pronounced directional changes and larger percentage runs in both directions.
The EIA attributed the 2023 natural gas pricing decline to record production that outpaced consumption, as indicated in its January 2024 In Brief Analysis and as depicted below.

Oil prices, as benchmarked by WTI and Brent, showed much less volatility than natural gas prices during the year, generally varying between $67 and $82 (WTI) and $73 and $89 (Brent) through early March. The price range narrowed slightly during May and June, with WTI only ranging from $67 to $76 and Brent from $71 to $80. The benchmarks began a three-month upward run in late June, reaching their 2023 highs — only to reverse course to head downward through mid-December.
Financial Performance
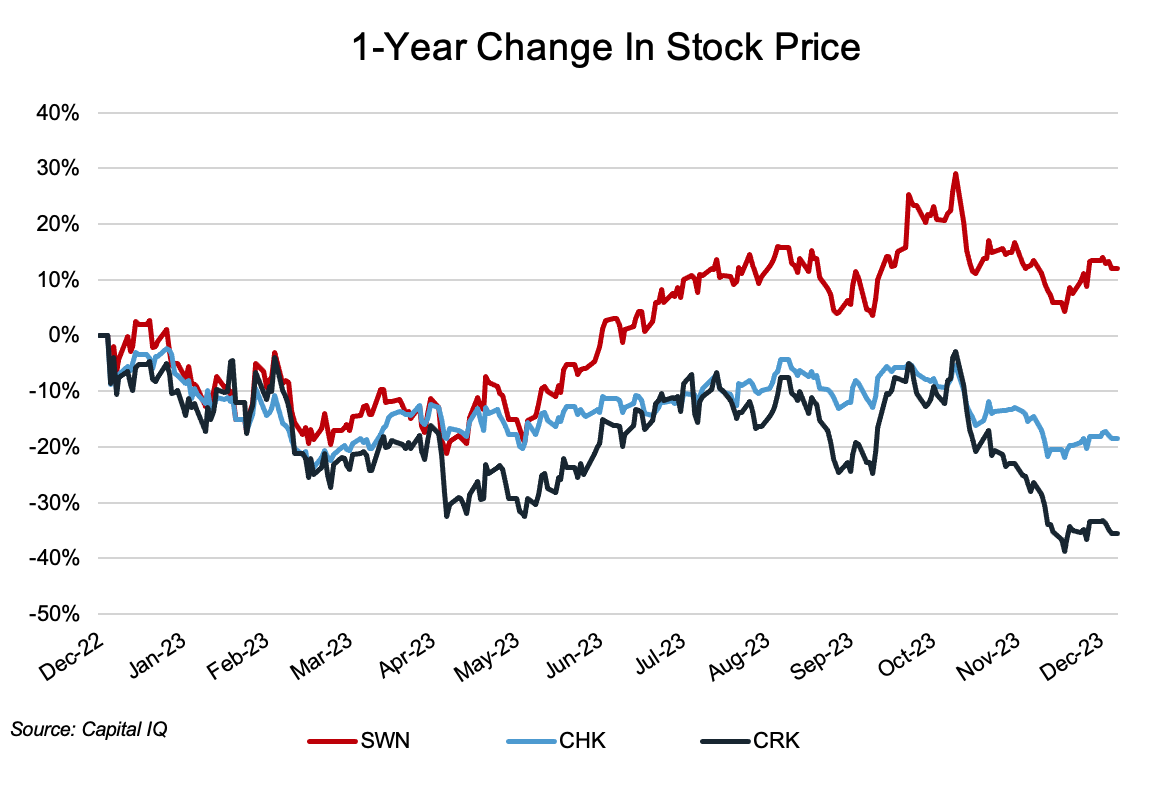
The Haynesville public comp group showed materially divergent stock price performance throughout the year, with Southwestern leading the group with a price increase of 12%. Chesapeake followed with an 18% decline, leaving Comstock with a 35% price plunge. Hedging strategies seem to explain a portion of the price performance differential in that Southwestern maintained a significant hedge book to protect cash flows, while Comstock had limited hedge coverage. All three companies showed equity value declines coinciding with Henry Hub pricing declines over the year, but highly-hedged Southwestern’s stock price showed a much smaller reaction to the commodity price dips than did the modestly-hedged Comstock.
Conclusion
Haynesville production held up reasonably well during the 2023 review period, particularly considering the sharp fall-off in the basin’s rig count. Despite the Henry Hub natural gas front month futures prices ending the year well below its starting point, the outlook for the Haynesville basin is favorable. Bhautik Gajera, writing for ADI Analytics, notes that Haynesville production is anticipated to continue growing due to rising demand from LNG facilities and petrochemical plant development along the U.S. Gulf Coast. In addition, Gajera notes that while existing Haynesville-to-Gulf Coast pipelines are adequate for 16 Bcf/d capacity, three new pipelines to support LNG facilities under development will add 5 Bcf/d of capacity by the end of 2024.
We have assisted many clients with various valuation needs in the upstream oil and gas space for both conventional and unconventional plays in North America and around the world. Contact a Mercer Capital professional to discuss your needs in confidence and learn more about how we can help you succeed.