Q4 2018 Review and Outlook for 2019


Oil Prices: 40% Off From Its Four-Year High
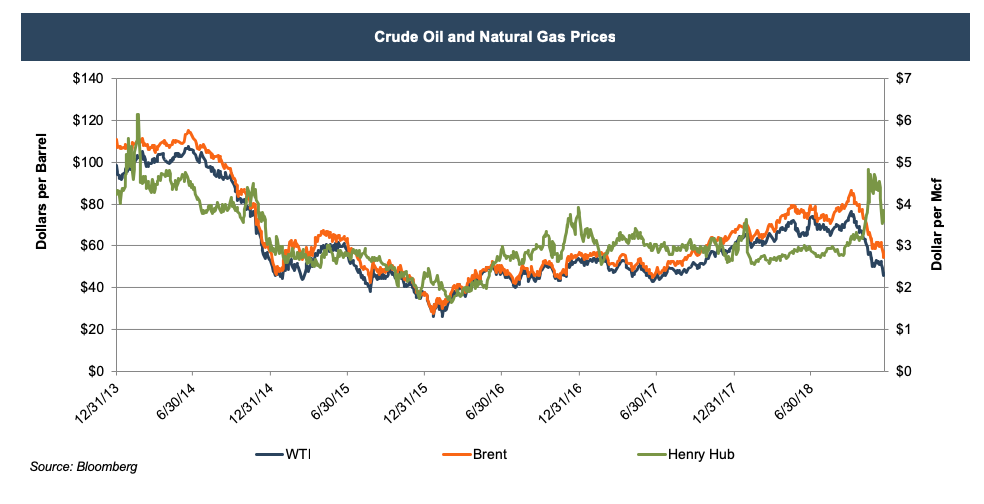
In the fourth quarter of 2018, U.S. crude oil prices plunged by 40%, from $75 in the beginning of the quarter to $45 per barrel. The sanctions on Iran, OPEC’s third-largest producer, seemed to be the last push to higher prices in late September. The recovery since 2016 has been primarily driven by the supply side of the equation: OPEC’s production cut lowered inventory, and geopolitical tensions (such as Iran and Venezuela). The years-long recovery ended in just three months. The reasons include concerns about swelling U.S. shale output, rising crude oil inventories, inconsistency in Russia and OPEC’s execution of their production deal, and fears of a global economic slowdown. OPEC’s deal with Russia to cut 1.2 million barrels per day during the December 6-7 meeting couldn’t stop oil prices from falling. The sharp decline once again proved higher prices driven by supply almost always have a difficult time lasting.
Natural Gas Prices: A Roller Coaster Ride in the Fourth Quarter
Natural gas prices soared to $4.70 per mcf in mid-November due to several factors including an early and colder winter hitting North America. It’s relatively rare to see the inverse relationship between crude oil and natural gas prices, which happened in the fourth quarter of 2018. A more than 50% increase in natural gas prices was coupled with nearly 30% downturn in crude oil prices during a seven-week period from early October to mid-November. Long oil short natural gas, once a popular trade by speculators, was punished during this unusual period of time. Natural gas prices ended the year at $3.25 per mcf, a 9.8% increase for the fourth quarter and 10.1% rise for the year. The roller coaster ride exhibits the notion that there are few long-term supply issues in natural gas in North America.
Outlook for 2019
It was truly a dramatic quarter for the industry. The fourth quarter of 2018 marked the end of the two and a half-year oil price recovery that began in 2016, while natural gas prices reached their highest point since 2014. Volatility disrupted capital intensive industries in general. Large investments consisting of millions, or even billions, may take years to complete while circumstances may totally change within a short period, such as the fourth quarter of 2018 we just experienced. However, many producers make capex decisions based on long-term expectations. The latest World Bank commodities price forecast released on October 29, 2018 shows Brent crude will average $74.0 in 2019 and approximately $69.2 from 2020 to 2023.
According to the December Short-Term Energy Outlook, the EIA expects global liquid fuels consumption to increase by 1.5 million barrels per day in 2019, with growth largely coming from China, the U.S., and India. Trade tensions between the U.S. and China remain high entering 2019 and have shaken up most, if not all, industries, and oil and gas is no exception. China ranks second in oil consumption and surpassed the U.S. as the world’s largest crude oil importer in 2017. Slower growth in China is looming for the demand side of crude oil. In 2019, the continuation of worldwide central banks tightening pressures global economic growth and the prices of assets and commodities. Higher rig counts and higher capital expenditures by major oil & gas companies worldwide during the recovery also cause concerns of oversupply. According to Baker Hughes, as of December 28, 2018, rig counts in the U.S. were 1,083, 16.7% higher than December 29, 2017.
Improving pipeline capacity and the combination of horizontal drilling and hydraulic fracturing continue to drive higher and more efficient production in the U.S.
In 2019, it is expected that the U.S. will continue to lead the growth in oil supply worldwide. Improving pipeline capacity and the combination of horizontal drilling and hydraulic fracturing continue to drive higher and more efficient production in the U.S. According to the EIA, U.S. crude oil production recently set a record of 11.5 million barrels per day in September 2018. For a single week in November 2018, the U.S. was a net exporter of crude oil and petroleum products. EIA expects U.S. crude oil production will average 10.9 million barrels per day in 2018, up from 9.4 million barrels per day in 2017, and will average 12.1 million barrels per day in 2019.
U.S. LNG daily production hit a record high of 5.28 Bcf in Christmas week, according to S&P Global Platts. Large-scale additions to production capacity in 2018 included Shell’s Prelude and Inpex’ Ichthys, both offshore Australia, and Novatek expanded its Yamal LNG facility, while demand is slowing down in Asia, the biggest LNG market in the world. Europe is likely to play the key role in absorbing all the additional production given geopolitical factors, pipeline capacity issues, and the controversial Nord Stream 2. Also, Gazprom’s contract for gas transit via Ukraine is expiring at the end of this year and surprise during negotiation is always possible among Russia, Ukraine, and Europe.
The EIA expects Brent spot prices will average $61 per barrel in 2019 and that West Texas Intermediate (WTI) crude oil prices will average about $7 dollar per barrel lower than Brent prices next year, while Henry Hub natural gas spot prices to average $3.11 per MMBtu in 2019. With ongoing oversupply concerns, stabilizing geopolitical tensions, and lower forecasts for global oil demand, it appears in 2019 oil prices have a long way to recover to its previous high in 2018.